Power Grids
-
Renewable-heavy grids: dividing the pie?
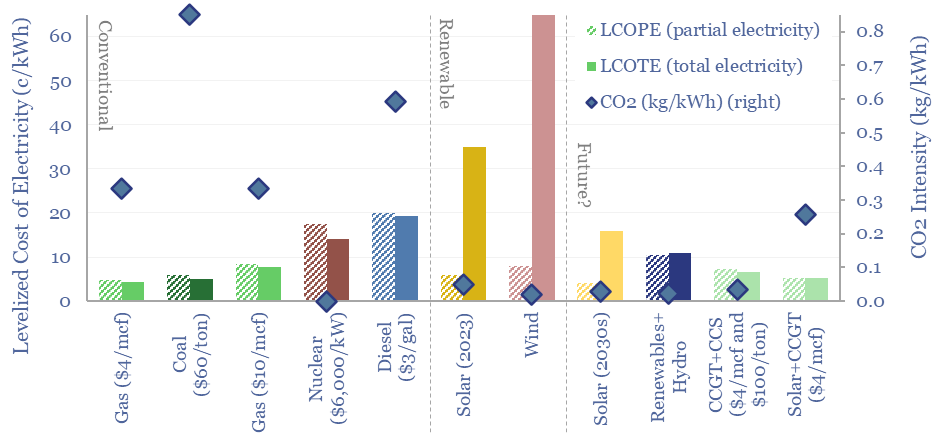
The levelized cost of partial electricity (LCOPE) is very different from the levelized cost of total electricity (LCOTE). This 21-page note explores the distinction. It suggests renewables will peak at 30-60% of power grids? And gas is well-placed as a back-up, set to surprise, by entrenching at 30-50% of renewables-heavy grids?
-
California electricity prices by hour?
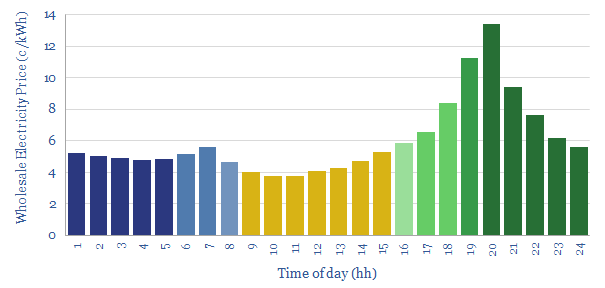
In 2023, power grids with c20-30% solar variation tend to have intra-day spreads of 9c/kWh, between peak wholesale electricity prices at 8pm and trough prices at 10am. Unusually, night-time electricity prices are 40% higher than day-time prices. This data-file quantifies California electricity prices, on a wholesale basis, at a sample of grid nodes, looking hour…
-
Renewables: the levelized cost paradox?
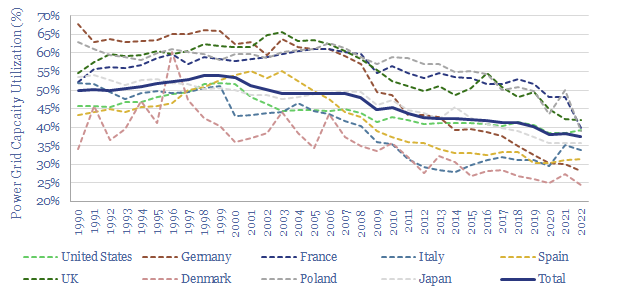
There is an economic paradox where shifting towards lower cost supply sources can cause inflation in the total costs of supply. Renewable-heavy grids are subject to this paradox, as they have high fixed costs and falling utilization. As power prices rise, there are growing incentives for self-generation. Energy transition requires a balanced, pragmatic approach.
-
Smooth operators: who benefits from volatile power grids?
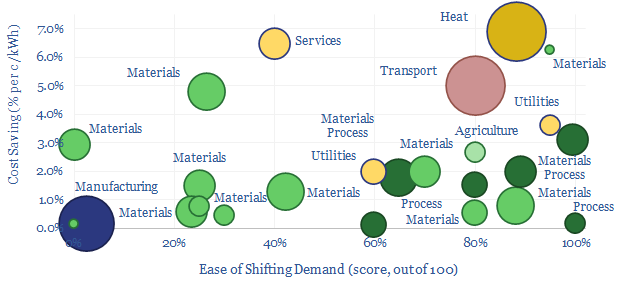
Some industries can absorb low-cost electricity when renewables are over-generating and avoid high-cost electricity when they are under-generating. The net result can lower electricity costs by 2-3c/kWh and uplift ROCEs by 5-15% in increasingly renewables-heavy grids. This 14-page note ranges over 10,000 demand shifting opportunities, to identify who can benefit most.
-
Demand shifting: electrical flexibility by industry?
Demand shifting flexes electrical loads in a power grid, to smooth volatility and absorb more renewables. This database scores technical potential and economical potential of different electricity-consuming processes to shift demand, across materials, manufacturing, industrial heat, transportation, utilities, residential HVAC and commercial loads.
-
Power grids: down to the wire?
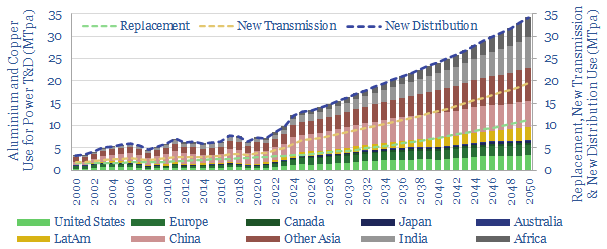
Power grid circuit kilometers need to rise 3-5x in the energy transition. This trend directly tightens global aluminium markets by over c20%, and global copper markets by c15%. Slow recent progress may lead to bottlenecks, then a boom? This 12-page note quantifies the rising demand for circuit kilometers, grid infrastructure, underlying metals and who benefits?
-
Global electricity prices vs. CO2 intensities?
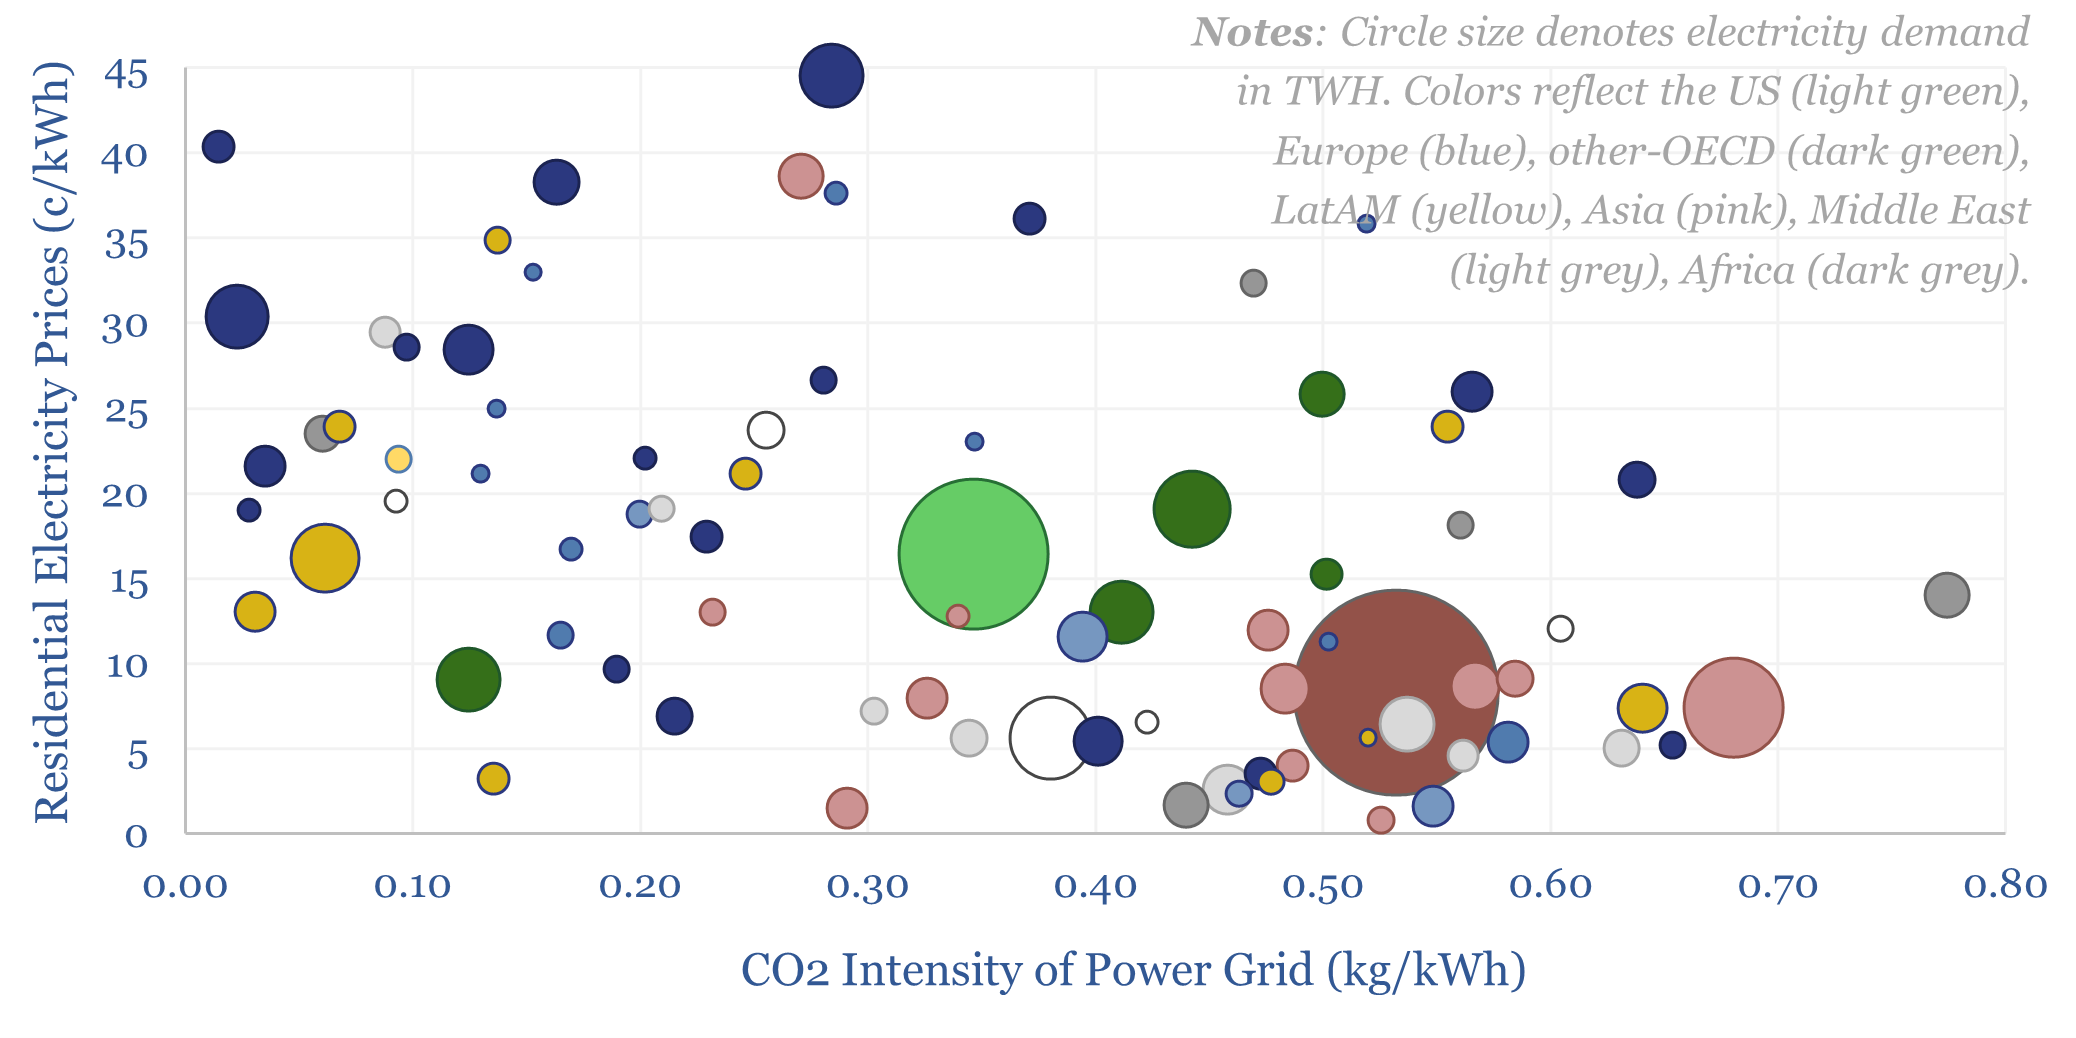
This data-file compares electricity prices (in c/kWh) vs power grids’ CO2 intensities (in kg/kWh), country-by-country. Retail electricity prices average 13c/kWh globally, of which 30-50% is wholesale power generation and 50-70% is transmission and distribution. The CO2 intensity of the global average power grid is 0.45 kg/kWh. Variations are wide. But there is a 60% correlation…
-
Diesel power generation: levelized costs?
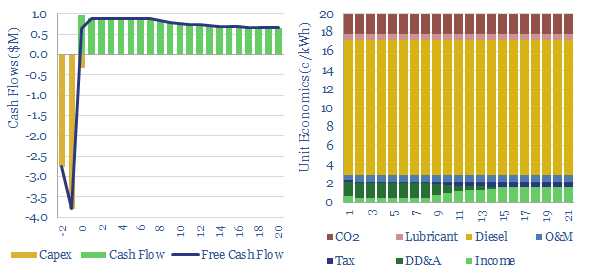
A multi-MW scale diesel generator requires an effective power price of 20c/kWh, in order to earn a 10% IRR, on c$700/kW capex, assuming $70 oil prices and c150km trucking of oil products to the facility. Economics can be stress-tested in the Model-Base tab.
-
Power grids: transmission and distribution kilometers by country?
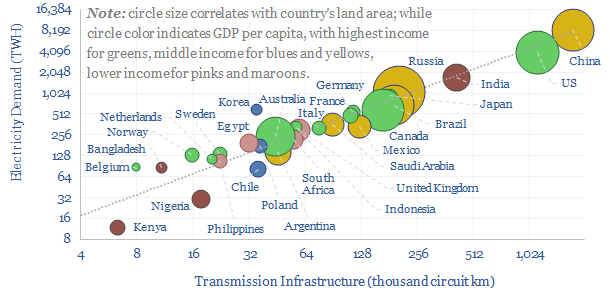
This data-file aggregates power transmission and distribution kilometers by country, across 30 key countries, which comprise 80% of global electricity use. In 2023, the world contains 7M circuit kilometers of power transmission lines and 110M kilometers of power distribution lines. Useful rules of thumb are in the data-file.
-
US electric utilities: leading companies in transmission and distribution?
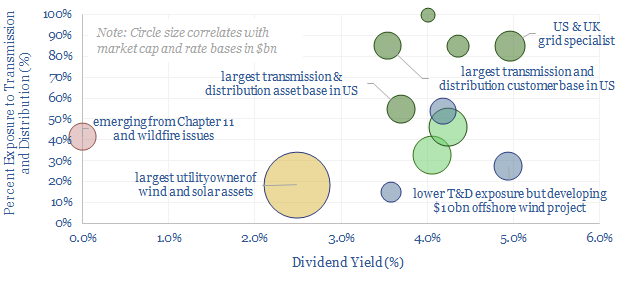
The average US electric utility has 25 GW of generation, 15,000-miles of power transmission, 100,000 miles of distribution, 8M customers, 3.5% dividend yields and 6.5% long-term target growth. We wonder if there is upside on expanding power grids? A dozen companies are in our screen.
Content by Category
- Batteries (96)
- Biofuels (44)
- Carbon Intensity (48)
- CCS (64)
- CO2 Removals (9)
- Coal (41)
- Commentary (65)
- Company Diligence (105)
- Data Models (924)
- Decarbonization (162)
- Demand (131)
- Digital (87)
- Downstream (47)
- Economic Model (221)
- Energy Efficiency (76)
- Hydrogen (63)
- Industry Data (308)
- LNG (56)
- Materials (86)
- Metals (88)
- Midstream (45)
- Natural Gas (161)
- Nature (76)
- Nuclear (28)
- Oil (176)
- Patents (39)
- Plastics (44)
- Power Grids (156)
- Renewables (153)
- Screen (138)
- Semiconductors (35)
- Shale (58)
- Solar (72)
- Supply-Demand (53)
- Vehicles (94)
- Video (24)
- Wind (47)
- Written Research (407)