Power Grids
-
Bottlenecked grids: winners and losers?
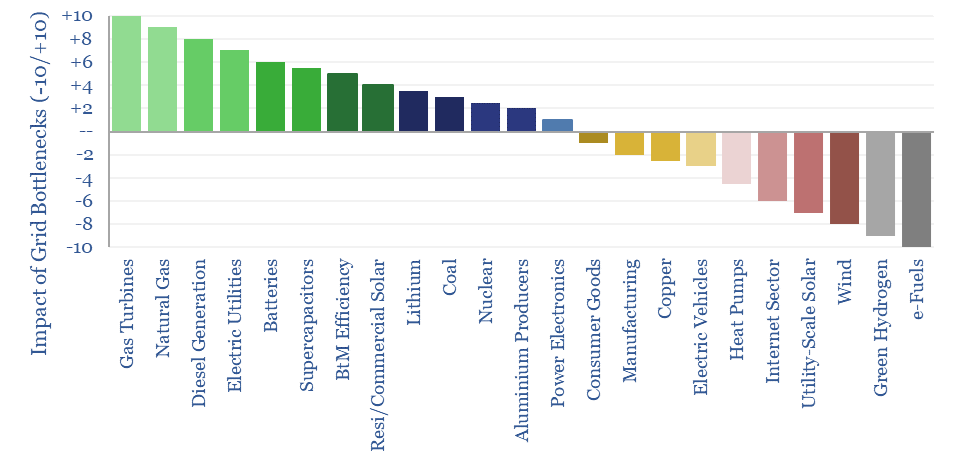
What if the world is entering an era of persistent power grid bottlenecks, with long delays to interconnect new loads? Everything changes. Hence this 16-page report looks across the energy and industrial landscape, to rank the implications across different sectors and companies.
-
Grid connection sizes: residential, commercial and industrial?
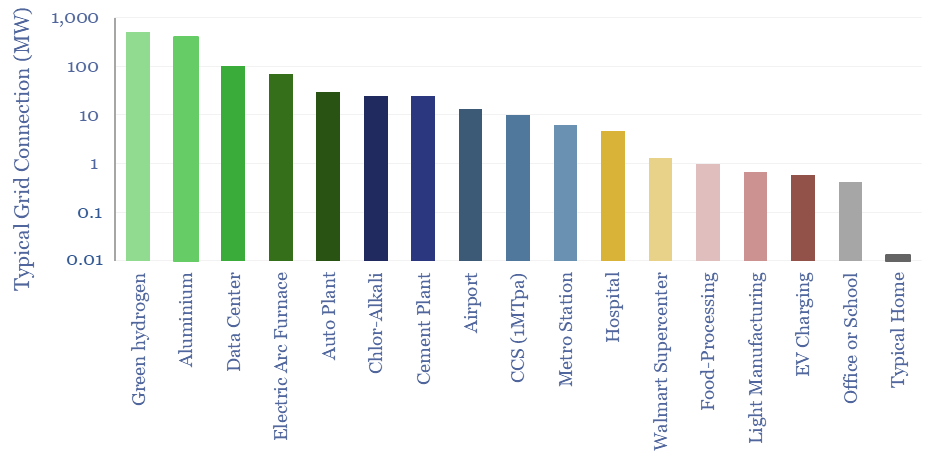
What are the typical sizes of grid connections at different residential, commercial and industrial facilities? This data-file derives aggregates estimates, from the 10kW grid connections of smaller homes to the GW-scale grid connections of large data-centers, proposed green hydrogen projects and aluminium plants.
-
Power grids: the biggest bottleneck in the world?
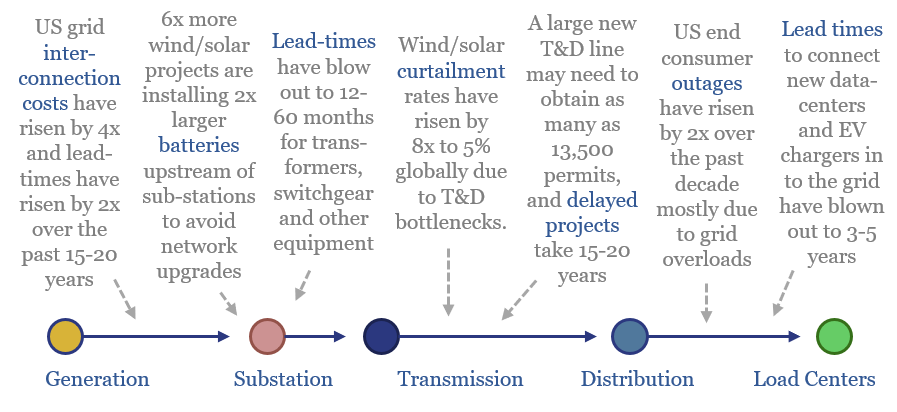
Power grids will be the biggest bottleneck in the energy transition, according to this 18-page report. Tensions have been building for a decade. They are invisible unless you are looking. And the tightness could last a decade. Further acceleration of renewables may be thwarted. And we are re-thinking grid back-ups.
-
Solar inverters: companies, products and costs?
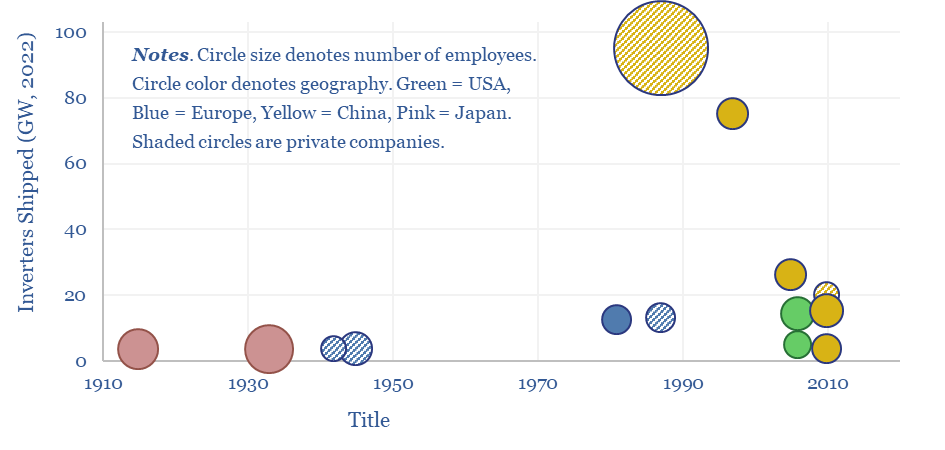
This data-file tracks some of the leading solar inverter companies and inverter costs, efficiency and power electronic properties. As China now supplies 85% of all global inverters, at 30-50% lower $/W pricing than Western companies, a key question explored in the data-file is around price versus quality.
-
Hydro power: generation by facility, availability over time?
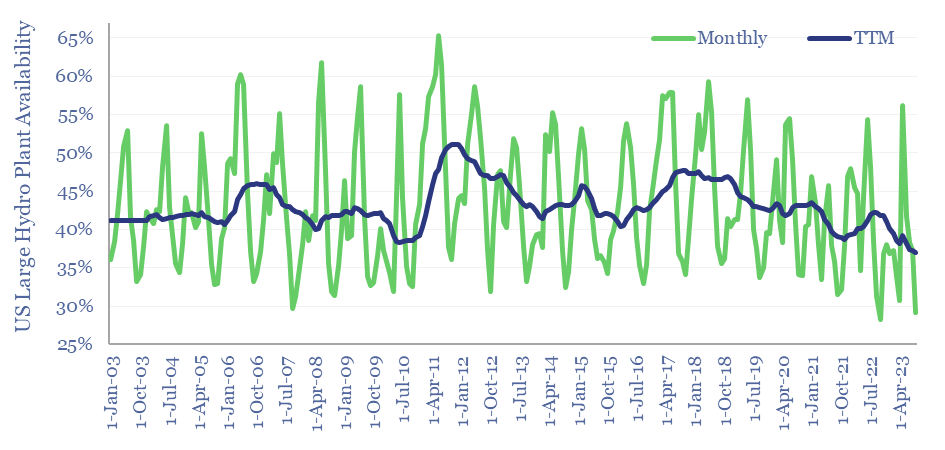
Hydro power generation by facility is tabulated in this data-file for the 20 largest hydro-electric plants in the US. The average facility achieves 43% availability, varying from 39% in hot-dry years to 51% in wet years; and from 33% at the seasonal trough in September-October to 53% at the seasonal peak in May-June. What implications…
-
Harmonic filters: leading companies?
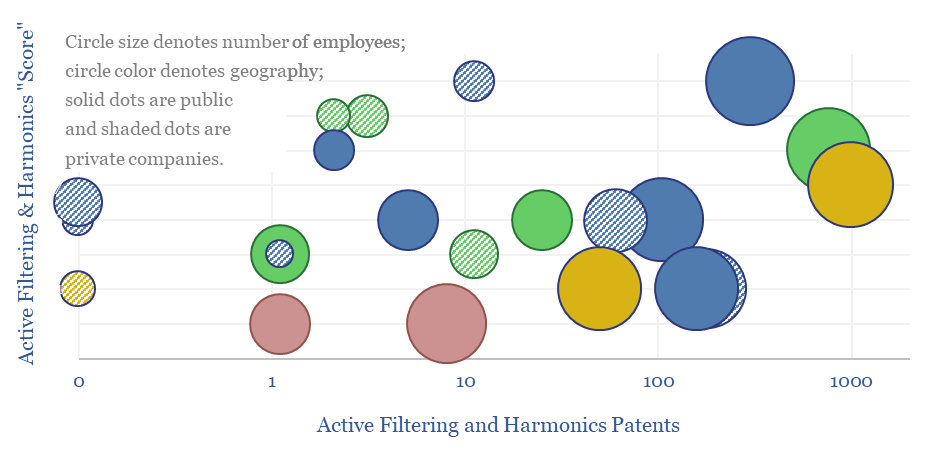
This data-file screens 20 leading companies in harmonic filters, tabulating their size, geography, ownership details, patent filings and a description of their offering. Active harmonic filters reduce total harmonic distortion below 5%, with 97% efficiency, within 5 ms. Half a dozen companies stood out in our screen, including one large, listed Western capital goods company.
-
Solar and wind: what decarbonization costs?
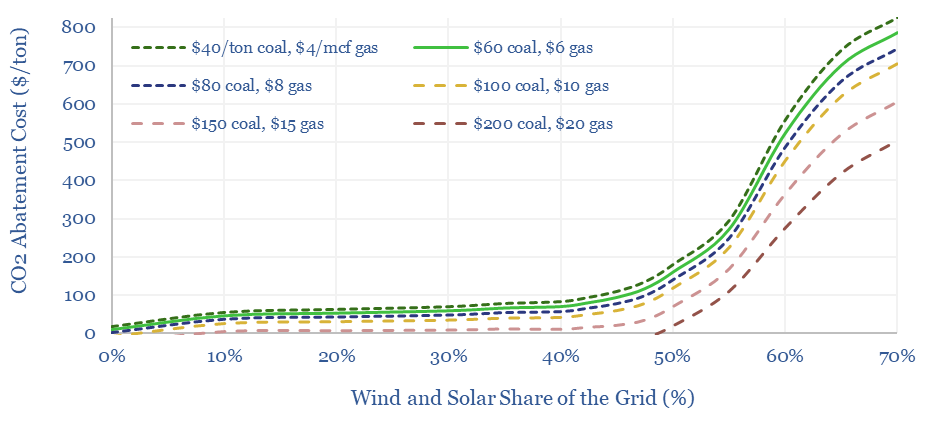
The costs of decarbonizing by ramping up solar and wind are highly dependent on context. But our best estimate is that solar and wind can reach 40% of the global grid for a $60/ton average CO2 abatement cost. This is a relatively low cost. Yet it still raises retail electricity prices from 10c/kWh to 12c/kWh.…
-
Power grids: when will wind and solar peak?
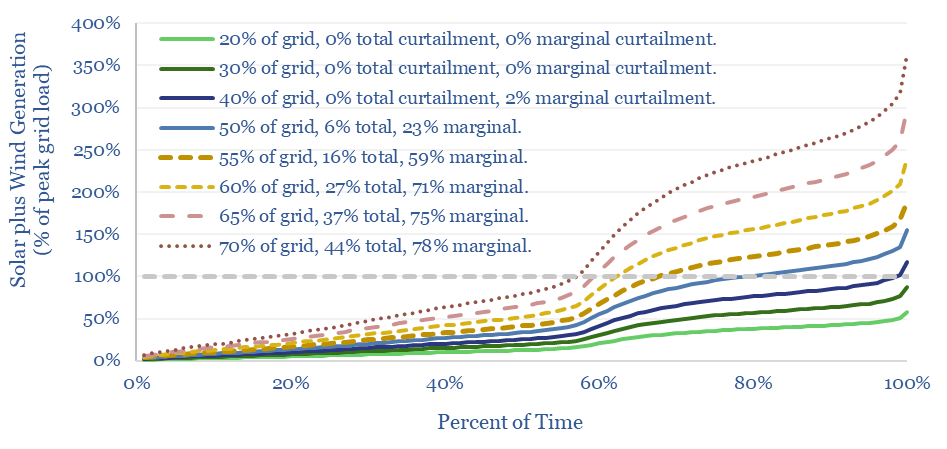
Wind and solar will most likely peak at 50-55% of power grids, without demand-shifting and batteries; more in wind-heavy grids, less in solar heavy grids. This 12-page note draws conclusions from the statistical distribution of renewables’ generation across 100,000 x 5-minute grid intervals.
-
California’s grid: wind and solar statistical distributions?
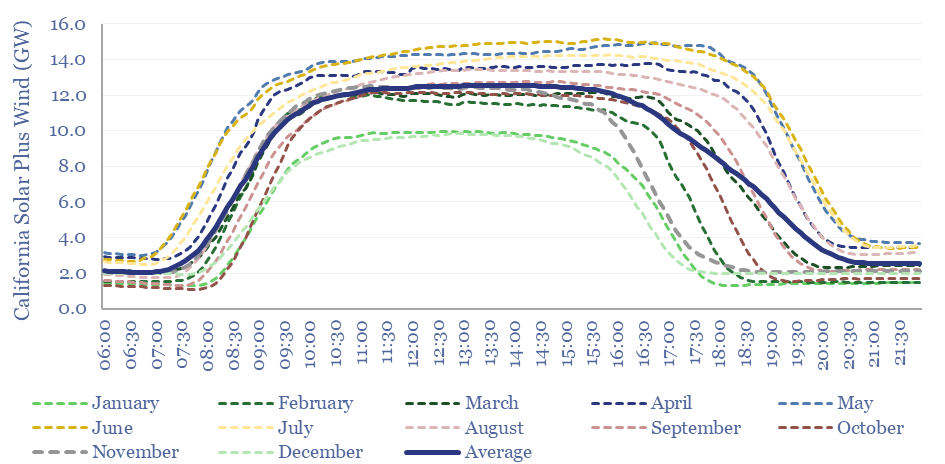
This data-file aggregates the statistical distribution of total electricity demand, solar generation and wind generation, every 5-minutes, across California, for the entirety of 2022, in order to understand their volatility and curtailment rates. The data suggest that wind and solar will most likely peak at 50-55% of renewables-heavy grids.
-
California power generation over time?

California’s power grid ranges from 15-61GW of demand. Utility scale solar has almost quadrupled in the past decade, rising from 5% to almost 24% of the grid. Yet it has not displaced thermal generation, which rose from 28% to 30% of the grid. We even wonder whether wind and solar are entrenching natural gas generators…
Content by Category
- Batteries (96)
- Biofuels (44)
- Carbon Intensity (48)
- CCS (64)
- CO2 Removals (9)
- Coal (41)
- Commentary (65)
- Company Diligence (105)
- Data Models (924)
- Decarbonization (162)
- Demand (131)
- Digital (87)
- Downstream (47)
- Economic Model (221)
- Energy Efficiency (76)
- Hydrogen (63)
- Industry Data (308)
- LNG (56)
- Materials (86)
- Metals (88)
- Midstream (45)
- Natural Gas (161)
- Nature (76)
- Nuclear (28)
- Oil (176)
- Patents (39)
- Plastics (44)
- Power Grids (156)
- Renewables (153)
- Screen (138)
- Semiconductors (35)
- Shale (58)
- Solar (72)
- Supply-Demand (53)
- Vehicles (94)
- Video (24)
- Wind (47)
- Written Research (407)