The volatility of power grids has doubled over the past decade from 2013-2024. This data-file tracks the percentile-by-percentile distributions of power prices, each year, in seven major grid regions (Texas, California, US MidWest, Australia, the UK, Germany, and Spain), as a way of tracking increases in global power price volatility.
The growing volatility of power grids is a major theme in our research, triggered by the rise of solar and wind, and the phase-back of baseload coal. This creates opportunities across peaker plants, midstream gas, energy trading and marketing, grid-scale batteries, some biofuels and biogas.
But how much is global power price volatility actually rising? You can drown in data, trying to answer this question!
Hence the goal of this tracker file is to tabulate the percentile-by-percentile distributions of power grids, across 8,760 hourly data-points each year, across >10-years, going back to at least 2013, in different developed world regions, and based on data from ERCOT, CAISO, MISO, Elexon, AEMO, BNetzA, and OMIE. We selected these regions, as they have steadily been increasing their share of wind and solar.
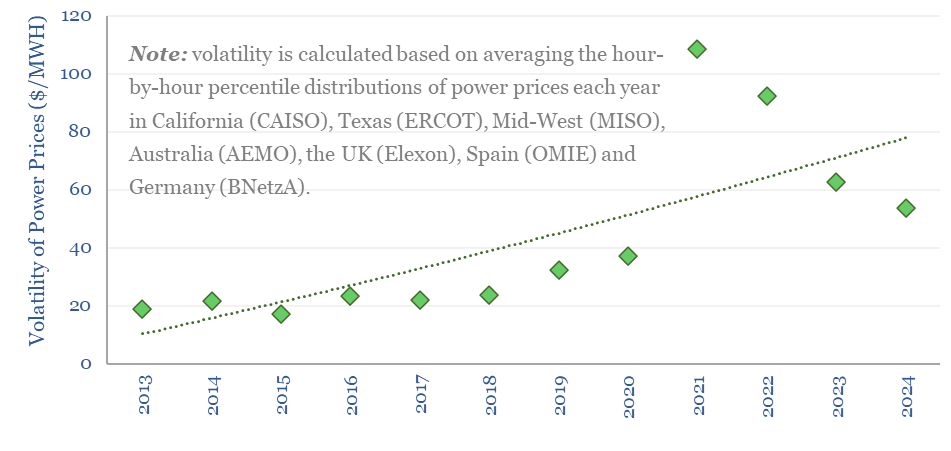
Volatility has increased, in every single market in the data-file (based on correlation coefficients on each tab), and when aggregating all of the data together, where in turn, standard deviations of hourly power prices have more than doubled from $20/MWH in 2013 to $50/MWH in 2024.
If we compare the pricing distributions in some individual years, then three observations stand out from the chart below.
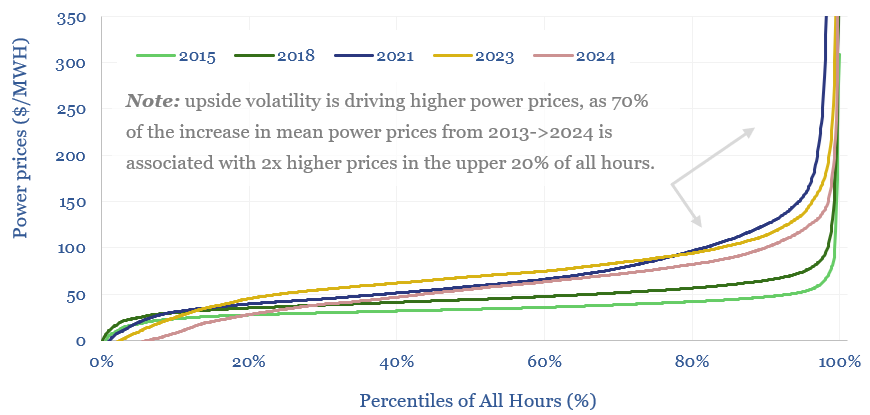
(i) Average power prices are higher, rising from $40/MWH in 2013 to $60/MWH in 2024.
(ii) Prices in the upper 20% of all hours have risen most, doubling from $60/MWH in 2013 to $120/MWH in 2024, and explaining 70% of the total increase in annual average power prices.
Yet (iii) Prices in the lower 20% of all hours have crashed, from $25/MWH in 2013 to just $7/MWH in 2024, reflecting times when grids are over-saturated with renewables.
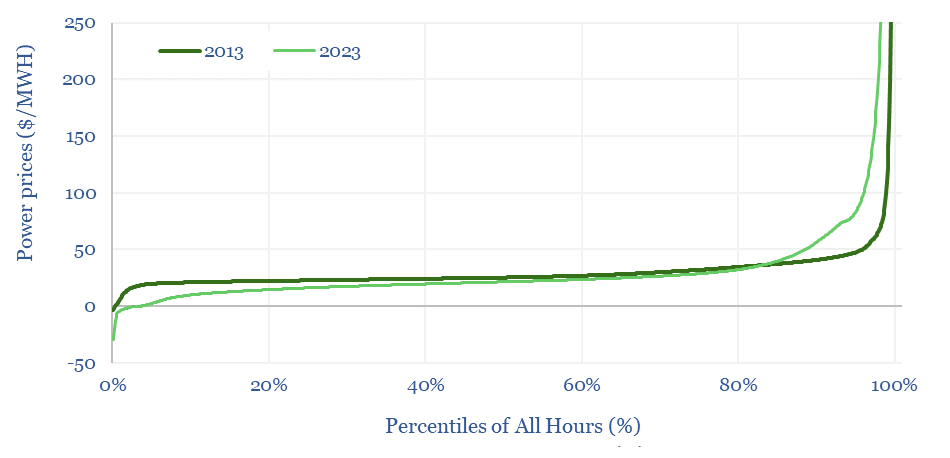
The most striking data in the file are in ERCOT 2023, where median settlement prices have fallen from $25/MWH in 2013 to $22/MWH in 2023, yet mean average power prices have risen from $31/MWH to $48/MWH over the same timeframe, which is entirely driven by pricing in the upper 20% of the distribution rising from $55/MWH in 2013 to $165/MWH in 2023, while the lower 20% tail has collapsed from $25/MWH in 2013 to below $20/MWH in 2023.
The most striking data in our 2024 update is that on average, over the seven grid regions we looked at, power prices were negative for almost 7% of all hours. That’s 1.5 hours of negative pricing every day, for the whole of 2024. In 2023, prices were negative for 2.5% of hours, and in 2022 just 1%.
The full distributions of power prices, across each percentile of hours each year, across each year from 2013-2024, and across each market – Texas, California, MISO, SW Australia, UK, Germany, and Spain – can be reviewed in the data-file, for decision-makers who wish to delve deeper into the charts and how global power price volatility is rising.