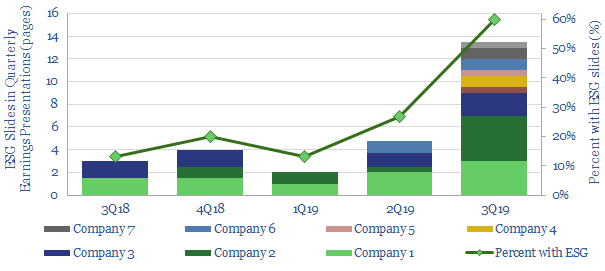
Of the largest 15 shale E&Ps, the proportion with ESG slides in their quarterly presentations has exploded by 4.5x in the trailing twelve months, from 13% in 3Q18 to 60% in 3Q19.
The progress is tracked in this short data-file, which counts the number of ESG slides published, by company, by quarter; as the industry articulates its carbon credentials in order to help attract capital.
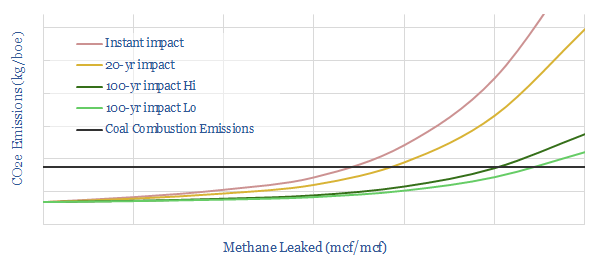
This short modelcalculates the impact of methane emissions on the CO2/boe of burning natural gas, compared against coal. With methane emissions fully controlled, burning gas is c60% lower-CO2 than burning coal.
However, taking natural gas to cause 120x more warming than CO2 over an immediate timeframe, the crossover (where coal emissions and gas emissions are equivalent) is 4% methane intensity. i.e., if 4-20% of methane is leaked, then the total warming from burning natural gas is equivalent to coal’s.
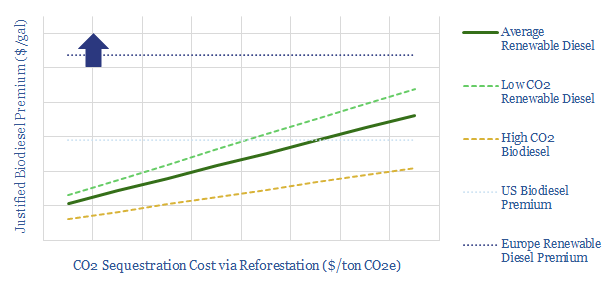
This short model compares different options for decarbonising diesel, either by substituting it with renewable diesel, or by offsetting its CO2 with carbon credits from reforestation.
We conclude that offsetting the CO2 of diesel fuel could cost 60-90% less than purchasing advanced biofuel, at current pricing. Economically justified premia for biofuels are calculated.
Please download the model to interrogate numbers and run your own scenarios. For more information on our input assumptions, please see our biofuels overview data-file.
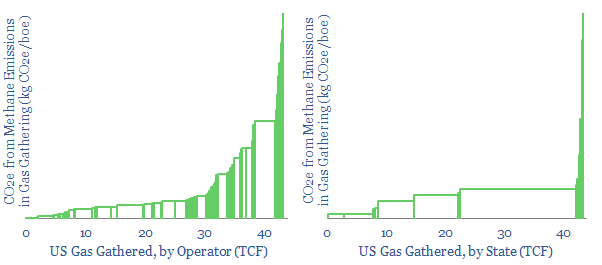
Gas gathering and gas processing are 50% less CO2 intensive than oil refining. Nevertheless, these processes emitted 18kg of CO2e per boe in 2018, hence the gas industry must strive to improve.
Methane matters most, explaining 1-7kg/boe of the gas industry’s CO2-equivalents, via leaks and fugitive emissions (and this is with 1 kg of methane translated into 25 kg of CO2e). Hence US methane intensity ran at c0.1-0.5% in 2018.
The numbers vary widely by geography and by operator, and are quantified in this data-file, after analysing 850 facilities’ EPA disclosures. Very detailed and comparable disclosures are broken out for US gas gathering, to screen for leaders and laggards.
Covered companies include Antero, BP, Denbury, DCP, DTE, Equinor, Equitrans, Energy Transfer Partners, Enlink, Enterprise Product Partners, EOG, ExxonMobil, Kinder Morgan, Oneok, Pioneer, Shell, Targa, Williams.
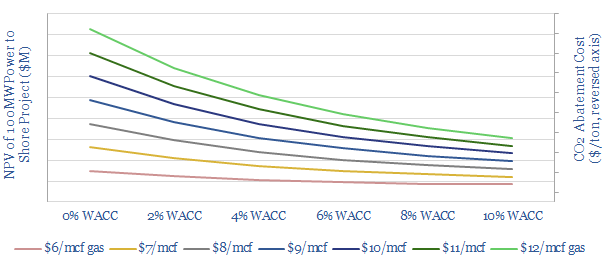
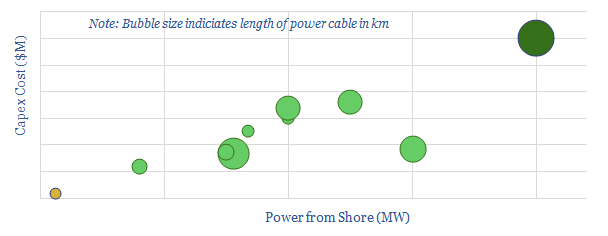
We model the economics of powering an oil platform from shore, using cheap renewable power instead of traditional gas turbines. This can lower upstream CO2 emissions by 5-15kg/bbl, or on average, around 70%; for a base case cost of $50-100/ton.
Our numbers are derived from reviewing technical papers, plus ten prior projects (mostly in Norway), which are tabulated in the data-file, including capex figures (in $M and $/W) where disclosed.
The costs of CO2 abatement can be flexed by varying inputs to the model, such as project size, gas prices, power prices and carbon prices.
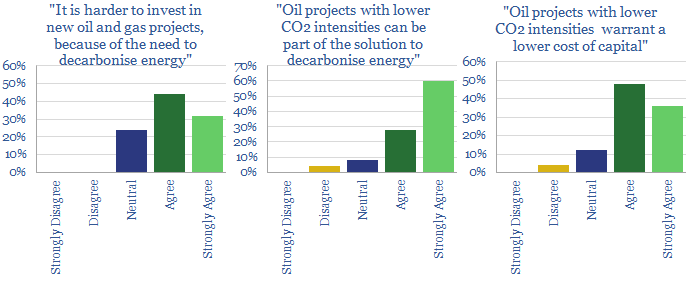
Lower carbon oil and gas may be increasingly valued by investors, earning higher multiples and lower costs of capital. This is the conclusion from our recent investor survey, linked here.
c80% now find it harder to invest in oil and gas, because of the need to decarbonise energy. However, 90% see lower carbon barrels as part of the solution. Hence 80% stated that lower capital costs could be warranted for these lower carbon producers.
Higher carbon barrels are currently being punished with c6% higher costs of capital, on average, compared with more typical projects. However, lower carbon barrels are not yet being rewarded, ascribed just 2% lower costs of capital, according to the survey data.
We will be happy to send a free copy of the data-file to all those that complete the survey, otherwise, it can be purchased below.
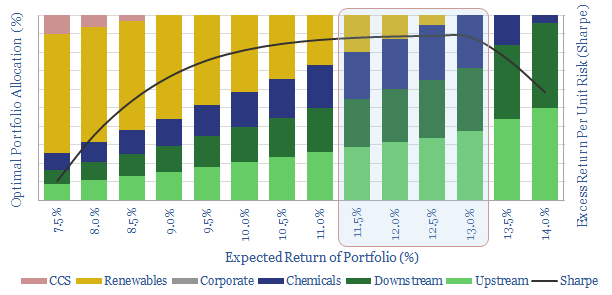
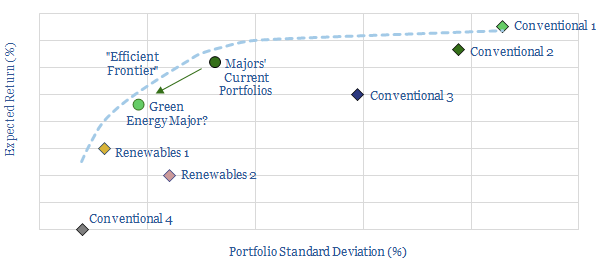
It is often said that Oil Majors should transition to renewables and become Energy Majors. But what is the best balance based on modern portfolio theory? Our 7-page paper answers this question by constructing a mean-variance optimisation model. We find a c0-20% weighting to renewables can maximise risk-adjusted returns. 5-13% is ideal. But beyond a c35% allocation, both returns and risk-adjusted returns decline rapidly to utility-type levels.
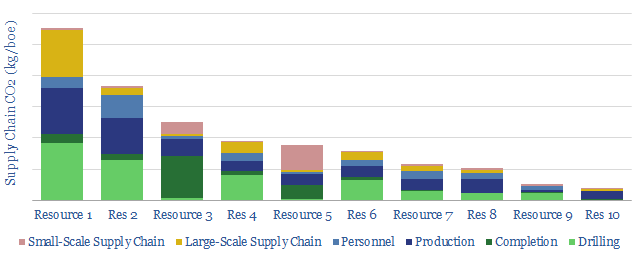
This data-file calculates the CO2 intensity of oilfield supply chains, across ten different resources, as materials are transported to drilling rigs, frac crews, production platforms and well pads.
Different resources can be ranked on this measure of supply chain CO2-intensity: such as the Permian, the Gulf of Mexico, offshore Norway, Guyana, pre-salt Brazil and Middle East onshore production (chart above).
Underlying the calculations are modeling assumptions, for both onshore and offshore operations, each based on c15 input variables. You can change the inputs to run your own scenarios, or test the most effective ways to lower supply-chain CO2.
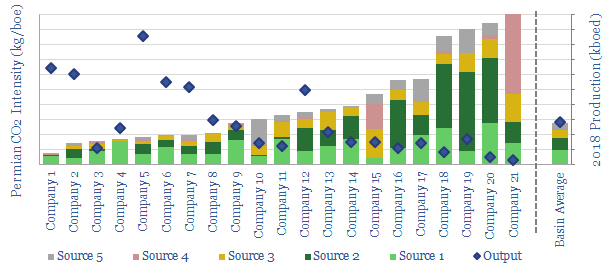
This data-file tabulates Permian CO2 intensity based on regulatory disclosures from 20 of the leading producers to the EPA in 2018. Hence we can calculate the basin’s upstream emissions, in tons and in kg/boe.
The data are fully disaggregated by company, across the 20 largest Permian E&Ps, Majors and independents; and across 18 different categories, such as combustion, flaring, venting, pneumatics, storage tanks and methane leaks.
A positive is that CO2 intensity is -52% correlated with operator production volumes, which suggests CO2 intensity can be reduced over time, as the industry grows and consolidates into the hands of larger companies.
This data-model calculates risk-adjusted returns available for different portfolio weightings in the energy sector, as companies diversify across upstream, downstream, chemicals, corporate, renewables and CCS investments. The methodology is a mean-variance optimisation based on modern portfolio theory.
Should Oil Majors become Renewable Energy Majors? Our model indicates returns would decrease by allocating more capital to renewables, but certain renewable allocations can nevertheless increase risk-adjusted returns, as quantified using Sharpe Ratios.
Please download the model to test the impacts of flexing portfolio weightings; either at our own risks, returns and diversification benefits; or under your own assumptions which can be tweaked in the model.