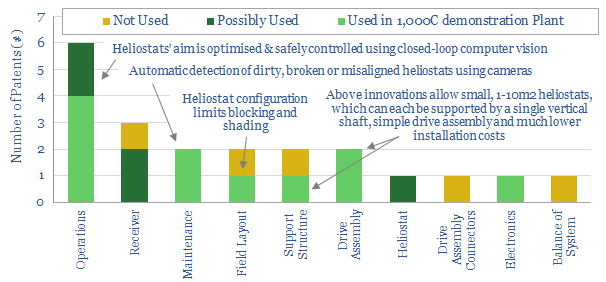
Heliogen has set a new record for concentrated solar power in November 2019, generating >1,000C temperatures from an array of c370 hexagonal mirrors, which are precisely controlled using computer vision. This is almost 2x traditional CSP plants which achieve c560C temperatures.
We have reviewed 21 patents from Heliogen’s predecessor company, eSolar, in order to understand its IP. Not only can it control heliostats more precisely than prior companies, but this allows the heliostats to be down-sized, conferring material cost-savings.
This data-file summarizes the technology, the patents, the costs (in c/kWh and $/mcfe) and the opportunity to decarbonise industrial heat and power generation.
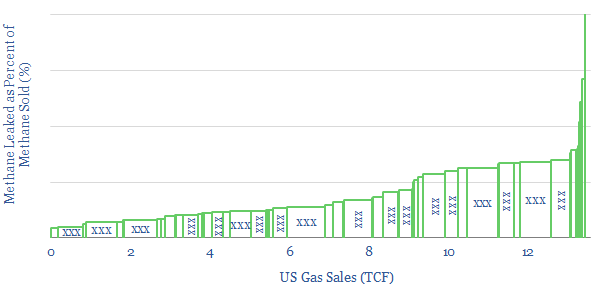
This data-file tabulates the methane emissionsfrom downstream gas distribution across 160 US gas networks, which cover 1.1M miles of mains, 61M metered customers and >90% of the country’s retail gas demand.
Downstream US methane leakagesaverage 0.2% by volume, explaining 5.7kg/boe of emissions. Two thirds of these leaks can be attributed to gas mains. Leakages are correlated with the share of sales to smaller customers. And state-owned utilities appear to have 2x higher leakage rates than public companies.
US gas utilities’ performance is screened to assess c80 distinct companies, including: Altagas, Atmos, Centerpoint, CMS, Dominion, DTE, Duke, Edison, National Grid, PG&E, Sempra, Southern Co, Spire, UGI, WEC & Xcel.
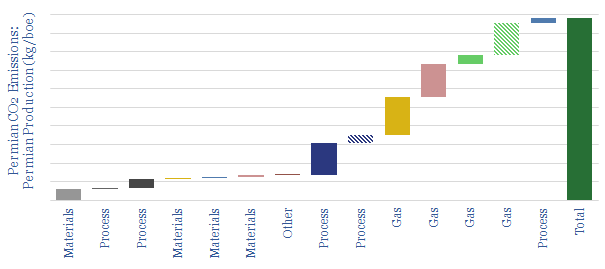
The CO2 intensity of shale oil averages 25kg/bbl, on a Scope 1&2 basis, of which 60% is from gas flaring and methane leaks. This model disaggregates CO2 emissions of shale oil, across 14 different contributors, aggregating across a dozen different models constructed by Thunder Said Energy.
Our base case estimate is that the Scope 1&2 CO2 intensity of shale oil is around 25 kg/bbl. This tallies with real-world data reported by operator.
The largest contributors to the CO2 footprint of shale are flaring and methane leaks, which collectively account for 60% of the total Scope 1&2 emissions. This is why there is such importance on improving gas utilization (e.g., from booming blue hydrogen value chains) and preventing methane leaks.
For a comparison with the CO2 intensity of other oil and gas processes, please see our data-file here. US shale oil embeds modestly higher Scope 1&2 CO2 than large offshore resources, but materially less CO2 than heavy oils and geographies with heavy flaring.
Our ‘idealized shale’ scenariofollows in a separate tab, showing how it could be achievable to make Permian shale production a ‘carbon neutral’ resource.
CO2 intensity can also be flexed by changing different input assumptions, such as methane leakage, flaring activity and well productivity; while we will be happy to share underlying models with you, for further sensitivity analysis.
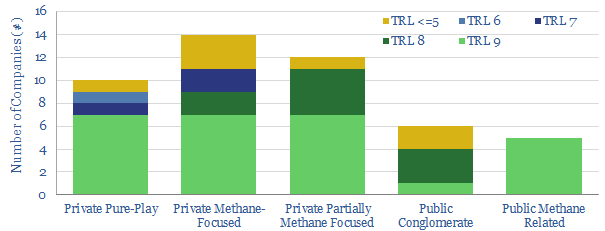
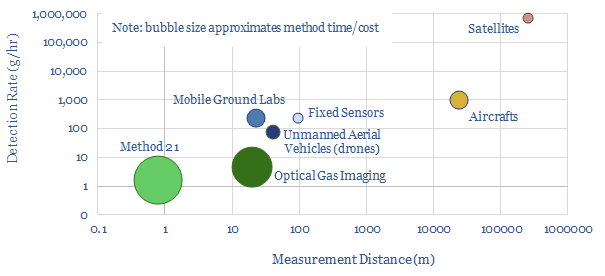
This data-file is a screen of companies detecting methane leaks and manufacturing equipment to minimize methane leaks. Mitigating methane is an important theme do ensure low carbon intensity as natural gas scales up and displaces coal in the energy transition. So how is this done? And which companies are enabling progress?
Methods available to monitor for methane emissions include Method 21, Optical Gas Imaging, Laser Based Imaging, Fixed Sensors, Ground Labs, Aircraft Flyovers, Drone Surveys and Satellite imagery. Technical data are presented on these different topics in the data-file, for example, on spatial resolution, costs and success rates of some of these different options. Some examples are below.
But the main purpose of the file is to aggregate details, into a screen of companies detecting methane leaks and manufacturing equipment to minimize methane leaks.
Looking across the screen, 50 companies are noted in the data-file. Around one-third are public, and two-thirds are private. Around two-thirds are deploying technically ready solutions today, while others are in the trial phase.
More detailed case studies are also provided in the data-file. For example, we include a case study of Qube, which is an exciting company in advanced sensors, alongside peers such as Soofie and Earthview. Likewise, we included a case study of QLM, which is an exciting company in laser imaging, alongside peers such as Longpath and Mirico.
Operators are also screened, across the dozen largest Energy Majors, to estimate their methane leaks and broader methane intensity across the supply chain.
We have been adding to this screen continuously since 2019. Our sense is that the space is evolving very quickly. For example, in 2021-22, the EPA proposed new regulation, requiring operators to survey for methane leaks, bi-monthly, at 10kg/hr resolution, then to follow up with more sensitive methods to remediate any diagnosed leaks. Many of the companies that are now at commercial stages were founded in the 2015-20 timeframe. This suggests that as we continue updating the screen, more and more companies will be emerging.
Our note into mitigating methane in the energy transition remains a useful reference for the importance of this theme, and our key conclusions.
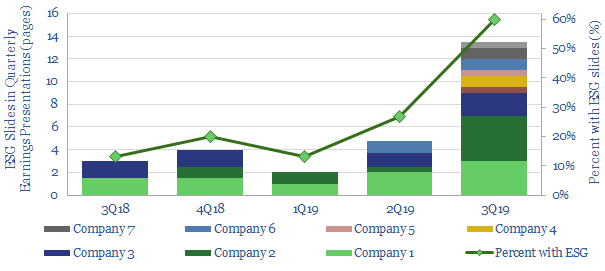
Of the largest 15 shale E&Ps, the proportion with ESG slides in their quarterly presentations has exploded by 4.5x in the trailing twelve months, from 13% in 3Q18 to 60% in 3Q19.
The progress is tracked in this short data-file, which counts the number of ESG slides published, by company, by quarter; as the industry articulates its carbon credentials in order to help attract capital.
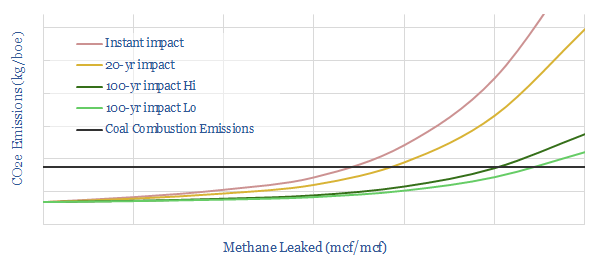
This short modelcalculates the impact of methane emissions on the CO2/boe of burning natural gas, compared against coal. With methane emissions fully controlled, burning gas is c60% lower-CO2 than burning coal.
However, taking natural gas to cause 120x more warming than CO2 over an immediate timeframe, the crossover (where coal emissions and gas emissions are equivalent) is 4% methane intensity. i.e., if 4-20% of methane is leaked, then the total warming from burning natural gas is equivalent to coal’s.
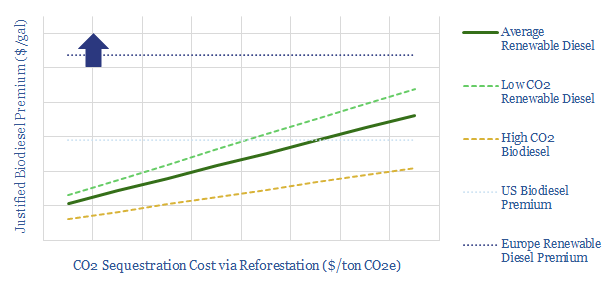
This short model compares different options for decarbonising diesel, either by substituting it with renewable diesel, or by offsetting its CO2 with carbon credits from reforestation.
We conclude that offsetting the CO2of diesel fuel could cost 60-90% less than purchasing advanced biofuel, at current pricing. Economically justified premia for biofuels are calculated.
Please download the model to interrogate numbers and run your own scenarios. For more information on our input assumptions, please see our biofuels overview data-file.
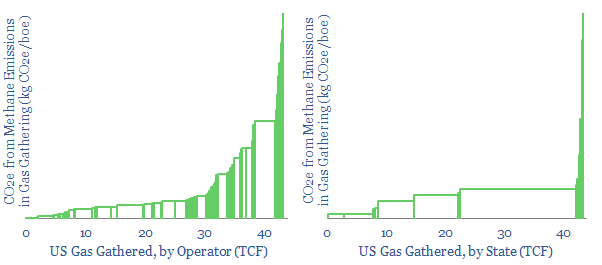
Gas gathering and gas processingare 50% less CO2 intensive than oil refining. Nevertheless, these processes emitted 18kg of CO2e per boe in 2018, hence the gas industry must strive to improve.
Methane matters most, explaining 1-7kg/boe of the gas industry’s CO2-equivalents, via leaks and fugitive emissions (and this is with 1 kg of methane translated into 25 kg of CO2e). Hence US methane intensity ran at c0.1-0.5% in 2018.
The numbers vary widelyby geography and by operator, and are quantified in this data-file, after analysing 850 facilities’ EPA disclosures. Very detailed and comparable disclosures are broken out for US gas gathering, to screen for leaders and laggards.
Covered companiesinclude Antero, BP, Denbury, DCP, DTE, Equinor, Equitrans, Energy Transfer Partners, Enlink, Enterprise Product Partners, EOG, ExxonMobil, Kinder Morgan, Oneok, Pioneer, Shell, Targa, Williams.
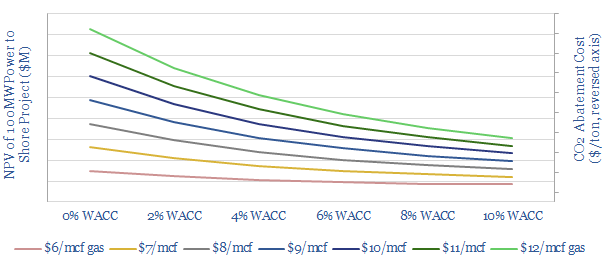
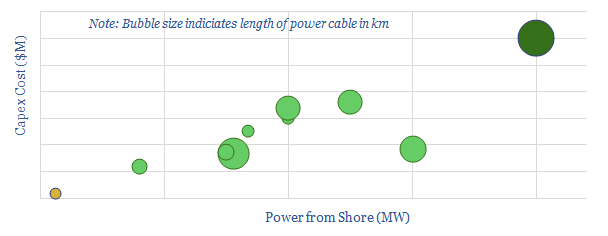
We model the economics of powering an oil platform from shore, using cheap renewable power instead of traditional gas turbines. This can lower upstream CO2 emissions by 5-15kg/bbl, or on average, around 70%; for a base case cost of $50-100/ton.
Our numbersare derived from reviewing technical papers, plus ten prior projects (mostly in Norway), which are tabulated in the data-file, including capex figures (in $M and $/W) where disclosed.
The costs of CO2 abatementcan be flexed by varying inputs to the model, such as project size, gas prices, power prices and carbon prices.
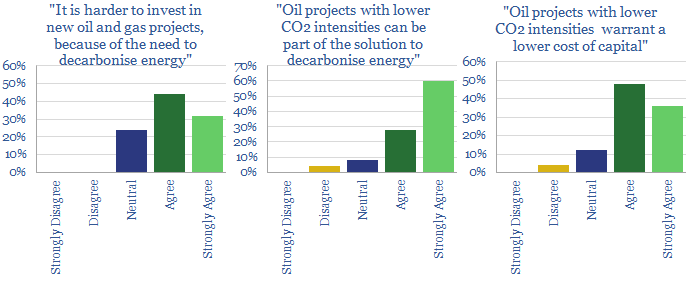
Lower carbon oil and gas may be increasingly valued by investors, earning higher multiples and lower costs of capital. This is the conclusion from our recent investor survey, linked here.
c80% now find it harder to invest in oil and gas, because of the need to decarbonise energy. However, 90% see lower carbon barrels as part of the solution. Hence 80% stated that lower capital costs could be warranted for these lower carbon producers.
Higher carbon barrelsare currently being punished with c6% higher costs of capital, on average, compared with more typical projects. However, lower carbon barrels are not yet being rewarded, ascribed just 2% lower costs of capital, according to the survey data.
We will be happy to send a free copy of the data-file to all those that complete the survey, otherwise, it can be purchased below.
Cookies?
This website uses necessary cookies. Our cookies are simply to improve your experience. We do not undertake any advertising or targeting via our cookies. By clicking 'accept' or continuing to use the website, you consent to our use of cookies.AcceptRead More
Privacy & Cookies Policy
Privacy Overview
This website uses cookies to improve your experience while you navigate through the website. Out of these, the cookies that are categorized as necessary are stored on your browser as they are essential for the working of basic functionalities of the website. We also use third-party cookies that help us analyze and understand how you use this website. These cookies will be stored in your browser only with your consent. You also have the option to opt-out of these cookies. But opting out of some of these cookies may affect your browsing experience.
Necessary cookies are absolutely essential for the website to function properly. This category only includes cookies that ensures basic functionalities and security features of the website. These cookies do not store any personal information.
Any cookies that may not be particularly necessary for the website to function and is used specifically to collect user personal data via analytics, ads, other embedded contents are termed as non-necessary cookies. It is mandatory to procure user consent prior to running these cookies on your website.