Global CCS Projects Database

Database of Global CCS Projects

This data-file captures 65 carbon capture and storage (CCS) facilities around the world, of which c30 are currently running, with capacity to sequester 40MTpa of CO2. Capacity should rise 2.5x by 2030.

As costs deflate, CCS is expanding to more countries, more industries and away from EOR towards dedicated geological storage (charts above).

The full data-file includes each facility, its location, involved companies, construction status, volumes (MTpa), CCS process, industrial source of CO2, start-up, storage type, capex ($M where available), capex cost ($/ton where available) and 2-3 lines of notes per facility.

EOG’s Digitization: Pumped-Up?

EOG's digitization patent

EOG patented a new digital technology in 2019: a load assembly which can be built into its rod pumps: to raise efficiency, lower costs and lower energy consumption (i.e., CO2). This short note reviews the patent, illustrating how EOG is working to further digitize its processes, maximise productivity and minimise CO2 intensity.

Variable Power Tariffs Exacerbate Social Inequalities?

Renewable Electricity Tariffs Exacerbate Social Inequality

This data-file tabulates the impacts of variable electricity tariffs, after switching 4.622 households over from fixed electricity tariffs, across a large-scale sample in the United States. This theme is increasingly important as intermittent renewables reach in developed world power grids (note here).


Residential electricity demand is inelastic, with a 20% price-increase yielding a mere 1% reduction in end-demand. Peakload demand fell by 4%.

However, socially “vulnerable” consumers suffered disproportionately, only achieving a 2% decrease in peakload demand. Hence, while monthly power prices rose by 18% for non-vulnerable consumers, they rose by 22% for vulnerable consumers. The results, data and study are in the data-file.

We do think that power grids will increasingly need to offer economic incentives for demand shifting, amidst increasing deployment of renewables. However based on past studies, they may need to tread carefully.

Blockchain in the Oil & Gas Supply Chain

Blockchain examples in oil and gas

This datafile tabulates ten examples of deploying Blockchain in the oil and gas industry from 2017 onwards; including the companies involved, the use cases, and our estimates of the cost savings.

Most prior examples have been in oil and gas trading, where cost savings tend to run at c35%. More niche applications are gaining traction in downstream, B2B applications.

For 2020, we are particularly excited by the broadening of Blockchain technologies into the procurement industry by a particular company, Data Gumbo.

c10% cost savings may be achieved for fragmented supply chains, such as US shale, by analogy to other digital procurement platforms we have evaluated in the past.

Ten Themes for Energy in 2020

Ten Themes for Energy in 2020

Energy transition is maturing as an investment theme. ‘Obvious’ portfolio tilts are beginning to look over-crowded. Non-obvious ones are looking over-looked. This note outlines the ‘top ten’ themes that excite us most in 2020, among commodities, drivers of the energy transition, market perceptions and corporate strategies.

Global gas: catch methane if you can?

companies developing more LNG.

Scaling up natural gas is the largest decarbonisation opportunity on the planet. But this requires minimising methane leaks. Exciting new technologies are emerging. This note ranks producers, positions for new policies and advocates developing more LNG. To seize the opportunity, we also identify early-stage companies in methane measurement and mature public companies in the oilfield supply chain. Global gas demand should treble by 2050 and will not be derailed by methane leaks.

Shale growth: what if the Permian went CO2-neutral?

making Permian production carbon neutral

Shale growth is slowing due to fears over the energy transition, as Permian upstream CO2 emissions reached a new high this year. We have disaggregated the CO2 across 14 causes. It could be eliminated by improved technologies and operations: making Permian production carbon neutral, uplifting NPVs by c$4-7/boe, re-attracting a vast wave of capital and growth.

Heliogen: concentrated solar breakthrough?

Heliogen concentrated solar patents

Heliogen has set a new record for concentrated solar power in November 2019, generating >1,000C temperatures from an array of c370 hexagonal mirrors, which are precisely controlled using computer vision. This is almost 2x traditional CSP plants which achieve c560C temperatures.

We have reviewed 21 patents from Heliogen’s predecessor company, eSolar, in order to understand its IP. Not only can it control heliostats more precisely than prior companies, but this allows the heliostats to be down-sized, conferring material cost-savings.

This data-file summarizes the technology, the patents, the costs (in c/kWh and $/mcfe) and the opportunity to decarbonise industrial heat and power generation.

Methane Leaks from Downstream Gas Distribution

Methane Leaks from US Dowsntream Gas Distribution

This data-file tabulates the methane emissions from downstream gas distribution across 160 US gas networks, which cover 1.1M miles of mains, 61M metered customers and >90% of the country’s retail gas demand.

Downstream US methane leakages average 0.2% by volume, explaining 5.7kg/boe of emissions. Two thirds of these leaks can be attributed to gas mains. Leakages are correlated with the share of sales to smaller customers. And state-owned utilities appear to have 2x higher leakage rates than public companies.

US gas utilities’ performance is screened to assess c80 distinct companies, including: Altagas, Atmos, Centerpoint, CMS, Dominion, DTE, Duke, Edison, National Grid, PG&E, Sempra, Southern Co, Spire, UGI, WEC & Xcel.

CO2 intensity of shale: breakdown by category?

CO2 emissions from Permian shale production

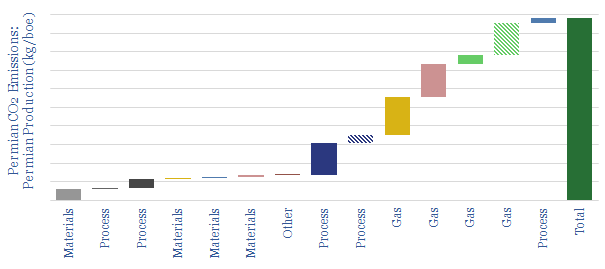
The CO2 intensity of shale oil averages 25kg/bbl, on a Scope 1&2 basis, of which 60% is from gas flaring and methane leaks. This model disaggregates CO2 emissions of shale oil, across 14 different contributors, aggregating across a dozen different models constructed by Thunder Said Energy.


This data-file models the CO2 intensity of a typical shale well, specifically a Permian shale oil well, looking line by line, across the CO2 intensity of concrete and steel, drilling, hydraulic fracturing, the supply chains bringing in sand, water and personnel, lifting, flaring, methane leaks, gas gathering and compression for gas transport.

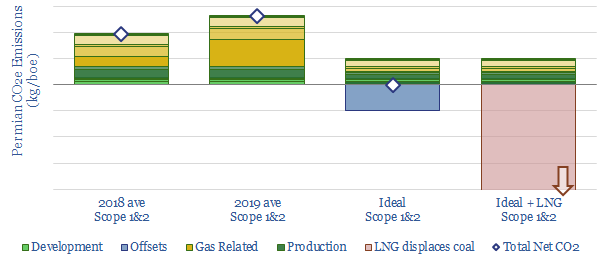
Our base case estimate is that the Scope 1&2 CO2 intensity of shale oil is around 25 kg/bbl. This tallies with real-world data reported by operator.

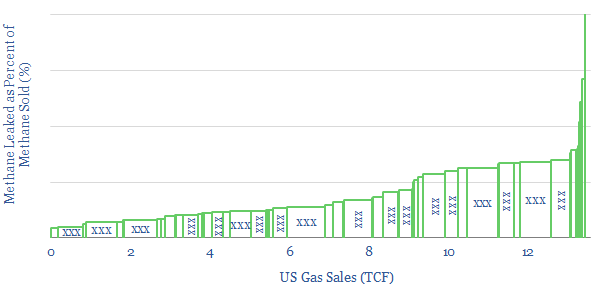
The largest contributors to the CO2 footprint of shale are flaring and methane leaks, which collectively account for 60% of the total Scope 1&2 emissions. This is why there is such importance on improving gas utilization (e.g., from booming blue hydrogen value chains) and preventing methane leaks.

For a comparison with the CO2 intensity of other oil and gas processes, please see our data-file here. US shale oil embeds modestly higher Scope 1&2 CO2 than large offshore resources, but materially less CO2 than heavy oils and geographies with heavy flaring.

Our ‘idealized shale’ scenario follows in a separate tab, showing how it could be achievable to make Permian shale production a ‘carbon neutral’ resource.

CO2 intensity can also be flexed by changing different input assumptions, such as methane leakage, flaring activity and well productivity; while we will be happy to share underlying models with you, for further sensitivity analysis.

Copyright: Thunder Said Energy, 2019-2024.