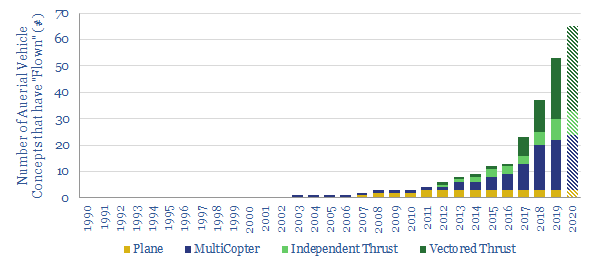
We have compiled a database of over 100 companies, which have already flown c40 aerial vehicles (aka “flying cars”) and the number should rise to c60 by 2021.
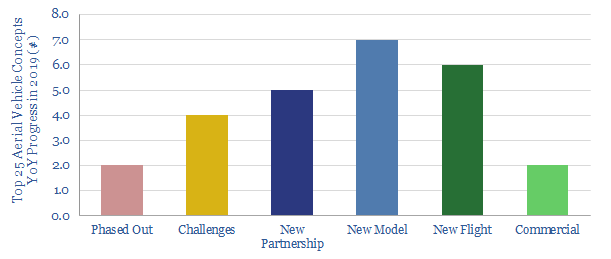
The datasubstantiates our conclusion that aerial vehicles will gain credibility in the 2020s, the way electric vehicles did in the 2010s. Our latest updated in early-2020 shows strong progress was made in 2019 (chart below).
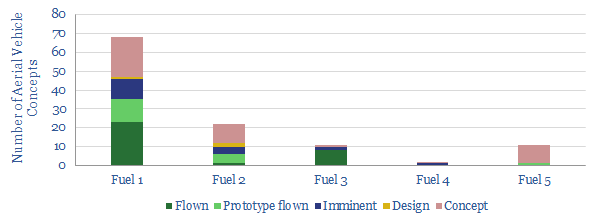
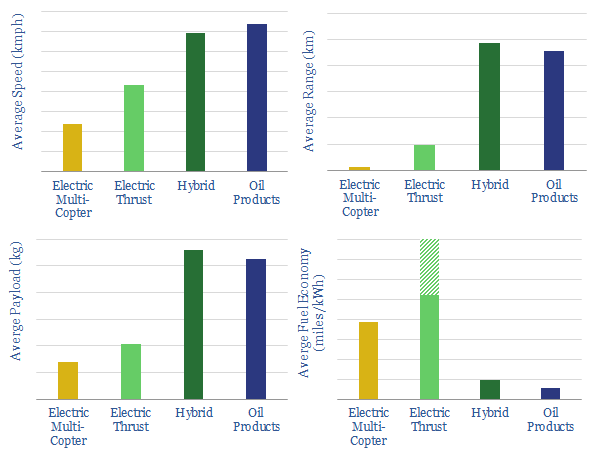
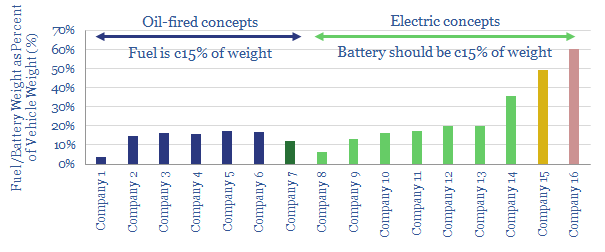
The database categorizes the top vehicle conceptsby type, company, year-founded, company-size, company-geography, backers, fuel-type, speed, range, take-off weight, payload, year of first prototype, target commercial delivery date, fuel economy and required battery weights.
Some vehicle concepts are extremely impressive and credible; but a few may find it more challenging to meet the ranges they have promised at current battery densities…
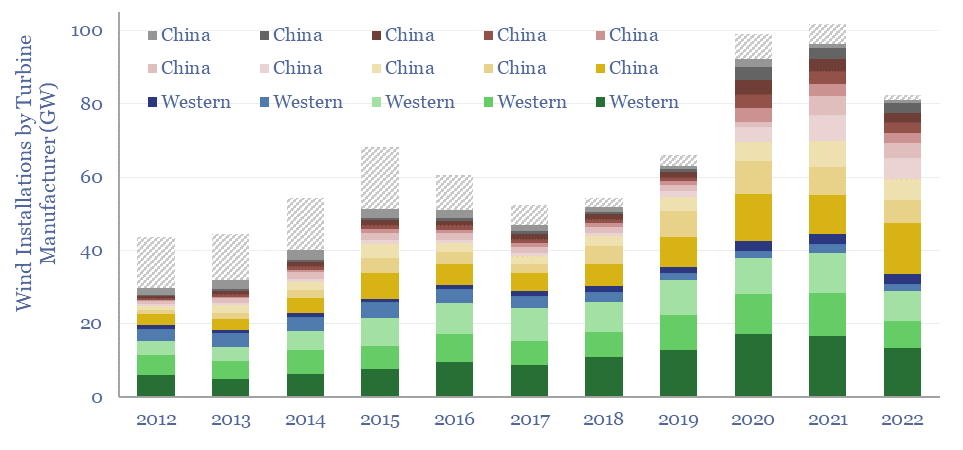
This data-file tracks wind turbine manufacturers, their market shares and their margins over time. By 2022, fifteen companies account for 98% of global wind turbine installations. This includes large Western incumbents, and a growing share for Chinese entrants, which now comprise over half of the total market, limiting sector-wide operating margins to c3%.
By 2022, fifteen companies account for 98% of global wind turbine installations. This includes large Western incumbents, and a growing share for Chinese entrants, which now comprise over half of the total market.
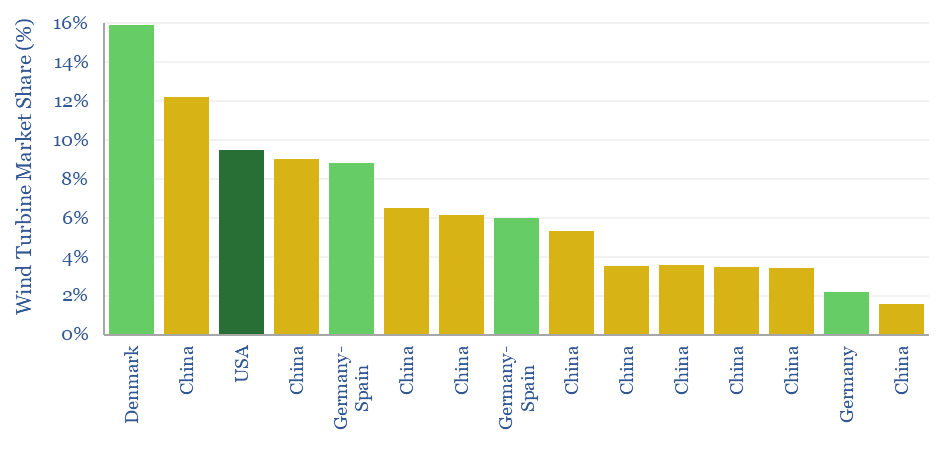
The wind turbine market is relatively concentrated, with a Herfindahl Hirschman Index of c1,000. The market share of the top five wind turbine manufacturers is 55%.
Screen of wind turbine manufacturers
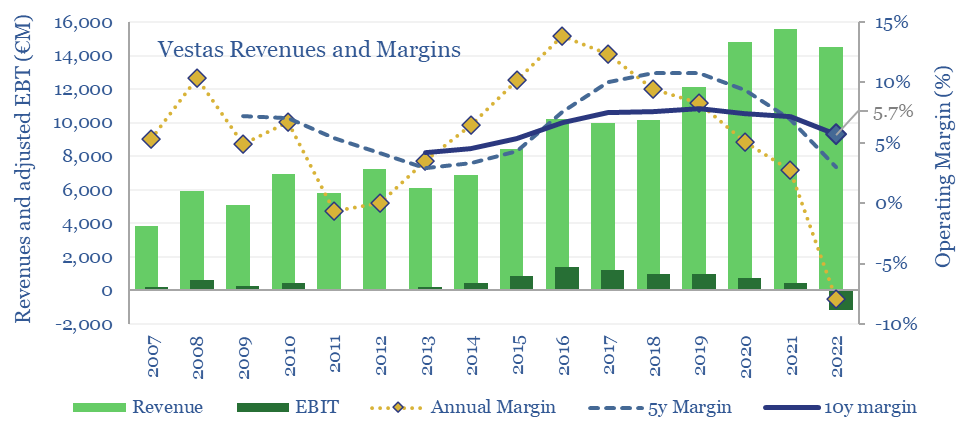
However competition, price pressure and cost pressure have kept margins low, averaging 5.7% over the past decade for Vestas, the largest turbine manufacturer in the world (chart below). We have produced similar charts for other turbine manufacturers as well.
Vestas Revenues and Margins
Other margin drivers? Wind is less economically competitive than solar and more prone to cost re-inflation (note here). The industry has also had to reinvent itself every 2-3 years with ever larger turbines, which creates ever greater engineering issues (note here).
Patent filings from traditional energy companies looking to break into the offshore wind sector are also tabulated in the final tab. This includes ABB, Aker, Alstom, Aramco, BP, Cameron, Chevron, Eni, Equinor, ExxonMobil, GE, OneSubsea, Saipem, Shell, Siemens, Subsea 7, Technip, TOTAL and Vestas.
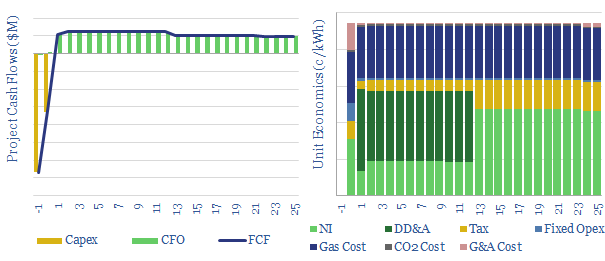
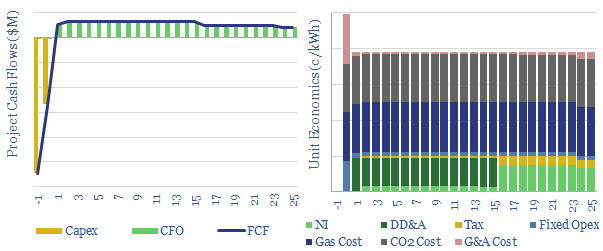
This data-file models the economics of constructing a new fuel-cell power plant; generating electricity from grey, blue or green hydrogen in a PEMFC, or from natural gas in an SOFC. The work is based on technical papers and past projects around the industry.
A dozen input variables can be flexed in the model, to stress test economic sensitivity to: hydrogen prices, power prices, carbon price, distribution costs, conversion efficiency, capex costs, opex costs, utilization and tax rates.
Indicative inputs, and sensible ranges, are suggested for each of these input variables in the data-file.
Economics continue to look more challenged for hydrogen power, compared with simply decarbonizing or carbon offsettingnatural gas power. Economics are closest to commercialist for gas-fired SOFCs, and could be interesting with c50% deflation and greater reliability, particularly as renewables get overbuild.
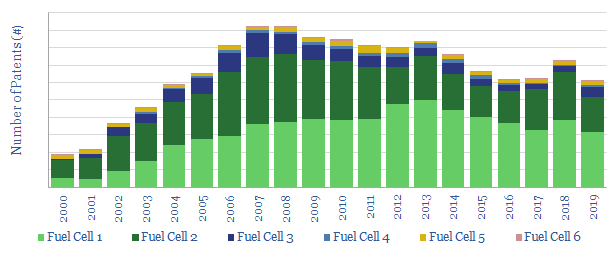
This data-file tabulates the numbers of patents filed into different types of fuel-cells, from 2000-2020, globally and in key geographies: China, Japan, Korea and the US.
Research activity peaked in 2008 and has since fallen by 30%, as Japanese research into Solid Oxide fuel cells and Proton Exchange Membranes both declined by 75%; however China’s research has ascended and comprises 65% of the patent filings from 2019.
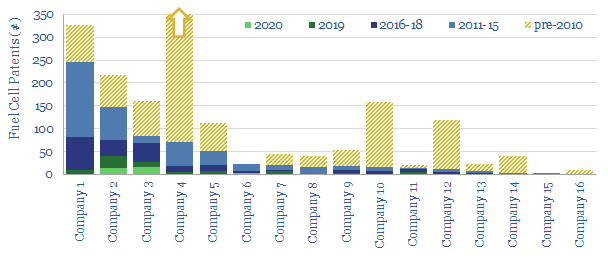
In particular, we focus in upon 2,350 patents filed by well-known companies in the fuel cell industry (e.g., Ballard, Bloom, Ceres, Giner, ITM, Plug Power), to evaluate which companies have the most IP in the industry, who has been accelerating and who is being overtaken (chart below).
We also focus in upon Molten Carbonate Fuel Cells, tabulating 120 patents into this reactor design, including descriptions of each patent and a categorization by company.
An overviewof different fuel cell types is provided as an introduction to the topic.
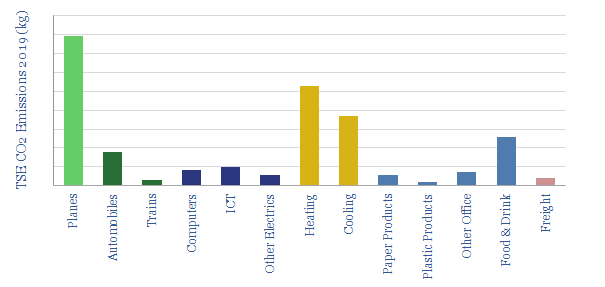
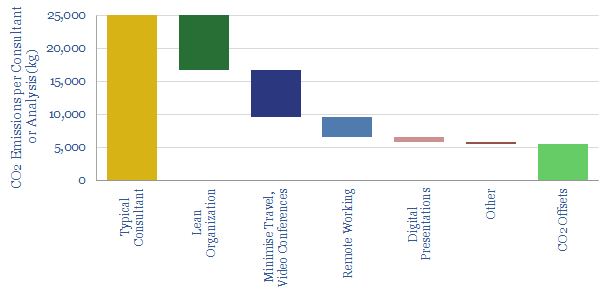
It is important for us to practice what we preach. Hence in 2019, we reduced our CO2 by 78% compared with a typical research/consulting firm, and purchased CO2-offsets for the remaining 5.6 tons. This note contains granular data on professional service firms’ emissions and opportunities to reduce them.
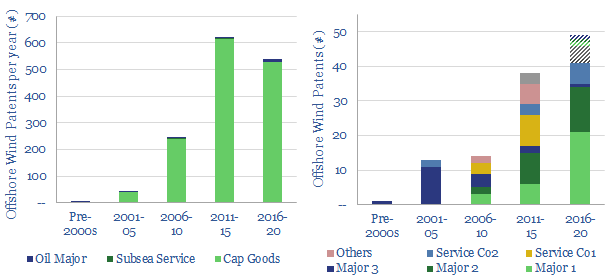
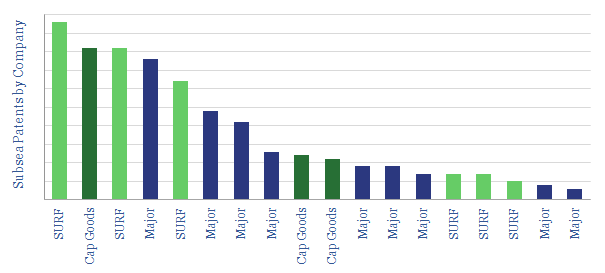
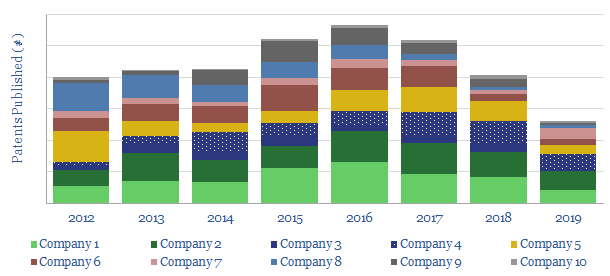
This data-file captures all the subsea-focused patents from ten of the largest subsea service providers around the industry, to quantify who has a technical edge (chart above).
The balance has been shifting. During the oil downturn, large, industrial conglomerates effectively halved their pace of technology development, while some subsea service companies accelerated (chart below).
The relative rankings are interesting. The data-file shows clear leaders in the categories such as subsea pumps, wellheads or umbilicals. Other areas are more competitive, with 2-3 companies vying for leadership in, flexible risers, subsea power or pipe-lay. One large subsea EPC screens as ‘Top 5’ on most categories, but is facing strong competion across the board.
Levelized costs of combined cycle gas turbines are built up in this data-file. Our base case costs of gas-fired power generation are 8c/kWh, at a combined cycle turbine converting 55% of the thermal energy of natural gas into electrical energy, for a total CO2 intensity of 0.35 kg/kWh.
A gas turbine operates via the Brayton Cycle, compressing inlet air, super-heating it to 1,200-1,600ºC by combusting a gaseous fuel, then expanding the super-heated gas mixture across a turbine. The turbine can be used to provide mechanical drive (including the inlet compressor) and generate electricity. There is c4% CO2 in the exhaust gas.
In a simple-cycle configuration, exhaust gases exit from the gas turbine at 400-600ºC, hence efficiency is limited to 35-45%, for example to maximize flexibility. However, in a combined-cycle gas turbine, the hot exhaust gases are used to generate high-pressure steam and run a separate steam-cycle, reaching 55-65% efficiency.
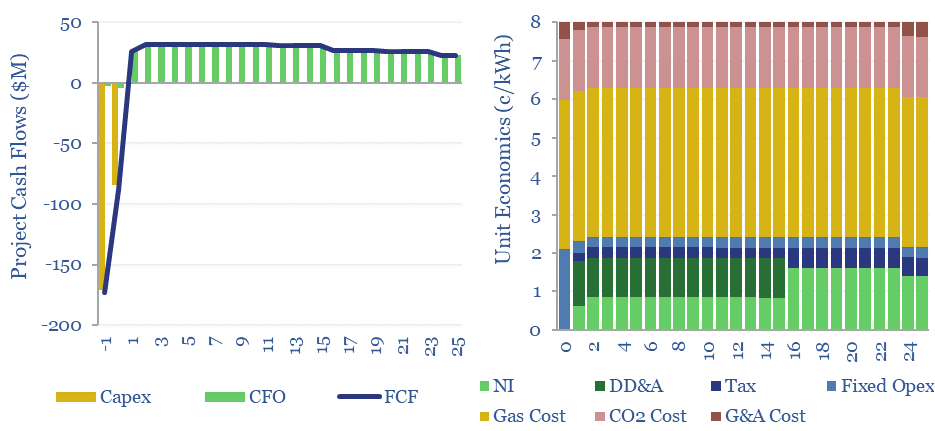
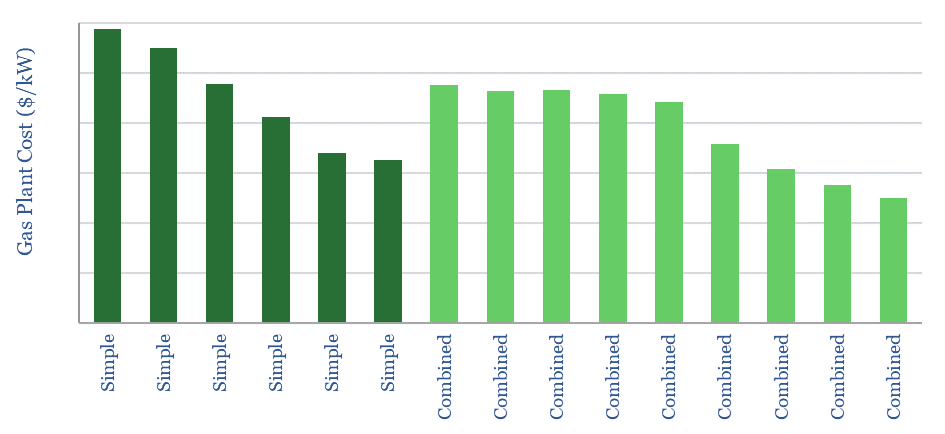
This data-file models the economics of constructing a new gas-to-power project, using simple or combined cycle gas turbines, based on technical papers and past projects around the industry. The capex cost of a large new gas turbine can be approximated around $1,000/kW (chart below). Other operating parameters are tabulated here.
Our base case cost is that a large new combined cycle gas turbine can achieve a levelized cost of electricity of 8c/kWh with a CO2 intensity factor of 0.35 kg/kWh (title chart). Although this does include a CO2 price, which is not always present in all geographies.
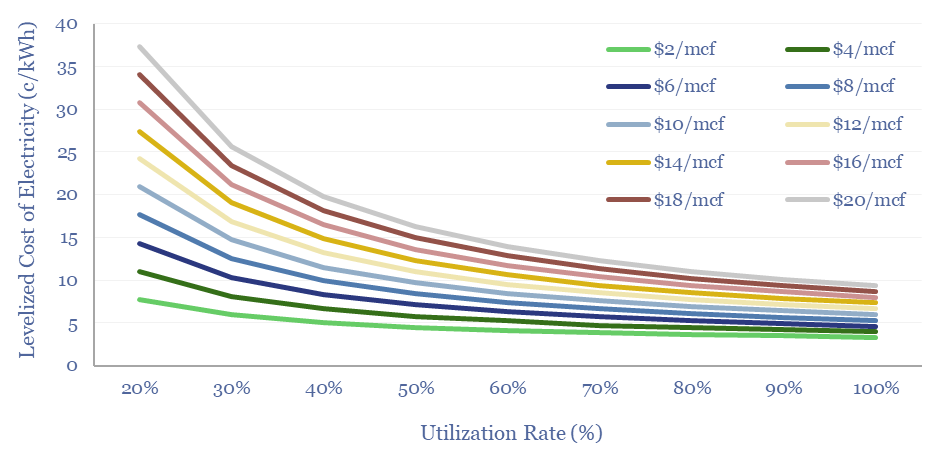
A dozen input variables can be flexed in the model, to stress test economic sensitivity to: gas prices, power prices, carbon price, gas distribution costs, conversion efficiency, capex costs, opex costs, utilization rates and tax rates (chart below).
Gas-fired power generation explained 23% of global electricity generation in 2022, second only to coal at 35% of global electricity generation. Simply switching coal-fired power to gas-fired power avoids c60% of the CO2. CO2 abatement costs are generally low. While a surprising finding in our recent research is that natural gas can economically backstop renewables such as wind and solar, due to high operating flexibility.
This data-file models the economics of constructing a new coal-to-power projects, based on past projects around the industry.
A dozen input variables can be flexed in the model, to stress test economic sensitivity to: coal prices, power prices, carbon price, gas distribution costs, conversion efficiency, capex costs, opex costs, utilization and tax rates.
Indicative inputs, and sensible ranges, are suggested for each of these input variables in the data-file.
Greenfield coal projects in the developed world are no longer economic, as meeting stringent air standards inflates capex costs around 3x, while juxtaposition with renewables dents utilization.
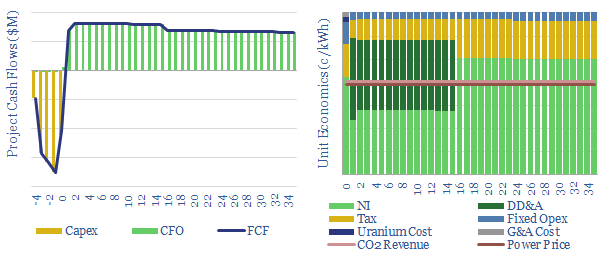
This data-file models the costsof nuclear power project, based on technical papers and past projects around the industry. An up-front capex cost of $6,000/kW might yield a levelized cost of 15c/kWh. But 6-10c/kWh is achievable via a renaissnace in next-generation nuclear.
Nuclear power plants generate 2,800 TWH per year, which is 10% of the world’s electricity and around c4% of the world’s total energy supply. Nuclear’s shareof global electricity demand peaked at 17.5% in 1996 and has since lost share.
The historical challenges have included high capex costs and long construction cycles. This means that a CO2 price of $270/ton is required before new nuclear projects would outcompete new gas projects, on an apples-to-apples basis.
Again, this is why capex deflation matters, and can under-pin a renaissance in the nuclear industry, especially amidst persistent energy shortages, and growing demands for low-carbon, baseload power.
Uranium only comprises 3% of total levelized costs (at $50/lb U3O8 prices), which makes nuclear power economics less sensitive to fuel costs than combustion-based power technologies.
Energy efficiency of nuclear power projects can be quantified and stress-tested in the data-file in GWH/ton and percentage terms.
This website uses necessary cookies. Our cookies are simply to improve your experience. We do not undertake any advertising or targeting via our cookies. By clicking 'accept' or continuing to use the website, you consent to our use of cookies.AcceptRead More
Privacy & Cookies Policy
Privacy Overview
This website uses cookies to improve your experience while you navigate through the website. Out of these, the cookies that are categorized as necessary are stored on your browser as they are essential for the working of basic functionalities of the website. We also use third-party cookies that help us analyze and understand how you use this website. These cookies will be stored in your browser only with your consent. You also have the option to opt-out of these cookies. But opting out of some of these cookies may affect your browsing experience.
Necessary cookies are absolutely essential for the website to function properly. This category only includes cookies that ensures basic functionalities and security features of the website. These cookies do not store any personal information.
Any cookies that may not be particularly necessary for the website to function and is used specifically to collect user personal data via analytics, ads, other embedded contents are termed as non-necessary cookies. It is mandatory to procure user consent prior to running these cookies on your website.