Fully subsea offshore projects: the economics?

Fully subsea project economics

This model presents the economic impacts of developing a typical, 625Mboe offshore  gas condensate field using a fully subsea solution, compared against installing a new production facility.


Both projects are modelled out fully, to illstrate production profiles, per-barrel economics, capex metrics, NPVs, IRRs and sensitivity to oil and gas prices (e.g. breakevens).

The result of a fully offshore project is lower capex, lower opex, faster development and higher uptime, generating a c4% uplift in IRRs, a 50% uplift in NPV6 (below) and a 33% reduction in the project’s gas-breakeven price.

Please download the model to interrogate the numbers and input assumptions.

Oxycombustion: economics of zero-carbon gas?

CO2-EOR in shale

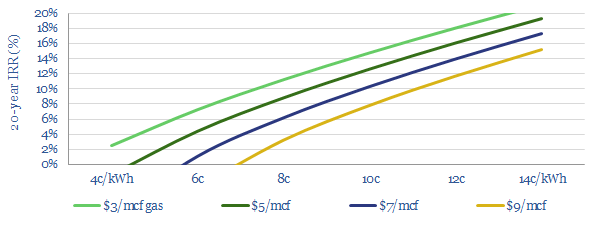
Oxycombustion is a next-generation power technology, burning fossil fuels in an inert atmosphere of CO2 and oxygen. It is easy to sequester CO2 from its exhaust gases, helping heat and power to decarbonise. We model that IRRs can compete with conventional gas-fired power plants and base case oxycombustion costs are 6-8c/kWh.


This data-file models oxycombustion costs, which is a next-generation power generation technology, burning natural gas (CH4) in a pure atmosphere of oxygen, so that the power generation cycle yields an output of pure CO2 and H2O.

We have built up our economic assumptions by reviewing technical papers, public information from leader NET Power, and based on thermodynamic modelling, from the power cycle through to super-critical CO2 compression.

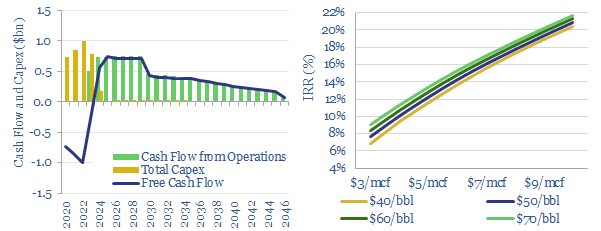
Our model of oxycombustion costs, averaging 6-8c/kWh in our base case, is based on assumptions for capex, opex, utilization, efficiency, gas prices, oxygen costs and CO2 disposal.

Project cash flows and unit economics for oxycombustion power technologies.

We first looked at NET Power in a research note in 2019, exploring how next-generation combustion technologies could facilitate easier capture of CO2 (note here). However, we updated the model in 2022-23, with further disclosures, released as the technology has progressed, and as Rice Acquisition Corp acquired NET Power.

Reliable and low-carbon baseload power are increasingly important in our power grid research. We estimate CO2 intensities of 0.04-0.08 kg/kWh for oxycombustion, including the embedded CO2 of cryogenic oxygen production.

Competition? It is also under-appreciated that the utilization rates of developed world power grids have progressively been falling, inflating unit costs, which generates a growing incentive to self-generate clean and reliable power (note here).

Another key debate is how the reliability of oxycombustion power cycles will compete with smaller-scale CHPs and fuel cells. Fuel cells have historically had high decline rates, averaging 5% per year, but recent fuel cells are slowly improving.

Input assumptions that impact oxycombustion costs can be stress-tested by downloading the model. Further discussion here.

Ten Themes for Energy in the 2020s

This short presentation describes our ‘Top Ten Themes for Energy in the 2020s’. Each theme is covered in a single slide. For an overview of the ideas in the presentation, please see our recent presentation, linked here.

Decarbonized power: how much wind and solar fit into the optimal grid?

when will wind and solar peak?

What should future power grids look like? Our answer optimizes costs, stability and CO2. Renewables do not surpass 45-50%. By this point, over 70% of new wind and solar will fail to dispatch, while incentive prices will have trebled. Batteries help little. They raise power prices by a further 2-5x to accommodate just 3-15% more renewables. The lowest-cost, zero-carbon power grid, we find, comprises c25% renewables, c25% nuclear and c50% decarbonized gas, with an incentive price of 9c/kWh.

Fugitive methane: what components are leaking?

Components leaking methane in oil and gas

This data-file looks through 35 different technical papers and data-sources to tabulate the methane leaks from different components around the oil and gas industry.


The largest leaks per event are from losses of well control, which can emit 10-1M tons per annum. Next are mid- and downstrseam facilities at 1-10kTpa.

The largest leaks by upstream component are compressor seals (1-100Tpa) and millons of pneumatic devices (0.01-10Tpa), which each comprise c20-30% of total upstream leaks.

Potentially overlooked categories include wellheads, storage tanks and workover practices. All are quantified in the data-file. The theme is addressed in detail in our note, mitigating methane.

Scaling Up Renewables and Batteries

costs required to scale up renewables

This model aims to calculate the average costs and the incentive prices required to scale up renewables in a typical developed world grid, from 25% to 40%, then to 50%, then to 60%.


The economics are modelled as a function of renewable costs, battery costs, curtailment rates, gas prices and carbon prices, which you can flex.

The calculations are based on Monte Carlo simulations using real-world data on wind and solar volatility, which dictates the curtailment rate of renewables and the utilziation rates of batteries that are built as a backstop.

We conclude that renewables will cap out at 45-50% of fixed-demand grids, even with the benefit of batteries. Beyond 50%, curtailment surpass 70%, trebling incentive pricing.  Large-scale batteries also increase incentive prices 5-25x. Natural gas is the best complement for renewables, with both between 25-50% of grid demand.

What can help integrate more renewables into grids is demand-shifting, per our recent note, which effectively accommodates another 10pp share of renewables at no incremental cost.

Electric Vehicles Increase Fossil Fuel Demand?

EVs increase fossil fuel demand

It is widely believed that electric vehicles will destroy fossil fuel demand. We find they will increase it by 0.7Mboed from 2020-35. EVs only start lowering net fossil fuel demand from 2037 onwards. The reason is that 3.7x more energy is consumed to manufacture each EV than the net road fuel it displaces each year; while the manufacturing of EVs is seen growing exponentially. The finding is a strong positive for natural gas.

Offshore wind costs are inflating?

Offshore wind costs not deflating

This data-file tabulates the capex costs of 35 offshore wind projects in the UK, with 8.5GW of capacity, which have been installed since the year 2000.


We model the incentive price for each project, i.e., the power price that is needed to earn a 10% levered but unsubsizided return. There is little evidence for deflation. Rather, breakevens appear to have risen at a 2.5% CAGR over the past decade.

Please download the data-file to interrogate the findings, or view the individual project parameters. Continued technical innovation is needed in the wind industry. We find new airship concepts could help deflate logistic costs.

Should fuel retail stations sell carbon credits: the economics?

Should fuel retail stations sell carbon credits

This model calculates the uplift in FCF and NPV for a fuel-retail station that offers CO2-offsets at the point of sale, alongside selling fuel. The rationale, and the different models that could be employed are outlined in our recent deep-dive research note.

In both models shown above, annual FCF can be uplifted by 15-30%, while fuel retail stations’ NPV can be uplifted by 15-25%, depending on the portion of consumer that purchase the carbon credits.

Gross profits from selling $50/ton carbon credits may be around 3x the typical EBIT margins of retail stations, hence we explore a particular sales model that can at least double fuel retail NPVs.

Hydraulic Fracturing: where’s the IP?

Hydraulic Fracturing IP

This data-file tracks 17,000 hydraulic fracturing patents filed by geography, by company, by year, since 2010; but particularly in 2019.


Frac patents peaked in 2017-18 at c3,900 per year. 2020 has slowed by 6%. But the headline figures mask a c36% correction in the US, masked by 33% expansion of Chinese shale ambitions. Remarkably, in 2019, the leading Chinese Major filed more hydraulic fracturing patents than the leading US Service provider.

Company trends. Over the past three years, among larger companies, the top US Services filed c45% of the patents, Chinese Majors filed c40%, DM producers filed c5% and niche service copanies files c10%.

A granular breakdown for 2019 tabulates 1,900 patents, including their descriptions, which you can interrogate fully.

Copyright: Thunder Said Energy, 2019-2024.