
This data-file tabulates power purchase agreements (PPAs), strike prices and contract-for-difference (CfD) details, across 100 renewables projects (wind and solar) over the past decade. From this, we can also back-calculate project IRRs, using our broader economic models.
Solar projects in our sample appear to have generated 5% unlevered IRRs, on average, off of 5.1c/kWh average PPA prices, although interestingly, returns have been rising at recent projects, due to continued solar cost deflation.
Onshore wind projects in our sample appear to have generated 6% unlevered IRRs, on average, off of 4.6 c/kWh average PPA prices. Many of these projects were in the 2010-17 timeframe, while more recent project costs have re-inflated.
Offshore wind projects in our sample appear to have generated 6% unlevered IRRs, on average, off of 12.4 c/kWh average strike prices and CfD prices. Without these high realizations, it is more challenging to generate returns at offshore wind projects.
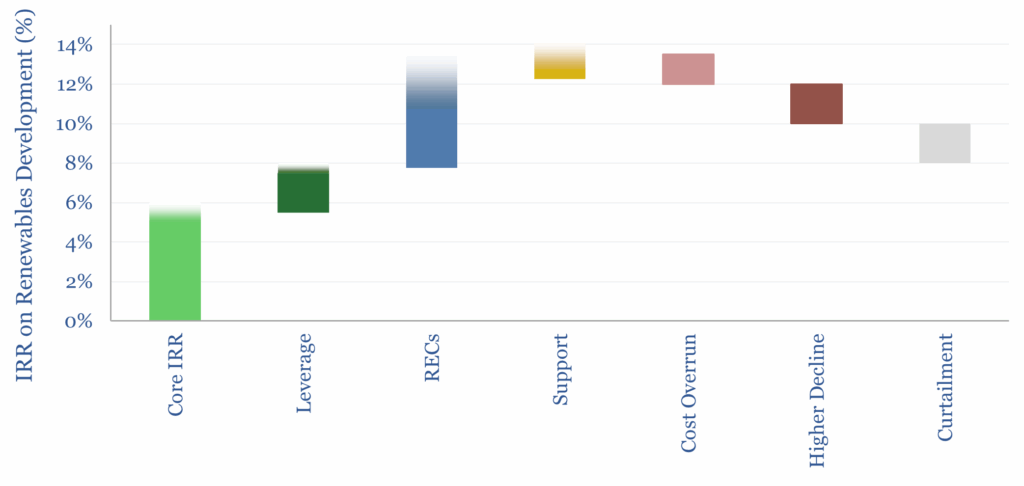
Core IRRs, as an explanatory note, are calculated on a simple, unlevered basis. Some project developers insist they can generate double-digit IRRs from renewables development, which is possible, on an equity IRR basis, after adding leverage, RECs and securing policy support, although it also requires on-time project delivery, and solid operational performance (chart below).
In addition to specific projects, across the industry, our analysis also lent upon useful overviews published by Lawrence Berkeley National Laboratory, and other industry sources.
Please download the data-file for the underlying data into renewables PPA prices, strike prices and CfD prices across our sample of projects; and the implied IRRs that we have backed out of these projects, from our solar, onshore wind, and offshore wind models.