-
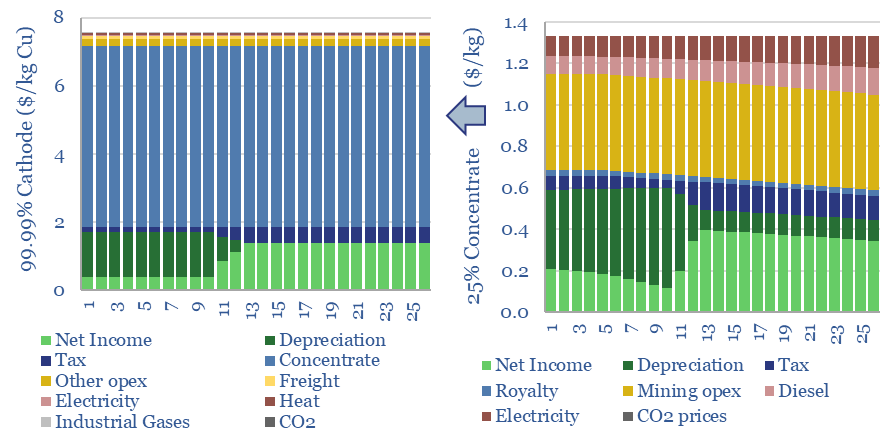
Copper: the economics?

The economic cost of copper production is build up from first princples in this model, from mine, to concentrator, to smelter to 99.99% pure copper cathodes. Our base case is $7.5/kg copper cathode, with 4 tons/ton CO2 intensity, after starting from an 0.57% ore grade. Numbers vary sharply and can be stress-tested in the data-file.
-
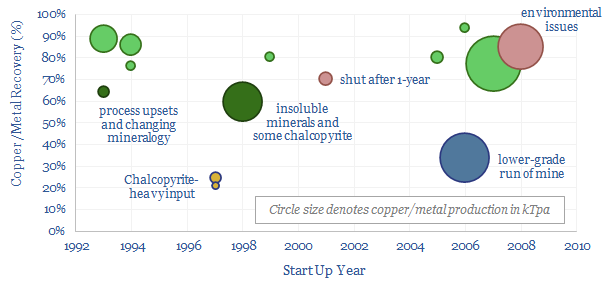
Bioleaching: case studies and examples?

Bioleaching uses bacteria to metabolize insoluble sulfides and iron complexes. It produces 20% of the world’s copper; with 50% lower capex, at least 50% less CO2 and up to 80-90% recoveries; but it is currently limited to specific mineralogies. A prospect for the 2020s is that new technologies may unlock more minerals.
-
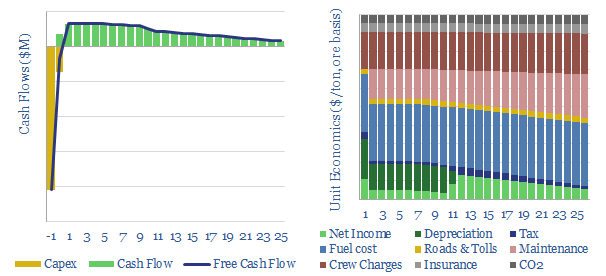
Mine trucks: transport economics?

There are around 50,000 giant mining trucks in operation globally. The largest examples are 15m long, 10m wide, 8m high, can carry around 350-450 tons and reach top speeds of 40mph. This data-file captures the economics, costs and inflationary impacts of decarbonization.
-
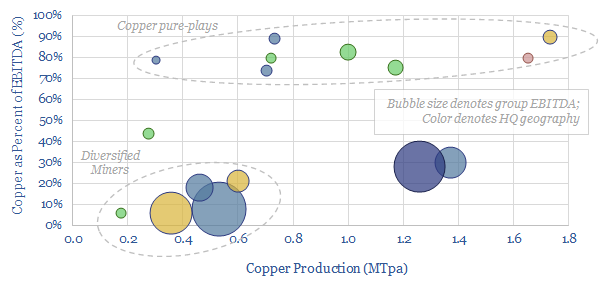
Copper companies: a screen of leading producers?
This data-file is a screen of the world’s largest copper miners and producers, covering 16 companies that produce half of all global output. The average company produces around 0.8MTpa, has a 30-year reserve life, and derives 30% of its EBITDA from copper.
-
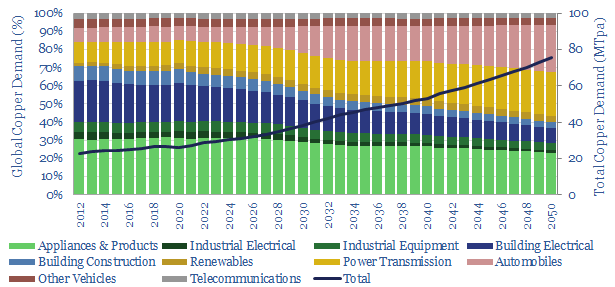
Copper: global demand forecasts?

This data-file estimates global copper demand as part of the energy transition, rising from 28MTpa in 2022 to 70MTpa in our base case scenario. The largest contributor is the electrification of transport. You can stress test half-a-dozen key input variables in the model.
Content by Category
- Batteries (87)
- Biofuels (42)
- Carbon Intensity (49)
- CCS (63)
- CO2 Removals (9)
- Coal (38)
- Company Diligence (90)
- Data Models (816)
- Decarbonization (159)
- Demand (108)
- Digital (56)
- Downstream (44)
- Economic Model (197)
- Energy Efficiency (75)
- Hydrogen (63)
- Industry Data (273)
- LNG (48)
- Materials (79)
- Metals (71)
- Midstream (43)
- Natural Gas (146)
- Nature (76)
- Nuclear (22)
- Oil (162)
- Patents (38)
- Plastics (44)
- Power Grids (123)
- Renewables (149)
- Screen (112)
- Semiconductors (30)
- Shale (51)
- Solar (67)
- Supply-Demand (45)
- Vehicles (90)
- Wind (43)
- Written Research (345)