-
Global oil production by country?
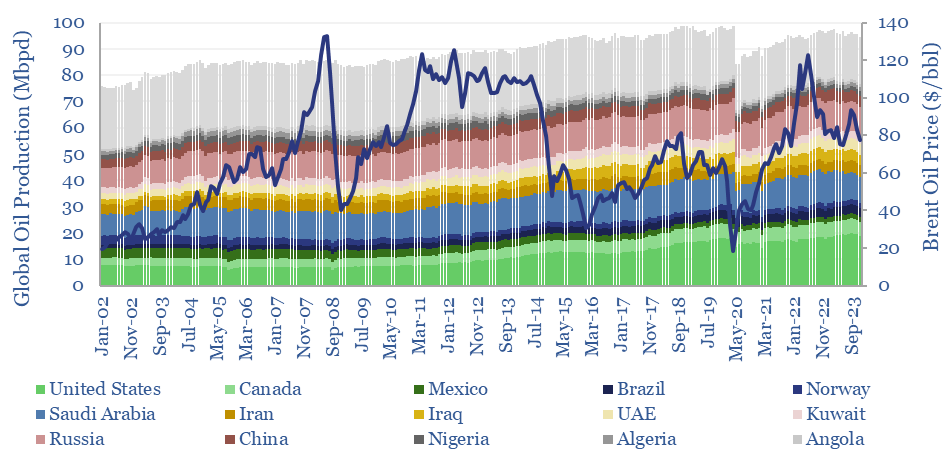
Global oil production by country by month is aggregated across 35 countries that produce 80kbpd of crude, NGLs and condensate, explaining >96% of the global oil market. Production has grown by +1Mbpd/year in the past two-decades, led by the US, Iraq, Russia, Canada. Oil market volatility is usually low, at +/- 1.5% per year, of…
-
Fiber Optic Cables: Patents and Leading Companies?
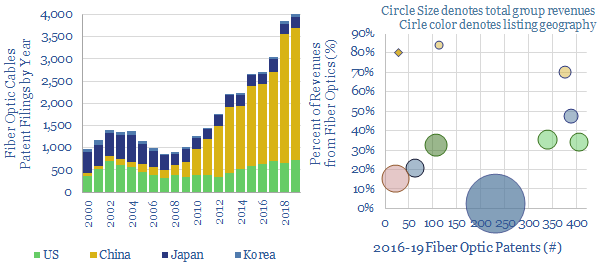
This data-file screens for the technology leaders in fiber-optic cables, which are crucial for the digitization of industries and the world’s structural shift towards remote-working, based on screening 37,000 patents. Revenues and market shares are summarized for the leaders.
-
COVID-19 Impacts on Global Oil Demand?
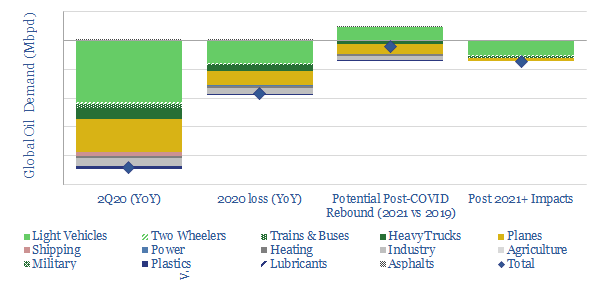
Global oil demand could decline -22Mbpd YoY in 2Q20, due to COVID-19, with losses averaging 9-12 Mbpd across 2020. Our model looks line-by-line around the global oil market, to help you stress-test your own scenarios under different input assumptions.
-
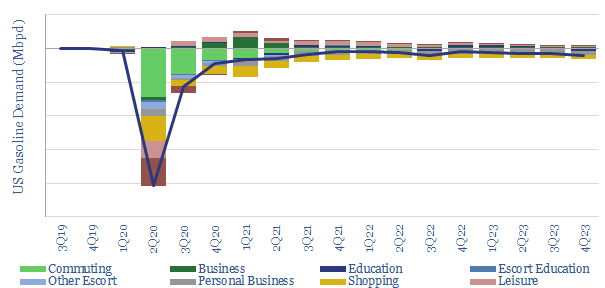
COVID-19 Impacts on US Gasoline Demand?

US gasoline is the largest component of global oil demand, at c9% of the market. Hence we have modelled the disruption from COVID-19. -2Mbpd of YoY demand destruction is not inconceivable. But when the market turns, it may also recover very quickly.
-
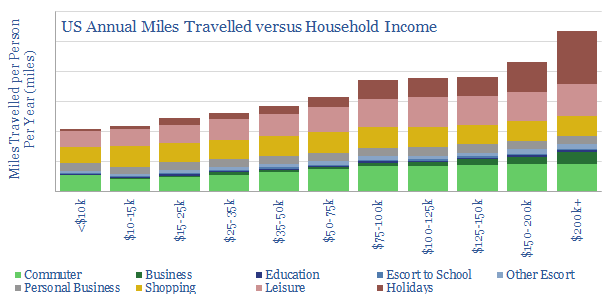
Domestic travel miles: by purpose, vehicles and demographics

Global oil demand is going through an unprecedented disruption. In the short-term, this is due to COVID-19. In the long-term, it is due to the rise of the internet and the energy transition. To contextualise how demand will change, we have aggregated granular data on travel-miles in the US and the UK.
-
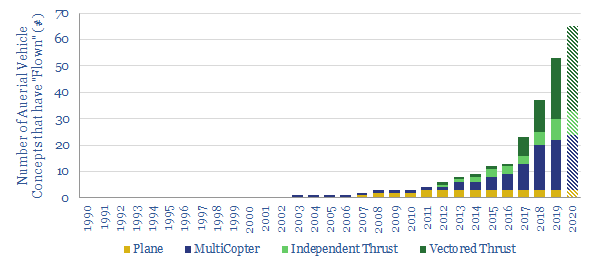
Aerial Vehicles: Which Ones Fly?

We have updated our database of over 100 companies, which have already flown c50 aerial vehicles (aka “flying cars”), to identify the leading contenders. We categorize each vehicle by fuel type, speed, range, fuel economy and credibility. The data strongly imply aerial vehicles taking off in the 2020s.
-
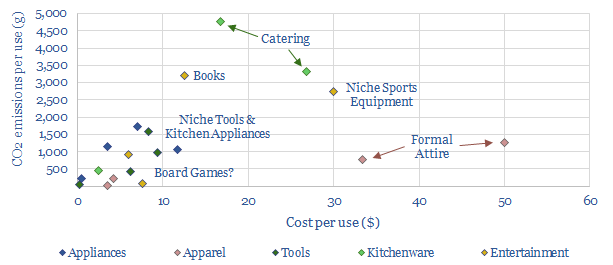
Value in Use: CO2 intensities of household items?

More extensive “sharing” will be enabled by drone delivery technologies and could save $1trn of costs and 100MTpa of CO2 emissions across the entire US. These numbers are illustrated by tabulating the data for 20 common household items, which we estimate are currently used just 20 times in their entire useful lives, thus costing $13…
-
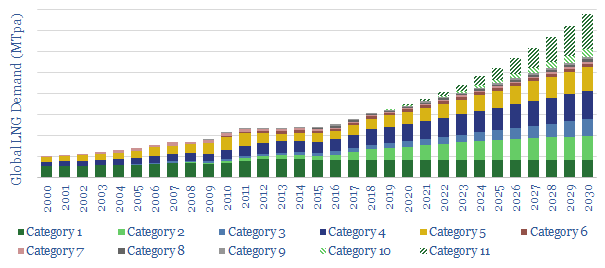
Long-Term LNG Demand: technology-led?

This is a simple model of long-term LNG demand, extrapolating out sensible estimates for the world’s leading LNG-consumers. On top of this, we overlay the upside from two nascent technology areas, which could add 200MTpa of potential upside to the market. Backup workings are included.
-
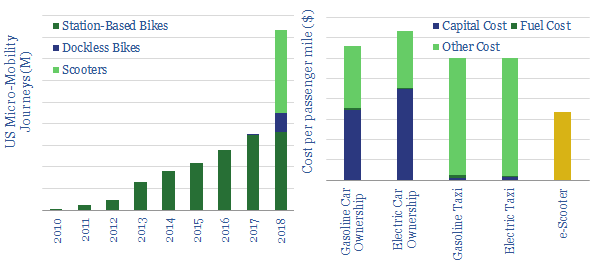
Energy Economics of e-Scooters

This workbook contains all our modelling on the energy economics of e-scooters; a transformational technology for urban mobility. Included are our projections of per-mile costs, energy-economics, battery charging times, new electricity demand and displacement of oil demand.
-
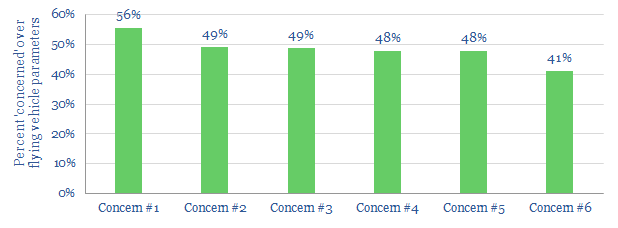
Who’s Afraid of Aerial Vehicles?

This data-file tabulates consumer attitudes towards aerial vehicles, based on the best perception study we have seen in the technical literature. It shows the influence of geography, income, age, gender, education levels and length of commute; along with top concerns.
Content by Category
- Batteries (89)
- Biofuels (44)
- Carbon Intensity (49)
- CCS (63)
- CO2 Removals (9)
- Coal (38)
- Company Diligence (95)
- Data Models (840)
- Decarbonization (160)
- Demand (110)
- Digital (60)
- Downstream (44)
- Economic Model (205)
- Energy Efficiency (75)
- Hydrogen (63)
- Industry Data (279)
- LNG (48)
- Materials (82)
- Metals (80)
- Midstream (43)
- Natural Gas (149)
- Nature (76)
- Nuclear (23)
- Oil (164)
- Patents (38)
- Plastics (44)
- Power Grids (130)
- Renewables (149)
- Screen (117)
- Semiconductors (32)
- Shale (51)
- Solar (68)
- Supply-Demand (45)
- Vehicles (90)
- Wind (44)
- Written Research (355)