Biofuel technologies: an overview?

Biofuel technologies overview

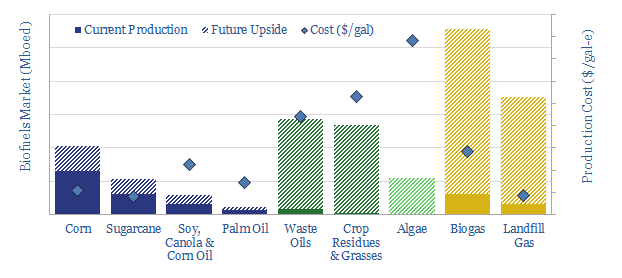
This data-file provides an overview of the 3.5Mbpd global biofuels industry, across its main components: corn ethanol, sugarcane ethanol, vegetable oils, palm oil, waste oils (renewable diesel), cellulosic biomass, algal biofuels, biogas and landfill gas.


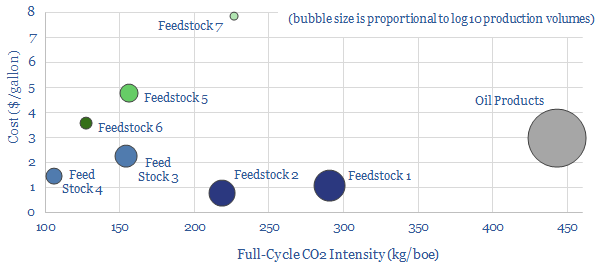
For each biofuel technology, we describe the production process, advantages and drawbacks; plus we quantify  the market size, typical costs, CO2 intensities and yields per acre.

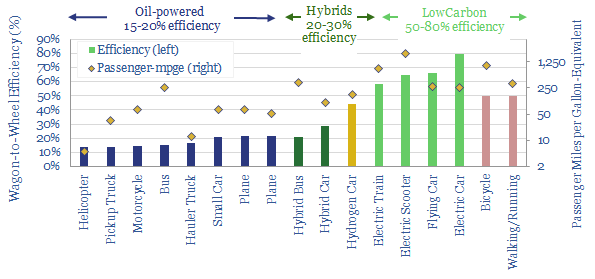
While biofuels can be lower carbon than fossil fuels, they are not zero-carbon, hence continued progress is needed to improve both their economics and their process-efficiencies.

Our long-term estimate is that the total biofuels market could reach 20Mboed (chart below),  however this would require another 100M of land and oil prices would need to rise to $125/bbl to justify this switch.

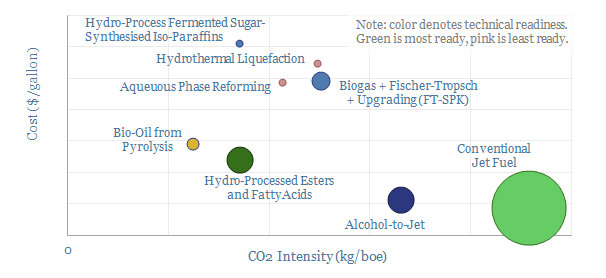
The data-file also contains an overview of sustainable aviation fuels, summarizing the opportunity set, then estimating the costs and CO2 intensities of different options.

Alternative truck fuels: how economic?

economics of trucking fuels

This data-file compares different trucking fuels — diesel, CNG, LNG, LPG and Hydrogen — across 35 variables. Most important are the economics, which are fully modelled, in the 2020s in the US, in the 2020s in Europe and incorporating deflation in the 2040s.

Hydrogen still screens as an expensive alternative. We estimate full cycle freight costs will be c30% higher for hydrogen vehicles than diesels in Europe, and as much as 2x higher in the US. The data-file contains a breakdown of hydrogen truck concepts and their operating parameters.

Natural Gas can be close to competitive. On an energy-equivalent basis, $3/mcf gas is 4x more economical than $3/gal diesel. However, the advantages are offset by higher vehicle costs, operational costs and logistical costs. Mild environmental positives of gas are also offset by mild operational challenges.

Biofuel, green diesel, renewable diesel: where’s the IP?

patents filed into biofuels

This data-file tracks 5,000 patents filed into biofuels: by geography, by company and particularly in 2017-20. The pace of research activity into “biofuels” and “biodiesel” seems to have halved since 2014, suggesting industry interest is waning.

As usual, China has come to dominate the recent patent literature, accounting for 60% of recent filings. Out of the ‘Top 25’ patents filed into biofuels from 2017-20, 15 are Chinese companies.

Ranked by recent patent filings, technology leaders include Sinopec, BASF, Arkema, Neste, TOTAL, ExxonMobil and DuPont. It is interesting that some well known companies (e.g., Ryze) did not appear to have filed many patents recently. Full details on the patent trends and filings are in the data-file.

Our 3 key conclusions are spelled out in the green diesel article sent out to our distribution list.

Aerial Vehicles: Which Ones Fly?

top aerial vehicle concepts

We have compiled a database of over 100 companies, which have already flown c40 aerial vehicles (aka “flying cars”) and the number should rise to c60 by 2021.


The data substantiates our conclusion that aerial vehicles will gain credibility in the 2020s, the way electric vehicles did in the 2010s. Our latest updated in early-2020 shows strong progress was made in 2019 (chart below).

The database categorizes the top vehicle concepts by type, company, year-founded, company-size, company-geography, backers, fuel-type, speed, range, take-off weight, payload, year of first prototype, target commercial delivery date, fuel economy and required battery weights.

Some vehicle concepts are extremely impressive and credible; but a few may find it more challenging to meet the ranges they have promised at current battery densities…

Carbon Costs of IMO 2020?

Carbon Costs of IMO 2020

CO2 intensity of oil refineries could rise by 20% due to IMO 2020 regulations, according to the estimates in this data-file, if a refinery chooses to convert all its high-sulphur fuel oil into low-sulphur diesel.

The drivers are an extra stage of cracking, plus higher-temperature hydrocracking and hydrotreating, which will also have the knock-on consequence of increasing hydrogen demands.

Higher CO2 intensity conflicts with the industry’s aim of lowering its net emissions, and a 20% increase would effectively undo 30-years of prior efficiency gains in the refining industry.

Distribution Costs: Ships, Trucks, Trains and Delivery Vans?

Distribution Costs and CO2 for Consumers

This data-file breaks down the financial and carbon costs associated with a typical US consumer’s purchasing habits. It covers container-ships, trucks, rail freight, cars and last-mile delivery vans; based on the ton-miles associated with each vehicle and its fuel economy.

We estimate the distribution chain for the typical US consumer costs 1.5bbls of fuel, 600kg of CO2 and $1,000 per annum.

The costs will increase 20-40% in the next decade, as the share of online retail doubles to c20%. New technologies are needed in last-mile delivery, such as drones.

Please download the model to for a full breakdown of the data, and its sensitivity to oil prices, consumption patterns, international trade and exciting new delivery technologies.

Power Trains? Electric, diesel or hydrogen

Powering Trains Electric Diesel or Hydrogen

This data-file compares diesel trains, electric trains and hydrogen trains, according to their energy consumption, carbon emissions and fuel costs. The data are presented apples-to-apples, per passenger mile, based on worked examples. Seven train routes are compared on 20 metrics overall.


Travelling by train should be 2-15x more fuel-efficient, and 3-20x less carbon intensive than travelling by car.

Electric trains are most efficient and cost-effective. The drawback is that electrifying tracks can cost c$1.4M/km. Nevertheless, we are most positive on the electrification opportunity around railways, particularly using next-generation combustion technologies.

The world’s first hydrogen trains launched in Germany in September-2018. To be cost-competitive with entry-level diesel trains requires c$12/kg hydrogen, $6/gallon diesel and a $50/ton carbon price.

Relative costs and economics can be compared by varying inputs in the file.

Aerial Vehicles Re-Shape Transportation Costs?

costs per passenger-kilometer for transportation

This model calculates the costs per passenger-kilometer for transportation, based on mileage, load factors, fuel prices (oil and electricity), fuel-economy, vehicle costs and maintenance costs.

Ground level vehicles are assessed using data from around the industry, on gasoline, electric, owned and taxi vehicles.

Aerial vehicles could compete with taxis as early as 2025. By the 2030s, their costs can be 60% below the level of car ownership.

This model shows all of our input assumptions and calculations.

Vehicles: fuel economy and energy efficiency?

Vehicle fuel economy and energy efficiency

Vehicle fuel economy and energy efficiency are quantified in this data-file, looking across different transportation types: cars, trucks, buses, hybrids, electric vehicles (EVs), hydrogen cars, planes, trains, helicopters, plus other smaller vehicles such as bicycles, scooters, motor-cycles and simply ‘walking’.


Our numbers are built up for each category, in kWh-per-mile, miles-per-gallon, energy efficiency percentages and ultimate CO2 intensity per mile of travel. In turn, these numbers are built up from physics calculations, enthalpy calculations and technical disclosures of underlying companies.

A good rule of thumb is that a passenger car achieves 20-40mpg and 15-20% efficiency, depending on its size; a bus or truck achieves 5-10 vehicle miles per gallon, but this is equivalent to up to 50-250 passenger-equivalent miles per gallon, because of a higher load factor; and likewise a plane might achieve 0.2-0.5 vehicle miles per gallon, translating into 50-70 passenger miles per gallon, when you think of a plane as just a flying bus.

Electrification generally offers a c4x gain in vehicle fuel economy and energy efficiency, especially for ground-level vehicles, increasing efficiency from c15-20% on conventional oil-powered vehicles to c60-80% on electric vehicles. Hybrids and hydrogen also yield modest efficiency improvements.

Smaller vehicles are surprisingly exciting. This is just physics, but a bicycle achieves an effective fuel economy of 1,000 miles per gallon-equivalent, which is about 8x better than an electric vehicle, and even 3x better than walking (note here). Moreover, an emerging class of electric transportation technologies is fast, convenient and yet achieve 4-120x efficiency gains per passenger mile (note here).

Further data dis-aggregating the CO2 intensity per mile of electric vehicles versus ICE cars, depending on how they are powered, is linked here.

Our Top Technologies for IMO 2020

Refineries become bio-refineries

So far we have reviewed 450 patents in the downstream oil and gas industry (ex-chemicals). A rare few prompted an excited thought — “that could be useful when IMO 2020 comes around”.  Hence, this data-file summarises the top 25+ proprietary technologies we have seen to capitalise on the opportunity. They are summarised and “scored” by company.

We will also provide you with updates of this file, as we continue reviewing patents and technical papers.

Copyright: Thunder Said Energy, 2019-2024.