Methane emissions from pneumatic devices: by operator, by basin?

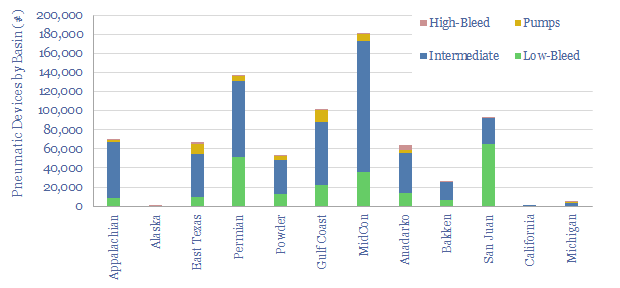
Methane emissions from pneumatic devices across the US onshore oil and gas industry comprise 50% of all US upstream methane leaks and 15% of all upstream CO2. This data-file aggregates data on 800,000 pneumatic devices, from 300 acreage positions, of 200 onshore producers, in 12 US basins.


Pneumatic devices are valves and pumps that are actuated by pressurized natural gas, widely used in the oil and gas industry, and numbering around 800,000 in the US in 2021, across 22Mboed of production that we are tracking, acreage position by acreage position, based on EPA disclosures.

The problem with pneumatic devices is that they leak methane, a greenhouse gas, emitting an average of 1 ton of methane per device per year, explaining 20MTpa of US CO2e emissions, equivalent to 2.5 kg/boe of Scope 1 CO2 emissions, or around half of the CO2 attributed to methane leaks in the US upstream oil and gas industry.

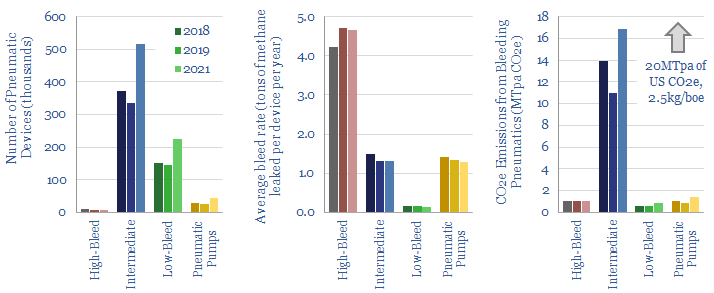
So over time, we expect bleeding pneumatic devices to be phased out in the US, especially ‘high bleed’ pneumatic devices, which emit around 5 tons of methane per device per year, as part of the industry’s growing efforts to mitigate methane. (This note also covers companies in the supply chain to help mitigate methane emissions from pneumatic devices, including a switch to electrically actuated devices, example here).

We have been tracking methane emissions from pneumatic devices in the US oilfield since 2018, although the latest data from 2021 do not show much improvement in aggregate (chart above).

The average well that is in operation in the US oilfield is associated with 1.4 bleeding pneumatic devices, although it is highest in basins that produce similar quantities of both oil and gas, at 2-3 pneumatic devices per well in the MidCon, Anadarko basin and Eagle Ford, while it is lowest in the Marcellus and Utica, at 0.75 pneumatic devices per well, as pure-play gas producers primarily aim to monetize not leak their gas.

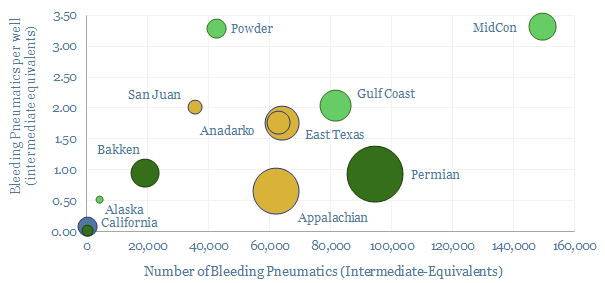
Methodology. Note that in the chart above we have adjusted the data into ‘intermediate equivalents’. For example, the average low-bleed pneumatic device emits 9x less methane than the average intermediate-bleed device, and so we consider 9 low-bleed devices “equivalent” to one intermediate bleed device.

Pneumatic devices per well also vary vastly by operator. The best operators have well below 0.5 pneumatic devices per well, while some have shifted almost entirely to electrically actuated devices that use no methane.

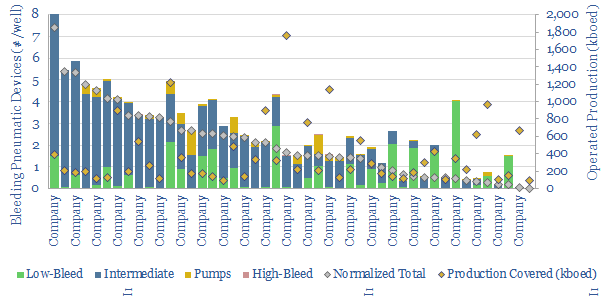
Leaders include Pioneer, EOG, Diamondback, with no high-bleed pneumatic devices, and very few intermediate-bleed pneumatic devices across their portfolios.

On the other side of the spectrum are operators with 2-7 bleeding pneumatic devices per well. We have wondered in the past whether regulations are going to tighten and clamp down upon bleeding pneumatic devices, especially high bleed pneumatic devices, and create large capex burdens on companies with methane-leaking assets.

In one case, it is surprising to us that a well-known E&P company, advertising itself as one of the ‘greenest’ operators in the US still has over 1,000 high-bleed pneumatic devices across its asset base, or over 10% of all the high-bleed pneumatic devices in the US.

Underlying data into the CO2 intensity of US oil and gas producers is aggregated by basin, by producer and by acreage position here. Another large source of methane leaks is flaring, covered in our note here.

Ventures for an Energy Transition?

Oil Major Venture Investments

This database tabulates almost 300 venture investments made by 9 of the leading Oil Majors, as the energy industry advances and transitions.


The largest portion of activity is now aimed at incubating New Energy technologies (c50% of the investments), as might be expected. Conversely, when we first created the data-file, in early-2019, the lion’s share of historical investments were in upstream technologies (c40% of the total). The investments are also highly digital (c40% of the total).

Four Oil Majors are incubating capabilities in new energies, as the energy system evolves. We are impressed by the opportunities they have accessed. Venturing is likely the right model to create most value in this fast-evolving space.

The full database shows which topic areas are most actively targeted by the Majors’ venturing, broken down across 25 sub-categories, including by company. We also chart which companies have gained stakes in the most interesting start-ups.

Floating production systems versus subsea tiebacks: the costs?

FPSO costs versus subsea tiebacks

This model estimates the line-by-line costs of an FPSO project, across c45 distinct cost lines, in order to quantify the potential savings of a tieback or a ‘fully subsea’ development.


Our estimates drawing on four technical papers, as illustrated in the backup tabs of the model. For a full discussion, see our recent note ‘The future of offshore: fully subsea‘.

We estimate c$750M of cost savings for a tieback, and c$500M of cost savings for a fully subsea development, as compared against a traditional project with a traditional production facility.  Please download the model to see the different cost drivers, line-by-line.

Fully subsea offshore projects: the economics?

Fully subsea project economics

This model presents the economic impacts of developing a typical, 625Mboe offshore  gas condensate field using a fully subsea solution, compared against installing a new production facility.


Both projects are modelled out fully, to illstrate production profiles, per-barrel economics, capex metrics, NPVs, IRRs and sensitivity to oil and gas prices (e.g. breakevens).

The result of a fully offshore project is lower capex, lower opex, faster development and higher uptime, generating a c4% uplift in IRRs, a 50% uplift in NPV6 (below) and a 33% reduction in the project’s gas-breakeven price.

Please download the model to interrogate the numbers and input assumptions.

Power from Shore: the economics?

Oil Platform Power from Shore Economics

We model the economics of powering an oil platform from shore, using cheap renewable power instead of traditional gas turbines. This can lower upstream CO2 emissions by 5-15kg/bbl, or on average, around 70%; for a base case cost of $50-100/ton.


Our numbers are derived from reviewing technical papers, plus ten prior projects (mostly in Norway), which are tabulated in the data-file, including capex figures (in $M and $/W) where disclosed.

The costs of CO2 abatement can be flexed by varying inputs to the model, such as project size, gas prices, power prices and carbon prices.

Hybrid horizons: industrial use of batteries?

Hybrid Industrial Uses of Batteries

Gas and diesel engines can be particularly inefficient when idling, or running at 20-30% loads. At these levels, their fuel economy can be impaired by 30-80%. This is the rationale for hybridizing engines with backup batteries: the engines are always run at efficient, 80-100% loads, including to charge up the batteries, which can better cover lower intensity energy needs.

Hybrid passenger cars are the best known example, since Toyota re-introduced them in the late 1990s. c25-30% energy savings are achieved, including through engine down-sizing and regenerative breaking

Industrial applications are also increasingly taking hold as battery costs come down, achieving even higher, 30-65% energy savings. This data-file summarizes a dozen examples, from oil and gas, marine, construction and even the machinery at LNG plants.

Northern Lights CCS: the economics?

Northern Lights CCS economics

We have modeled out simple economics for Northern Lights, the most elaborate carbon capture and storage (CCS) scheme ever proposed by the energy industry (Equinor, Shell, TOTAL).

The project involves capturing industrial CO2, liquefying it, transporting it in ships, receiving it onshore in Norway, piping it 110km offshore, then injecting it 3,000m below the seabed. Phase 1 will likely sequester 1.3-1.5MTpa, with potential expansion to 5MTpa.

Our conclusion is that Phase 1 will be expensive. However, much of the infrastructure “scales”. So phase 2 could cost 35% less, bringing the “carbon storage” component to below Europe’s carbon price. This could be promising if combined with next-generation carbon separation or decarbonised gas technologies, to lower the “carbon capture” component.

Our economic estimates can be flexed in the ‘simple model’ tab. Underlying cost calculations are substantiated in the ‘Notes’ tab.

At the cutting edge of EOR?

Leading Oil Majors in EOR

This data-file summarises 120 patents into Enhanced Oil Recovery, filed by the leading Oil Majors in 2018. Based on the data, we identify the “top five companies” and what they are doing at the cutting edge of EOR.

We find clear leaders for water-flooding both carbonate and sandstone reservoirs. At mature fields, we think these operators may be able to derive >10pp higher recovery factors; and by extension, lower decline rates, higher cash flows and higher margins.

As more of the world’s oilfields age, having an “edge” in EOR technology will make particular Oil Majors more desirable operators and partners, to avoid the higher costs and CO2 intensities of developing new fields to replace them.


Subsea Separation: the elusive history

subsea separation projects in oil industry

This database covers all 14 subsea separation projects across the history of the oil industry, going back to the “dawn of subsea” in 1969.


For each example, we tabulate the asset, region, operator, water depth, process technology, Service company, start-up year, power rating, oil capacity, gas capacity, water capacity and some notes.

What is interesting about the data is how elusive the technology’s ascent has been. Two of our projects were cancelled. The largest were 2.3MW. Subsea Boosting and Compression has been 4x more prevalent (chart below).

This matters for the Mero pre-salt field where an unprecedented, giant, 6MW subsea-separation project is being pioneered, to handle high gas and CO2 cuts.

Johan Sverdrup: Don’t Decline

Johan Sverdrup’s decline rates

Equinor is deploying three world-class technologies to mitigate Johan Sverdrup’s decline rates, based on reviewing c115 of the company’s patents and dozens of technical papers. This 15-page note outlines how its efforts may unlock an incremental $3-5bn of value from the field, as production surprises to the upside.

Copyright: Thunder Said Energy, 2019-2024.