Transaction prices for power generation assets are tabulated in this data-file, capturing 65 deals for gas plants, wind, solar, hydro and nuclear, globally and over time. Median prices are c$1,000/kW, but range from <$400/kW in the lower decile to >$2,500 in the upper decile.
Transaction prices for power generation assets vary widely in different contexts. This data-file helps to understand prices paid, and how they are changing over time.
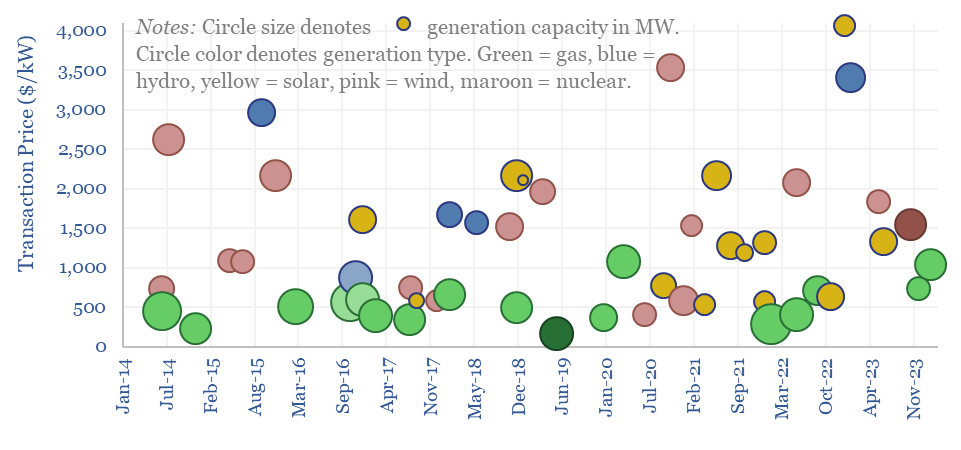
Transaction prices for gas generation assets have been lowest among the different categories, averaging $500/kW over the past decade, which is actually below the costs of constructing new CCGTs at c$950/kW.
Low prices attribute to overcapacity and higher gas prices, especially in Europe and in 2014-2015. However the value of gas plants has been increasing over time, and recent deal prices have surpassed $1,000/kW.
Transaction prices for wind assets and solar assets have been highly variable, ranging from $400/kW to $4,000/kW. It all hinges on the strike price and duration of power purchase agreements.
For example, a pair of solar assets in Japan transacted at $4,000/kW in July-2017, backstopped by 25-28c/kWh PPAs lasting for another 19-years. Conversely, renewable assets transacting at $400-600/kW tended to sell their power on a merchant basis.
Transaction prices for low-carbon baseload generation, such as hydro plants and nuclear plants were highest, averaging $1,500-2,000/kW, however fewer assets in these categories change hands.
In some cases, nuclear deal prices have been distorted to the downside by the assumption of decommissioning liabilities. And we think the value of these assets may be higher than measured in the data-file.
Transaction prices for power generation assets are tabulated in this data-file, capturing over 65 transactions, sorted by region, acquirer, seller, deal price (in $M), generation capacity (MW), transaction price ($/kW), plus notes contextualizing each transaction.
Note, this database was last updated in August-2024, and contains 10 data-points for 2024, which are not shown in the title chart above.