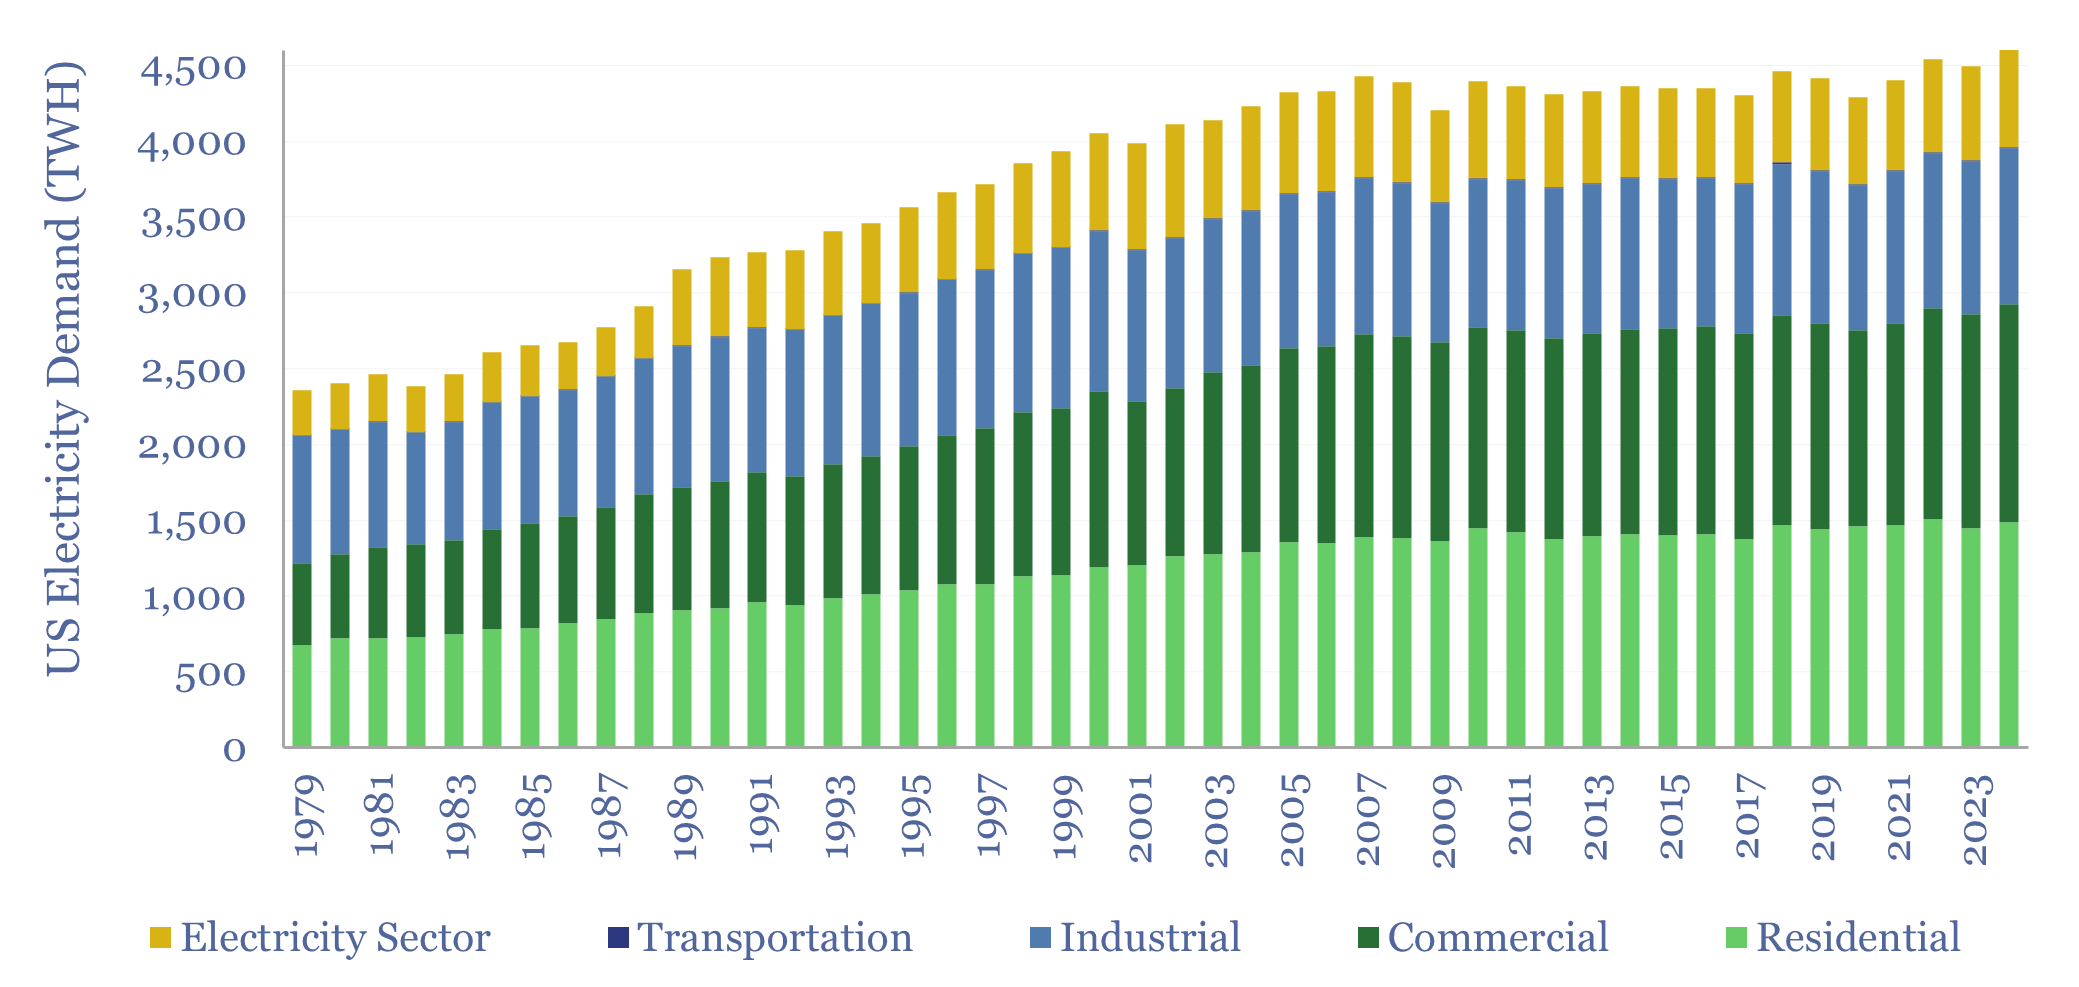
US electricity sales reached 4,000 TWH in 2024, rising +2.3% YoY, and bringing the trailing ten-year CAGR to 0.5% pa. The current breakdown is 38% residential, 36% commercial, 26% industrial. All three are now growing. To help understand load growth, this data-file is a breakdown of US electricity demand by sector, by use and over time.
In this data-file, we have disaggregated US electricity demand, across 110 separate categories, going back as far as possible, in order to help inform our US energy models amidst the energy transition and the rise of AI. For some lines, we have been able to take the data series back to the 1990s, or even the 1970s (examples below).
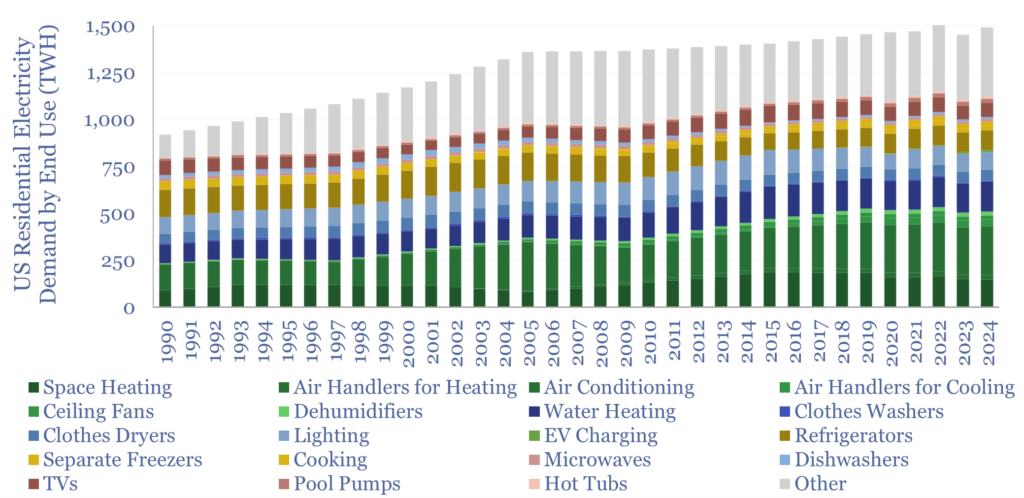
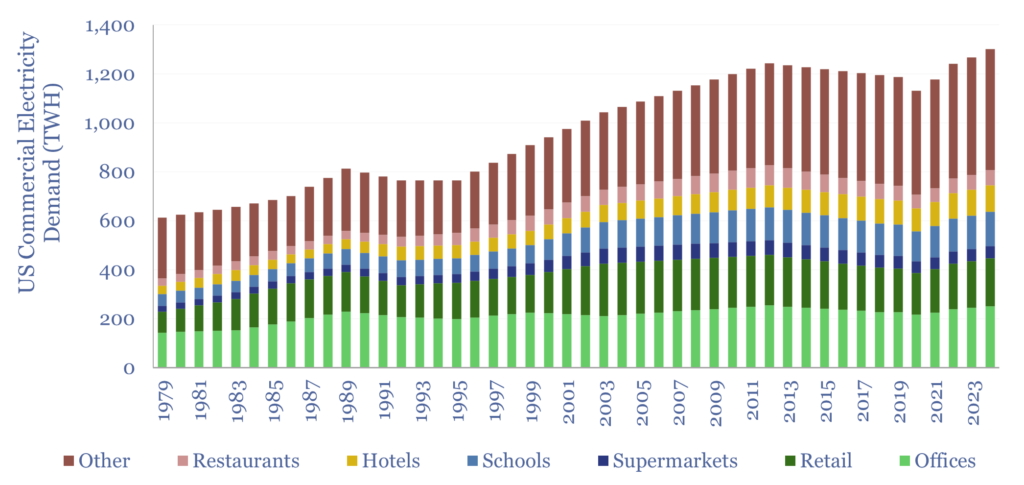
The underlying source for the data are periodic surveys of residential, commercial and industrial electricity demand from the EIA. These surveys are relatively infrequent and have changing data definitions over time. Hence a large part of the work in our data-file is simply our best attempt at interpolations and data-smoothing, based on our broader data-files.
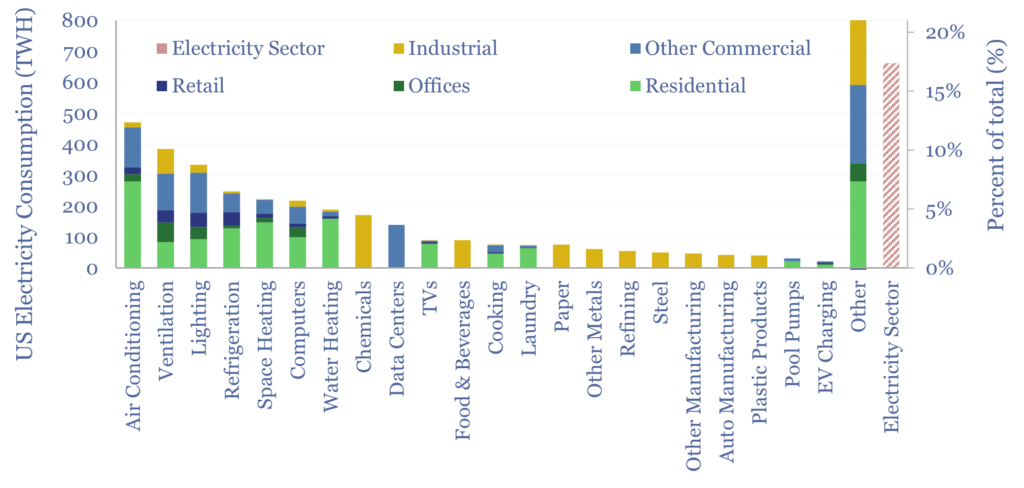
Our estimated breakdown of US electricity demand in 2024 is shown below. The “big three” categories are air conditioning (12% of US electricity demand), ventilation (10%) and lighting (8%). Plus a long tail…
It is interesting to break down some of these large categories, and see how they have changed over time, including due to the deployment of more efficient lighting technologies such as LEDs, coupled with rebound effects.
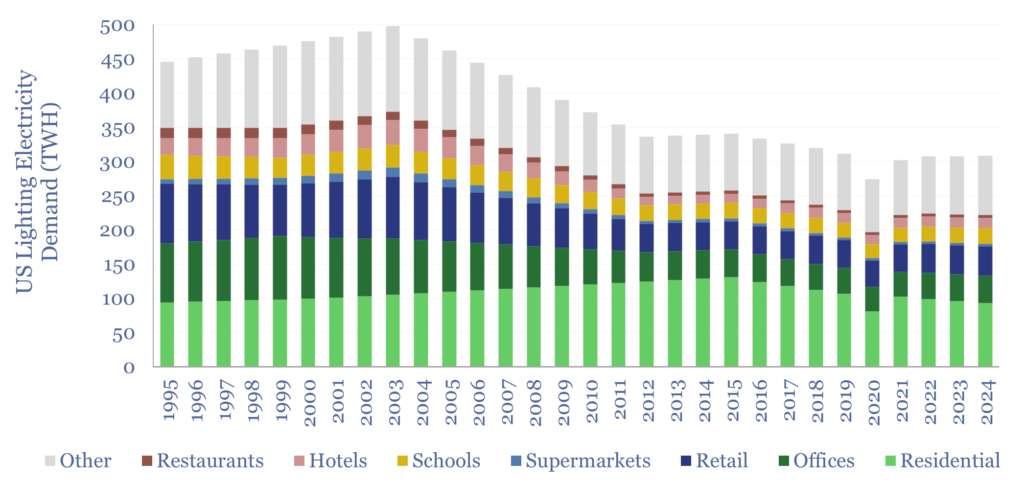
New energies are still surprisingly small as a portion of electricity demand. For example, we think the US used about 20 TWH of electricity for electric vehicles in 2024, which is about the same as residential pool pumps! Not a great omen for decarbonization.
Electric motors, it is said, comprise about 40-50% of global electricity use, and this is borne out by our breakdown. Note that among the largest categories, air conditioners and fridges contain motorized compressors. Ventilation units contain fans and blowers.
Industrial categories are covered in the data-file, such as steel, chemicals, refining, paper. We have also aimed to allocate a share of ventilation, lighting, air conditioning, etc to industrial categories. But total industrial floor space is 10% of commercial floor space, so these numbers are small.
20% of US electricity demand remains unallocated, and most likely comprises highly specialized machinery, which is thus too small to aggregate: everything from vapor deposition machines, to dialysis machines, to electric submersible pumps.
We will continue updating this file, based on future releases of the EIA’s energy consumption surveys. Underlying charts and data are available in the data-file.
