Search results for: “renewables”
-
Energy Costs of Constructing Solar Assets
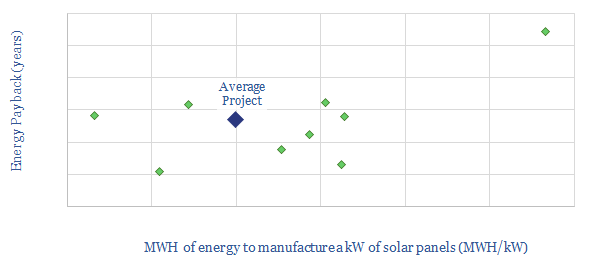
This data-file quantifies the energy costs of manufacturing solar panels, based on 10 studies and prior projects. We see the average solar project requiring 5MWH/kW, with a 2.3-year energy payback, a c10x energy-return on energy-invested and CO2-intensity of 90kg/boe (for contrast, average oil is c440kg/boe and average gas is c350kg/boe).
-
Solar water heaters: the economics?
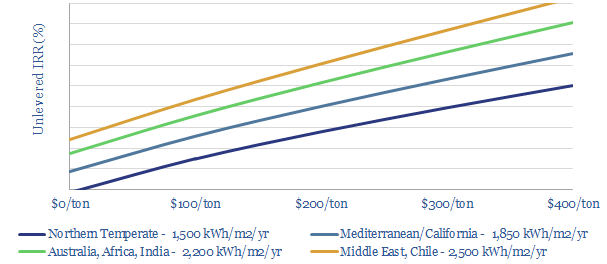
Under our base case estimates, a $130/ton CO2 price is required to achieve passable economics and incentivize rooftop solar heaters. Once installed, solar heaters save around 1T of CO2 per household per year and lower water heating bills by 50-80%. This data-file models the economics.
-
US ethanol plants: what CO2 intensity?
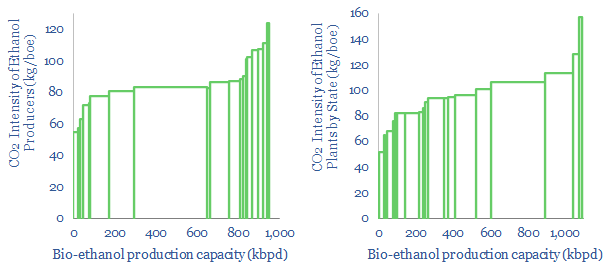
US bioethanol plants produce 1Mbpd of liquid fuels, with an average CO2 intensity of 85kg/boe. Overall, corn-based bioethanol has c40% lower CO2 than oil products. We screened the leaders and laggards by CO2-intensity, covering Poet, Valero, Great Plains, Koch, Marathon and White Energy.
-
Biomass to biofuel, or biomass for burial?
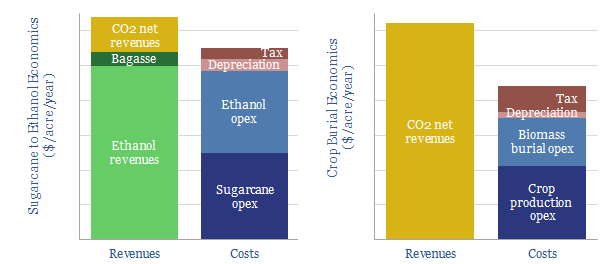
Greater decarbonization at a lower cost is achievable by burying biomass (such as corn or sugarcane) rather than converting it into bio-ethanol. This model captures the economics. Detailed costs and CO2 comparisons are shown under different iterations.
-
Leading Companies in Battery Recycling?
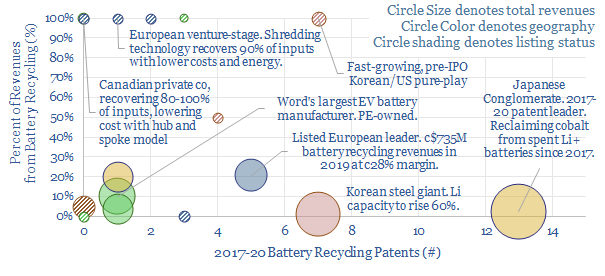
This data-file tracks over 6,000 patents filed into battery recycling technology, escalating at a 15% CAGR since 2000. 18 technology leaders are profiled ex-China, including 6 global, large-cap listed companies and 10 private companies, including some exciting, early-stage concepts to improve material recovery and costs.
-
Nuclear Power Project Economics
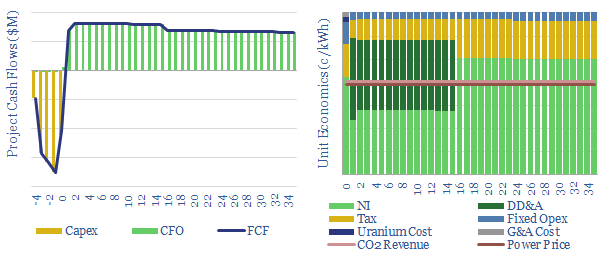
This data-file models the costs of nuclear power project, based on technical papers and past projects around the industry. An up-front capex cost of $6,000/kW might yield a levelized cost of 15c/kWh. But 6-10c/kWh is achievable via a renaissnace in next-generation nuclear.
-
Renewable diesel: the economics?
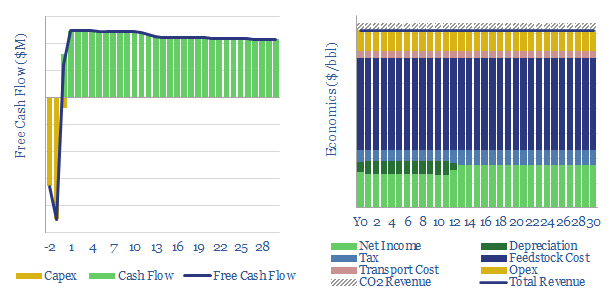
Our base case is that a US renewable diesel facility must achieve $4.6/gallon sales revenues (which is c$200/bbl) as it commercializes a product with up to 75% lower embedded emissions than conventional diesel. Similarly, a bio-diesel facility must achieve $3.6/gallon sales on a product with 60% lower embedded emissions.
-
Energy transition technologies: the pace of progress?
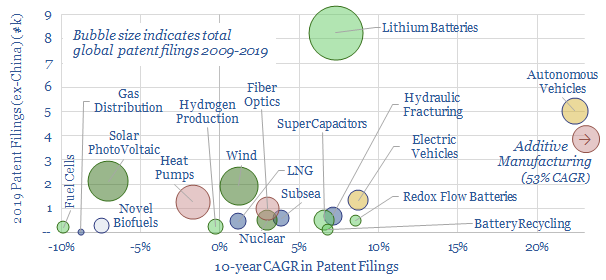
This data-file captures over 250,000 patents (ex-China) to assess the pace of progress in different energy transition technologies, yielding insights into batteries (high activity), autonomous vehicles and additive manufacturing (fastest acceleration), wind and solar (maturing), fuel cells and biofuels (waning) and other technologies.
-
Super-capacitors: technology leaders?
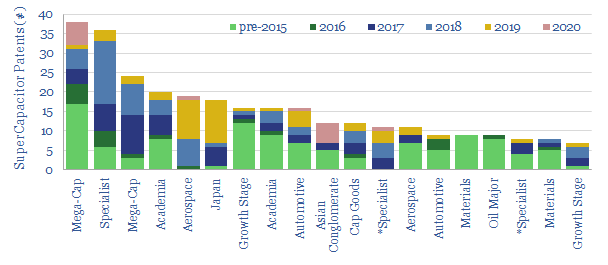
This data-file screens for the ‘top twenty’ technology leaders in super-capacitors, by assessing c2,000 Western patents filed since 2013. The screen comprises capital goods conglomerates, materials companies, an Oil Major with exposure and specialist companies improving SC energy density.
-
Green Hydrogen Economy: Holy Roman Empire?
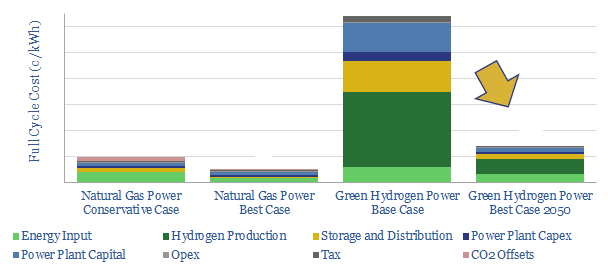
We model the green hydrogen value chain: harnessing renewable energy, electrolysing water, storing the hydrogen, then generating usable power in a fuel cell. Today’s costs are very high, at 64c/kWh. Even by 2050, our best case scenario is 14c/kWh, which elevates household electricity bills by $440-990/year compared with decarbonizing natural gas.
Content by Category
- Batteries (89)
- Biofuels (44)
- Carbon Intensity (49)
- CCS (63)
- CO2 Removals (9)
- Coal (38)
- Company Diligence (94)
- Data Models (838)
- Decarbonization (160)
- Demand (110)
- Digital (59)
- Downstream (44)
- Economic Model (204)
- Energy Efficiency (75)
- Hydrogen (63)
- Industry Data (279)
- LNG (48)
- Materials (82)
- Metals (80)
- Midstream (43)
- Natural Gas (148)
- Nature (76)
- Nuclear (23)
- Oil (164)
- Patents (38)
- Plastics (44)
- Power Grids (130)
- Renewables (149)
- Screen (117)
- Semiconductors (32)
- Shale (51)
- Solar (68)
- Supply-Demand (45)
- Vehicles (90)
- Wind (44)
- Written Research (354)