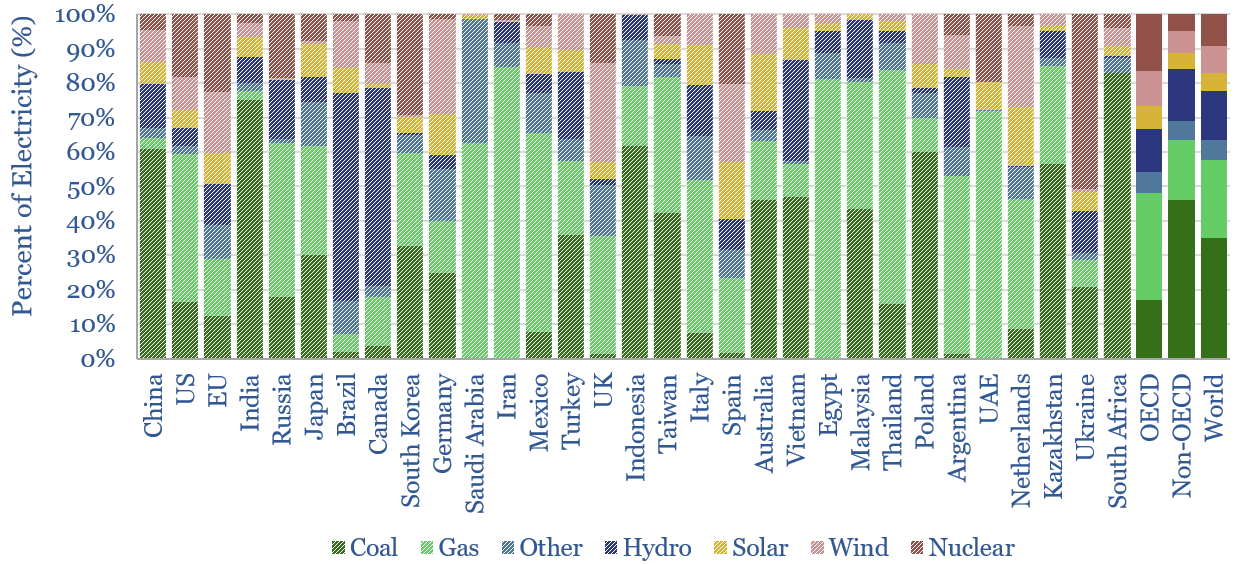
…electricity price of any country in our sample. How does grid utilization change as renewables ramp up? We think that the main reason increasingly renewables-heavy grids have seen higher costs…
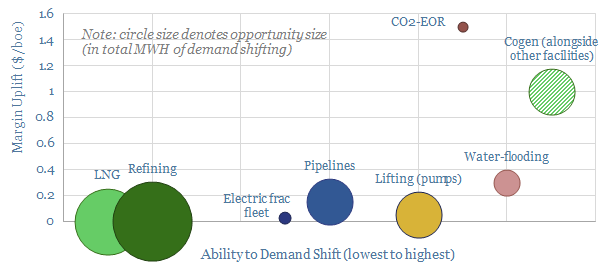
Industrial facilities that can shift electricity demand to coincide with excess renewables generation will effectively start printing money as renewables get over-built. They also help more renewables integrate into the…
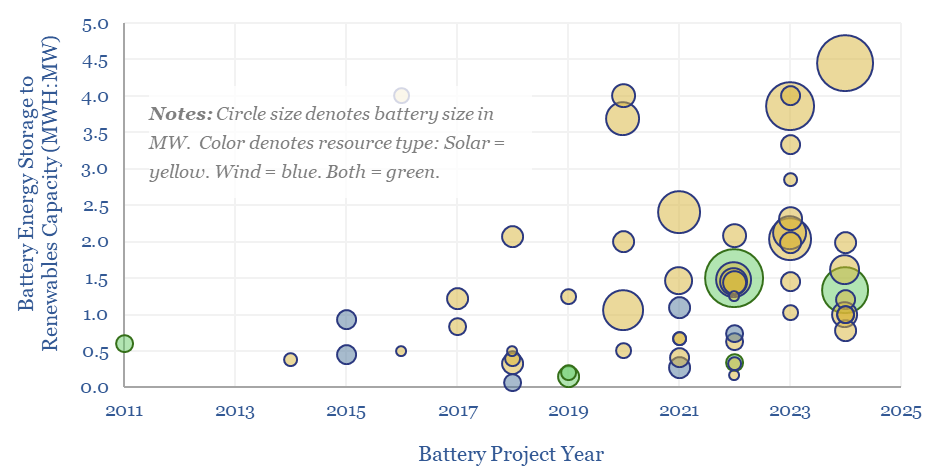
…will be deployed per MW of renewables capacity, comprising a mixture of standalone renewables projects and renewables projects that are co-developed with batteries. And there could be upside? Companies that…
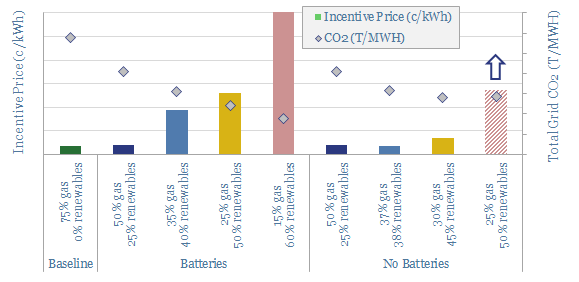
…incentive pricing. Large-scale batteries also increase incentive prices 5-25x. Natural gas is the best complement for renewables, with both between 25-50% of grid demand. What can help integrate more renewables…
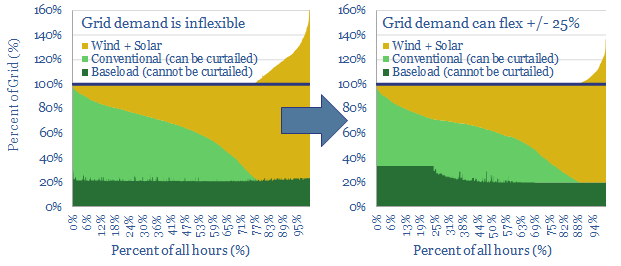
…while this can help accommodate an additional 10pp share for renewables in the grid, before extreme volatility begins to bite (see pages 18-19). Europe leads, and we now assume renewables…
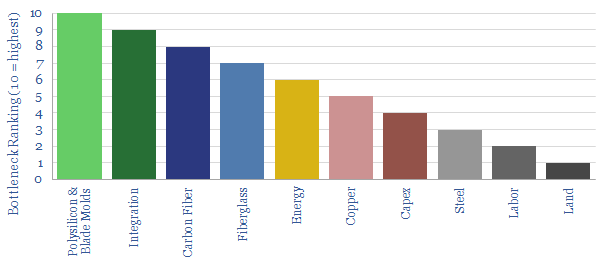
…renewables, but we do not think these are material barriers, by contrast to the others (pages 10-11). Our conclusion is that appetite to scale renewables will rise sharply in 2022….
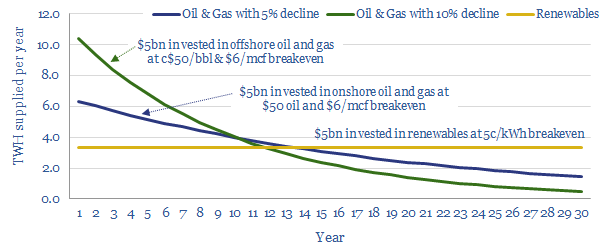
…oil and gas go 2-3x further in the short-run. To meet the same initial demand from renewables, one must currently spend 2-3x more. Further renewables deflation of c50-70% is required…
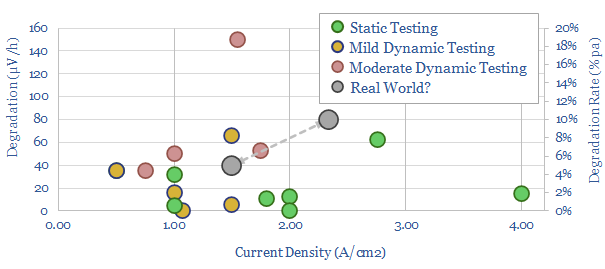
…renewables is volatile. The volatility of solar includes around 100 volatility events per day. The volatility of wind includes around 75 volatility events per day. This is usually fine, as…
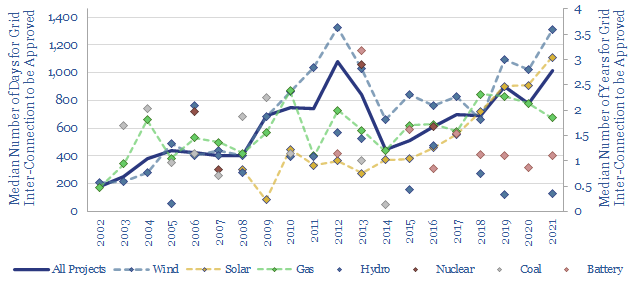
Is the power grid becoming a bottleneck for the continued acceleration of renewables? The median approval time to connect to the grid for a new US power project has climbed…
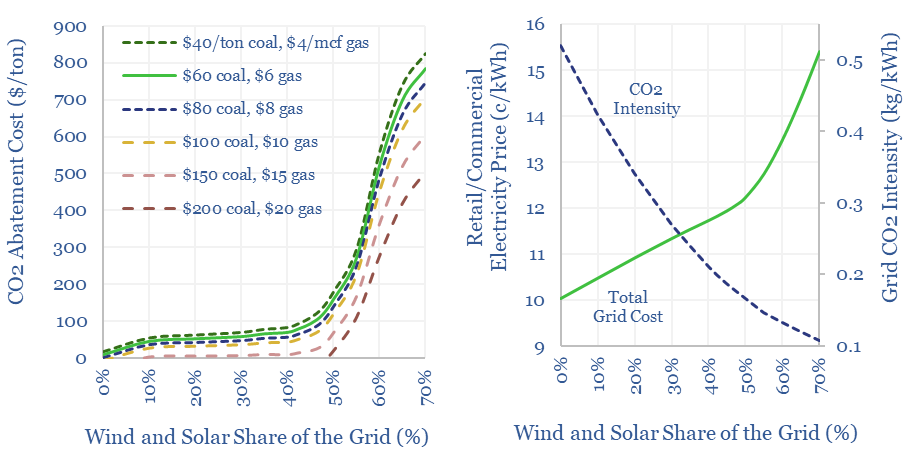
…renewables, in different contexts and at different grid penetrations. Our own estimate is that solar and wind can reach 40% of the global grid for a $60/ton average CO2 abatement…


