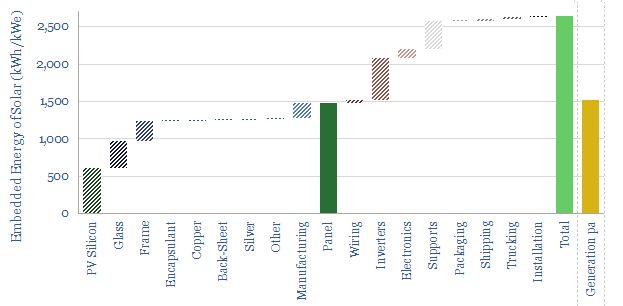
…(in kWh/kW). Our base case estimate is 2.5 MWH/kWe of solar. The average energy payback of solar is 1.5-years. Numbers and sensitivities can be stress-tested in the data-file. $499.00 – Purchase Checkout…
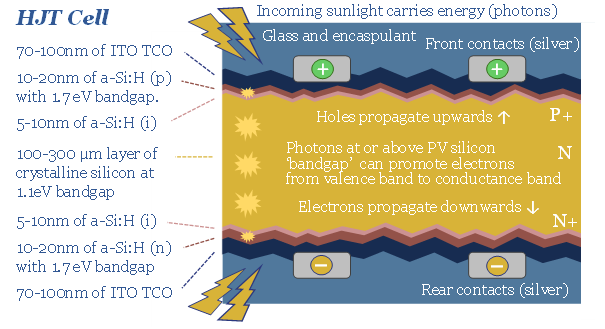
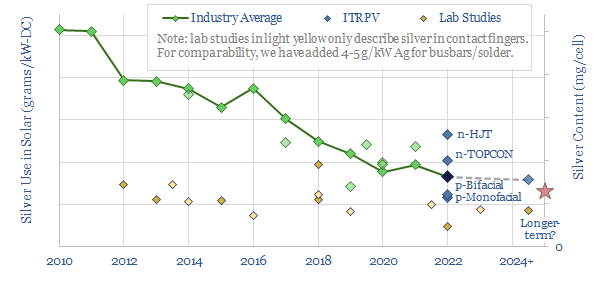
…benefits of using Indium in HJT solar, and who benefits as solar evolves? $499.00 – Purchase Checkout Added to cart Solar energy is a semiconductor technology and thus it evolves quickly. Last…
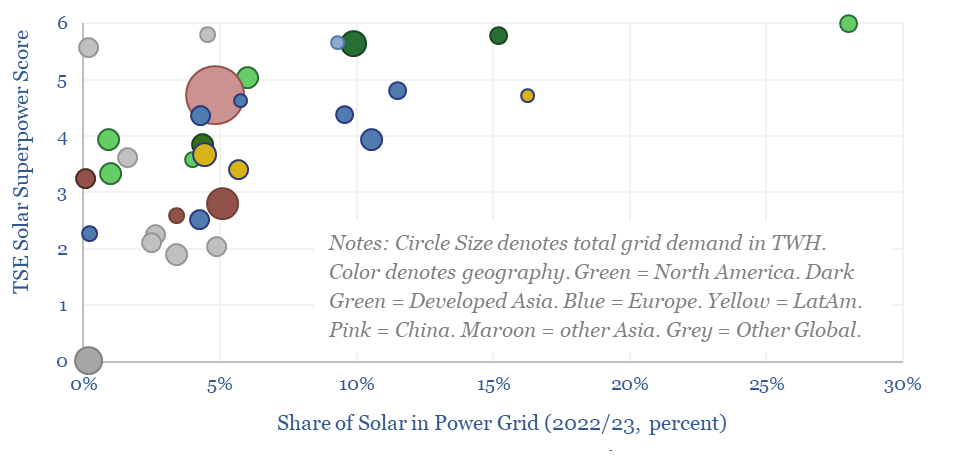
Solar ramps from 6% of global electricity in 2023, to 35% in 2050. But could any regions become Solar Superpowers and reach 50% solar in their grids? And which regions…
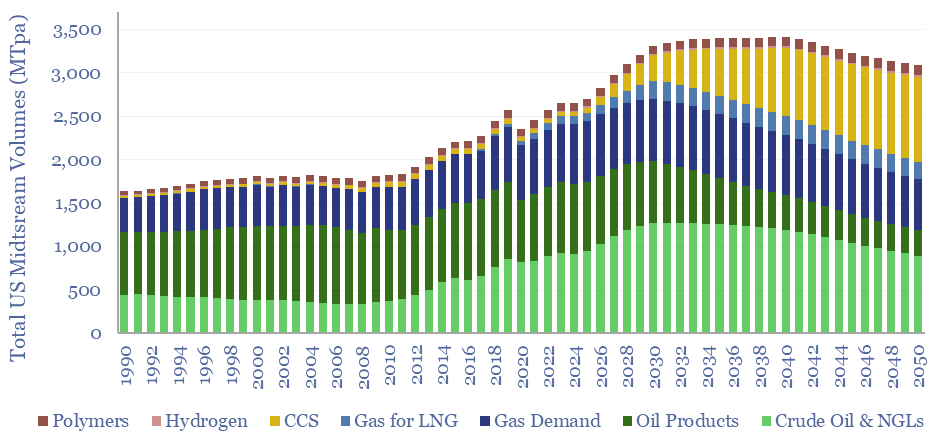
…in the global energy industry, due to the inherent volatility of solar and wind. Rising volatility increases the value of midstream infrastructure, which by definition, can arbitrage the volatility by…
…shortages and accelerating the energy transition is to accelerate solar capacity additions. Our solar forecasts are discussed here, modelled here and re-capped on page 2. Solar bottlenecks. There are seven…
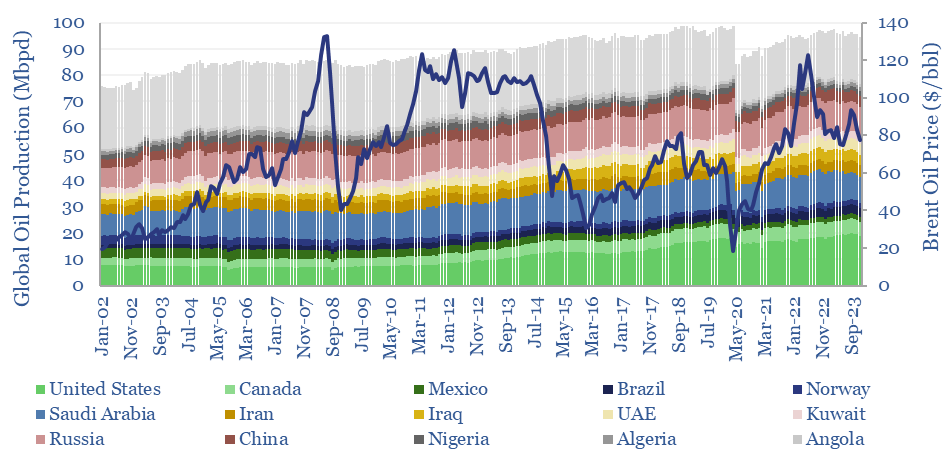
…Arabia, Kuwait, UAE, the US, Canada and Russia very clearly adapt their growth/output to market pricing signals, which actually dampens down supply volatility. Countries with the highest volatility in their…
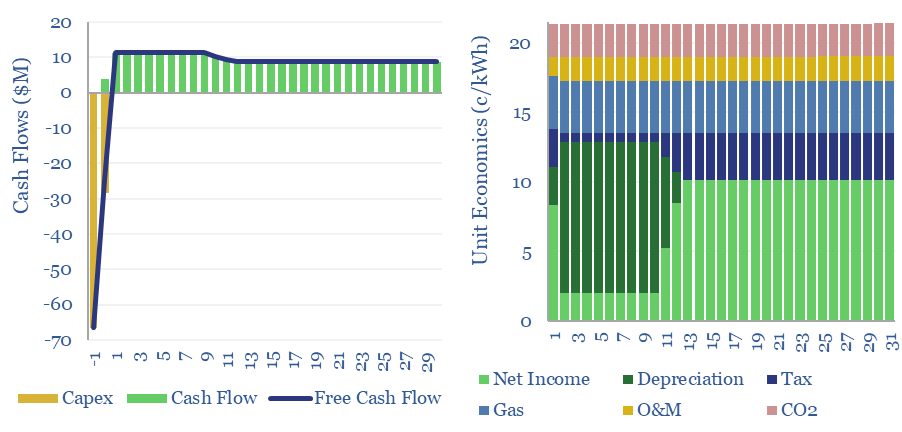
…pricing volatility. A fascinating observation is that each 1 c/kWh increase in power grid volatility increases peaker plant cash flows by $6/kW/year. Each 1pp reduction in utilization rate lowers cash…
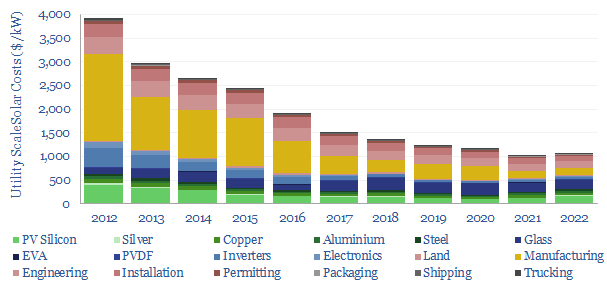
Solar costs have deflated by 75% in the past decade to around $1,000/kW. 60% has been the scale-up to mass manufacturing, and 40% has been rising efficiency of solar modules….
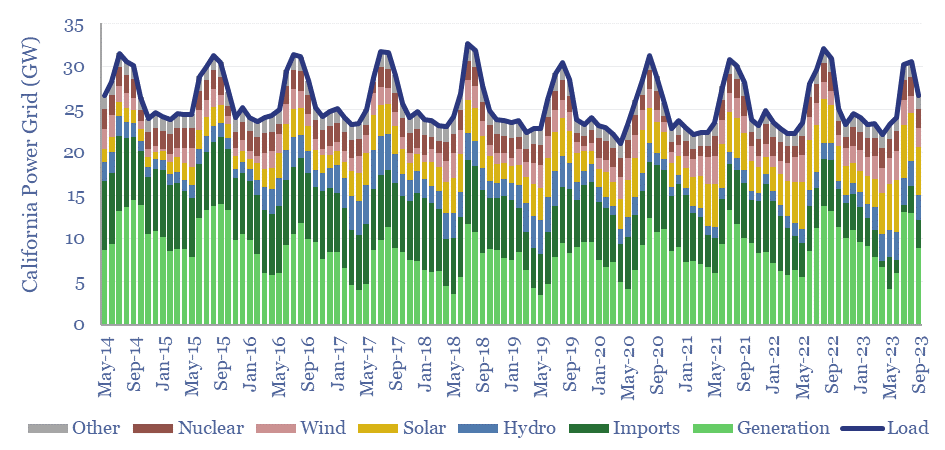
…of the grid over the past decade. Solar generation is volatile. The average load from solar was 4GW in the trailing twelve months, but c40% of the time, solar generation…
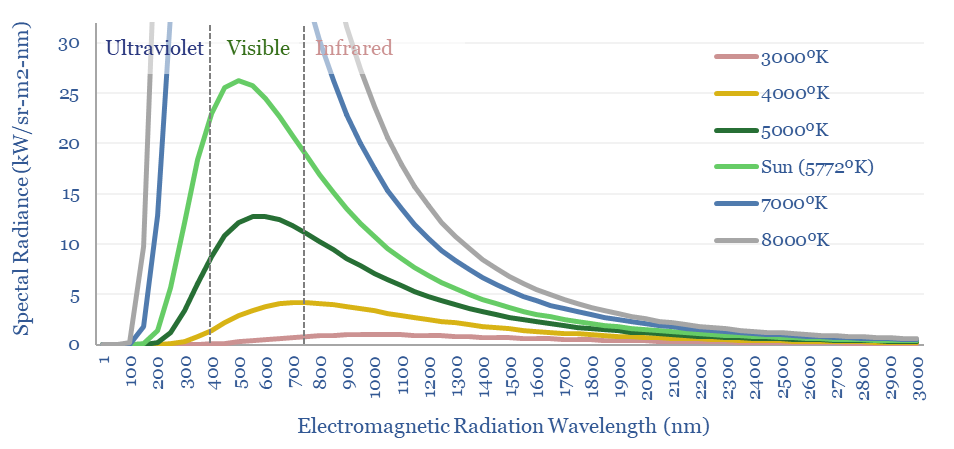
…solar module, and can be used to derive the famous Shockley-Queisser limit from first principles, which says that a single-junction solar cell can never be more than c30-33% efficient at…