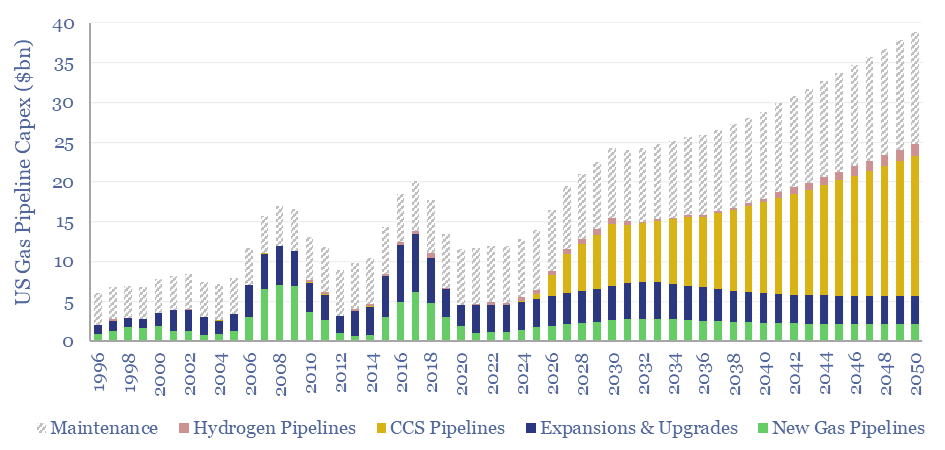
US gas pipeline capex over time?
…per line. However, the main gas transmission network consists of 30 x large lines each running 2,000 – 15,000 miles. GTpa scale CCS in the US could continue leaning on…

…per line. However, the main gas transmission network consists of 30 x large lines each running 2,000 – 15,000 miles. GTpa scale CCS in the US could continue leaning on…
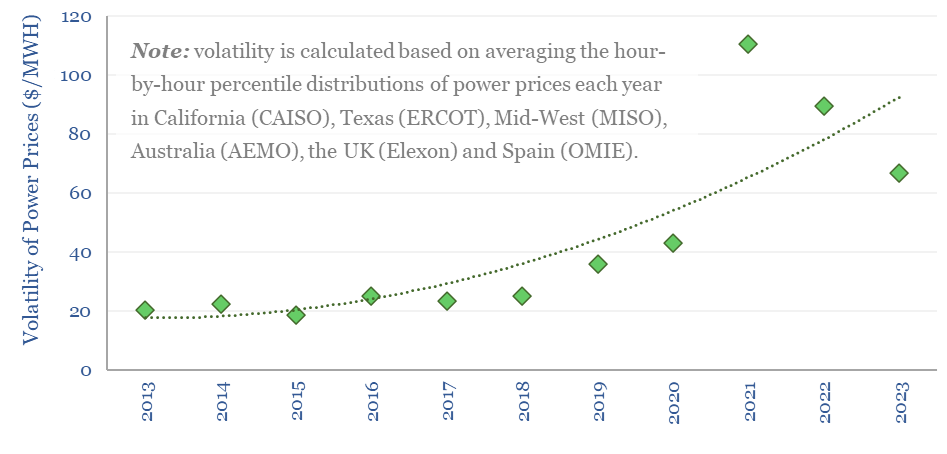
…trading and marketing, grid-scale batteries, some biofuels and biogas. But how much is global power price volatility actually rising? You can drown in data, trying to answer this question! Hence…
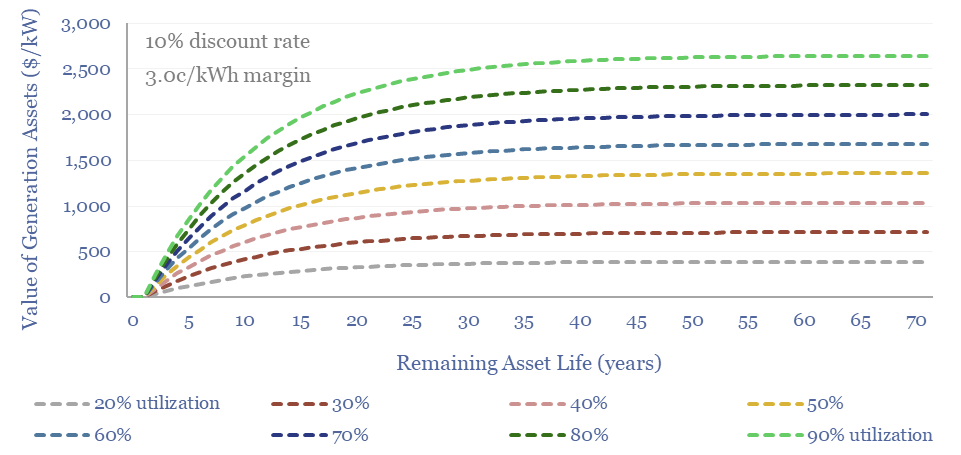
…and grid-scale batteries, as quantified on pages 8-9, but looming PPA cliffs for maturing solar and wind assets, considered on pages 10-12. Carbon credentials are another dimension which can sway…
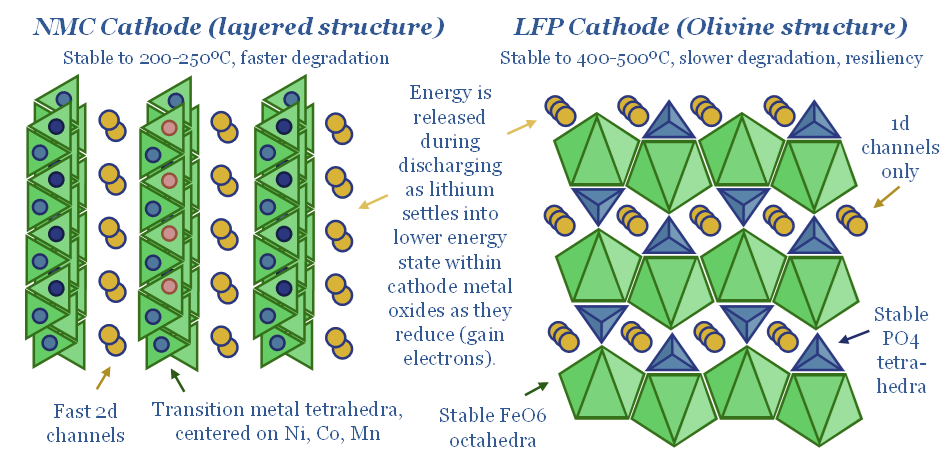
…versus ICEs, on page 13. How will cheap Chinese LFP impact the outlook for renewables and grid-scale batteries? We re-evaluate storage spreads on pages 14-15. $599.00 – Purchase Checkout Added to cart…
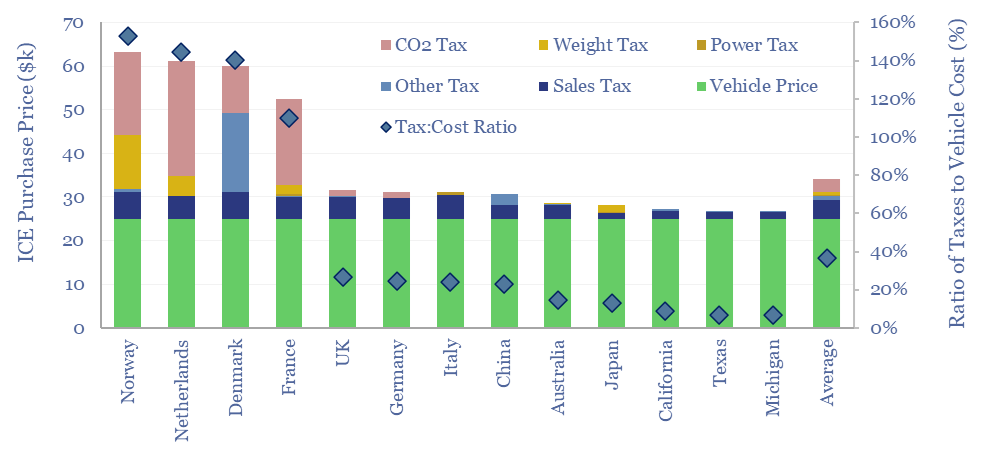
…EVs to such high adoption in many Northern European economies. This data-file quantifies vehicle taxes by country, which turns out to be a complex calculation, with sliding-scale formulae linked to…
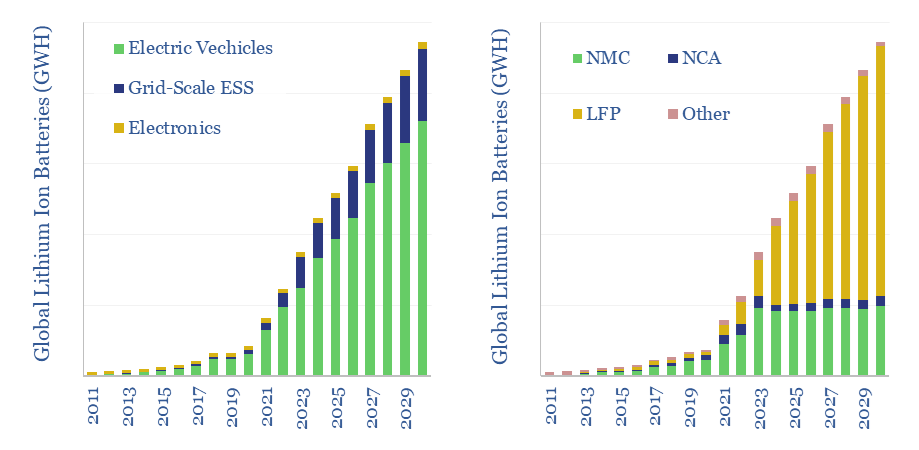
…and forecasting agencies. Over 70% of the lithium ion battery market is for electric vehicles, followed by grid-scale energy storage, and incorporation into electronic devices. Our forecasts for lithium ion…
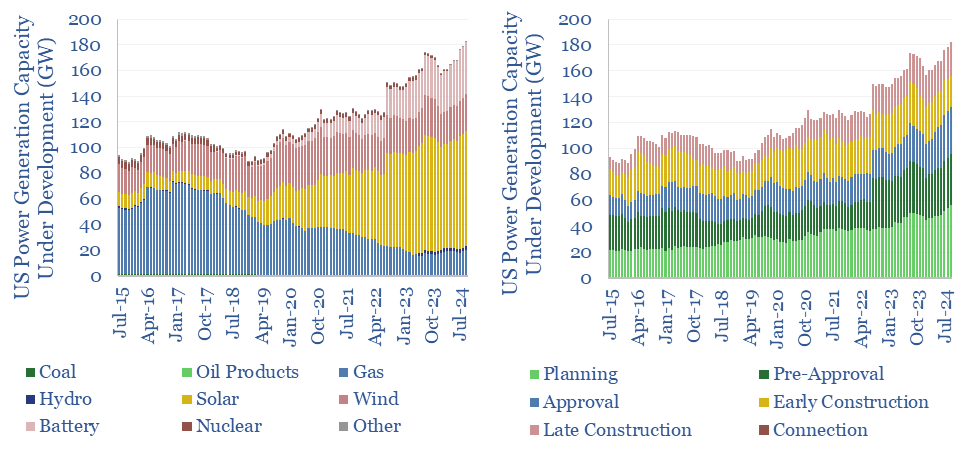
…momentum has slowed, gas has re-accelerated, but grid-scale battery activity is accelerating fastest and now making an all-time peak, based on tracking new projects being added to the EIA’s 860M…
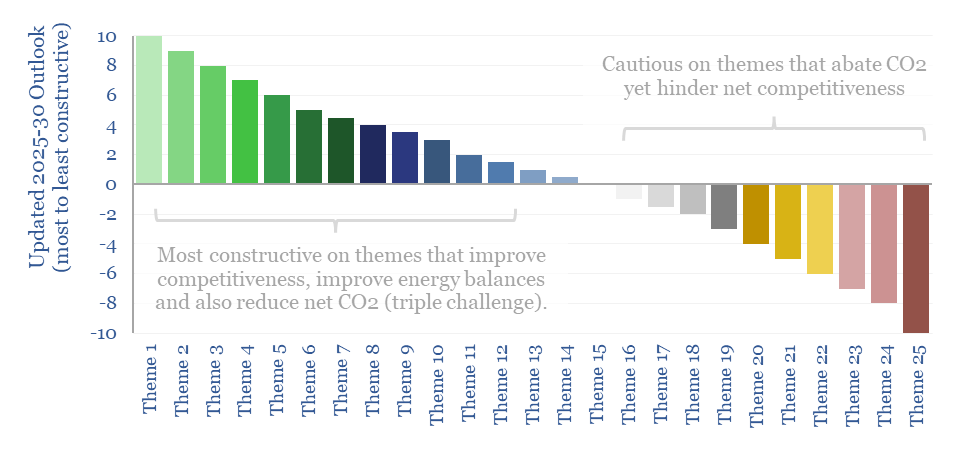
…1 GB of data with 15,000x less energy than physically transporting it. Bridges, canals, railways and transmission lines save MT-scale CO2. Examples and case studies are on pages 8-10. Boosting…
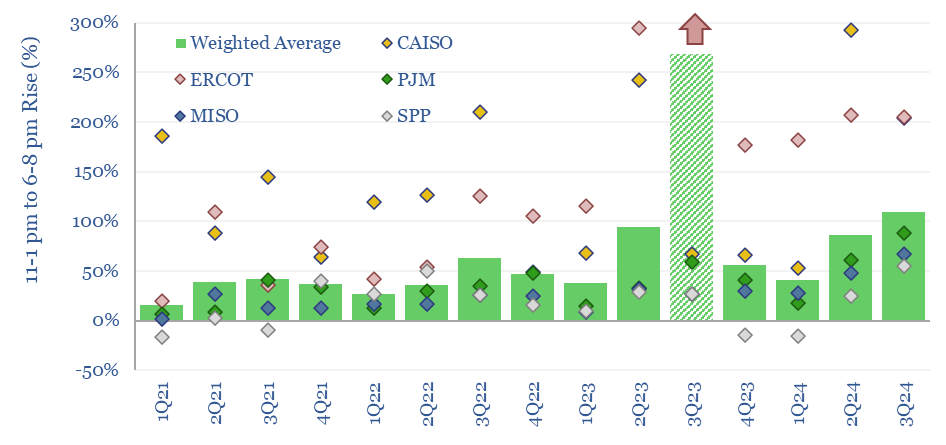
…has risen over time, across these grid regions, as solar scaled up from 3% of US electricity in 2020 to 6% in 2023. In 2021, power pricing at 6-8pm was…