Search results for: “renewables”
-
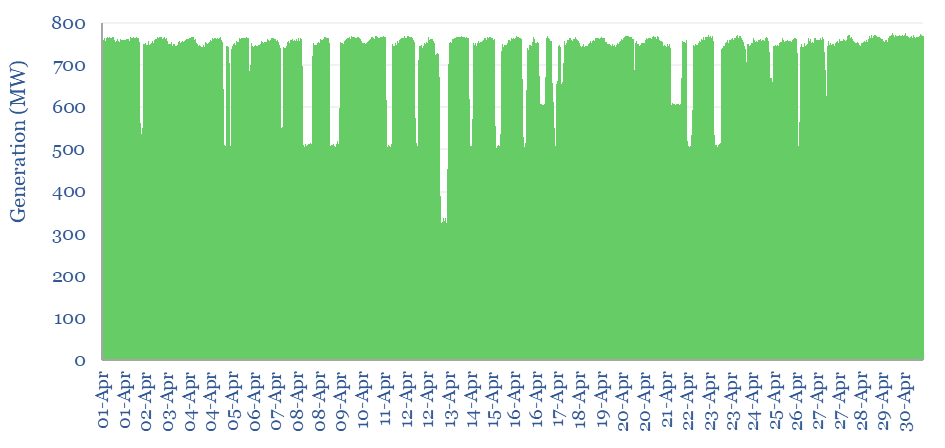
Power grids: when will wind and solar peak?
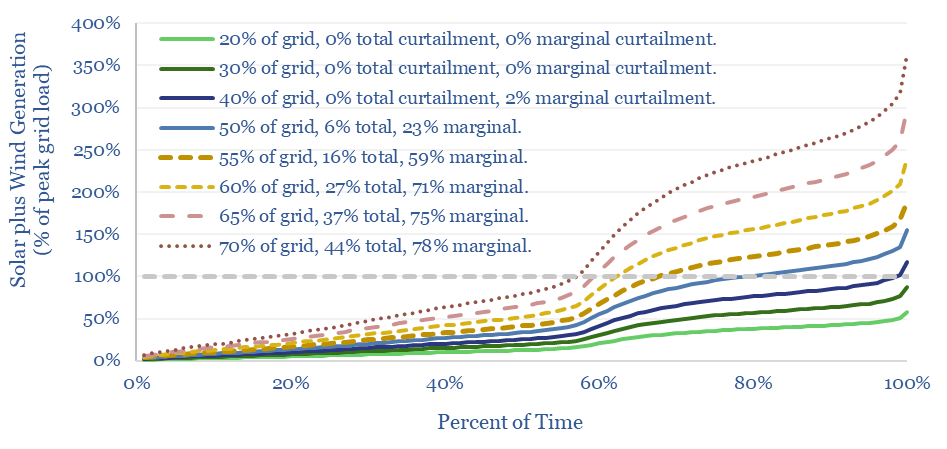
Wind and solar will most likely peak at 50-55% of power grids, without demand-shifting and batteries; more in wind-heavy grids, less in solar heavy grids. This 12-page note draws conclusions from the statistical distribution of renewables’ generation across 100,000 x 5-minute grid intervals.
-
US electric utilities: transmission and distribution costs?
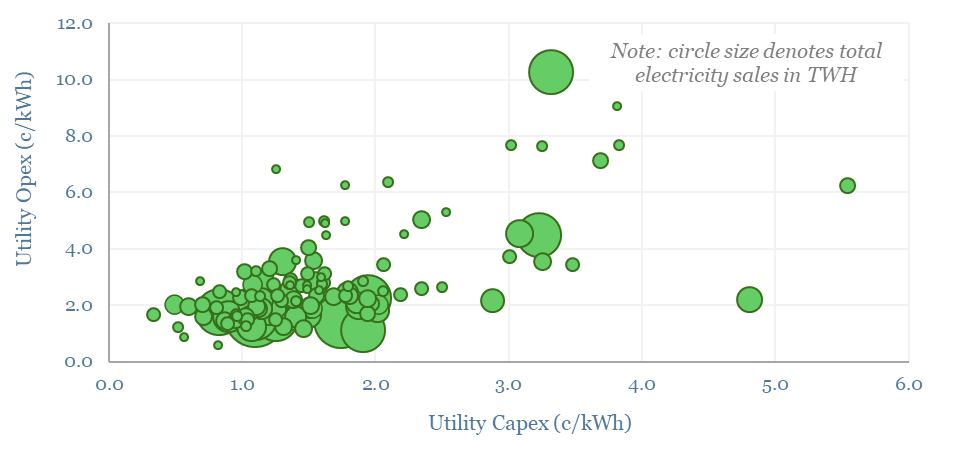
This data-file evaluates transmission and distribution costs, averaging 7c/kWh in 2024, based on granular disclosures for 200 regulated US electric utilities, which sell 65% of the US’s total electricity to 110M residential and commercial customers. Costs have doubled since 2005. Which utilities have rising rate bases and efficiently low opex?
-
Gas power generation across five-minute intervals?
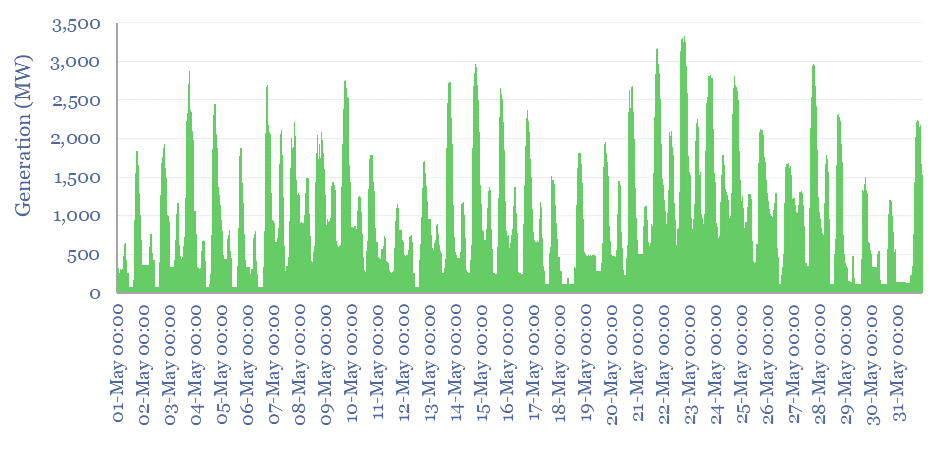
Power generation data are aggregated for ten of the largest CCGTs and gas peaker plants in Australia, across five-minute intervals, May-2024 and May-2014. This makes for a fascinating case study into how gas turbines are used to stabilize power grids, backstop renewables, and how this has changed over time.
-
Grid-scale battery operation: a case study?
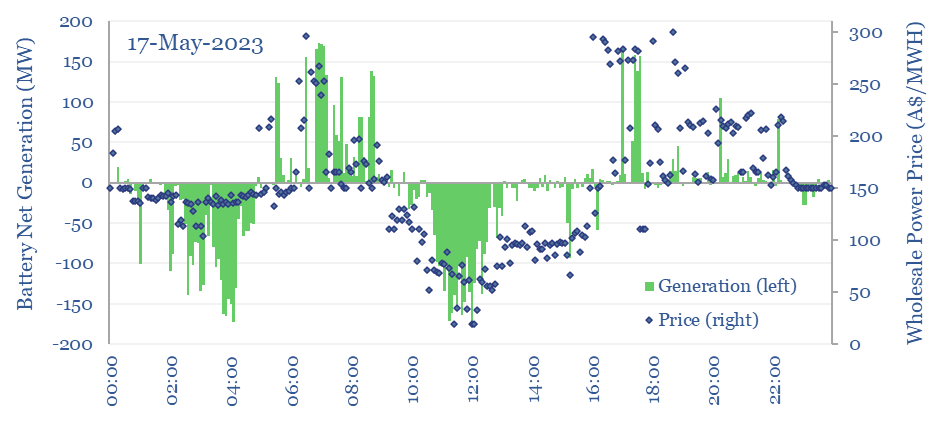
Grid-scale batteries are not simply operated to store up excess renewables and move them to non-windy and non-sunny moments, in order to increase reneawble penetration rates. Their key practical rationale is providing short-term grid stability to increasingly volatile grids that need ‘synthetic inertia’. Their key economic rationale is arbitrage. Numbers are borne out by our…
-
Coal power generation: minute-by-minute flexibility?
Coal power generation is aggregated in this data-file, at the largest single-unit coal power plant in Australia, across five-minute intervals, for the whole of 2023. The Kogan Creek coal plant produces stable baseload power, with average utilization rate of 85%. But it exhibits lower flexibility to backstop renewables than gas-fired generation.
-
Global electricity: by source, by use, by region?
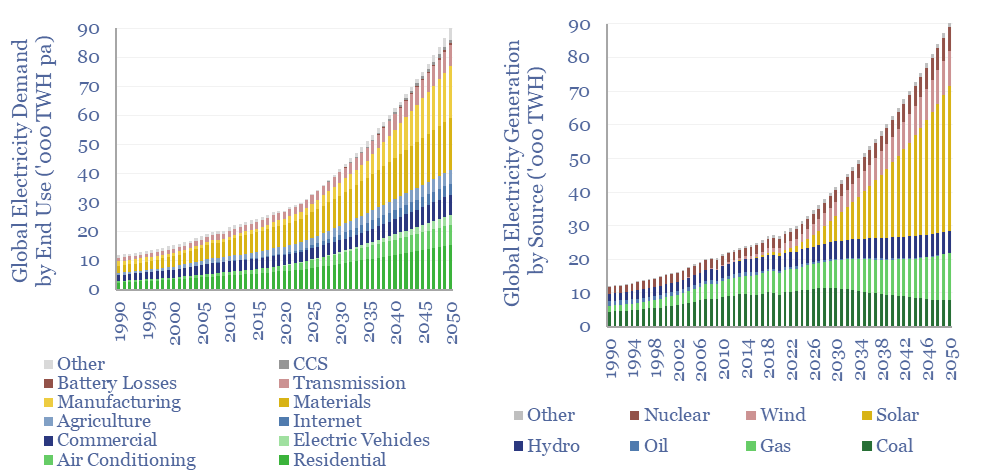
Global electricity supply-demand is disaggregated in this data-file, by source, by use, by region, from 1990 to 2050, triangulating across all of our other models in the energy transition, and culminating in over 50 fascinating charts, which can be viewed in this data-file. Global electricity demand rises 3x by 2050 in our outlook.
-
Duck curves: US power price duckiness over time?
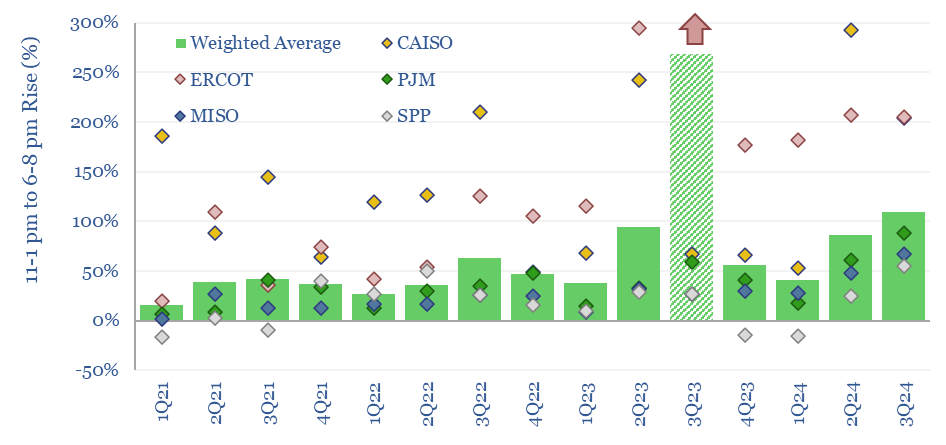
In solar-heavy grids, power prices trough around mid-day, then ramp up rapidly as the sunset. This price distribution over time is known as the duck curve. US power prices are getting 25-30% more ducky each year, based on some forms of measurement. Power prices are clearly linked to the instantaneous share of wind/solar in grids.
-
Grid-forming inverters: islands in the sun?
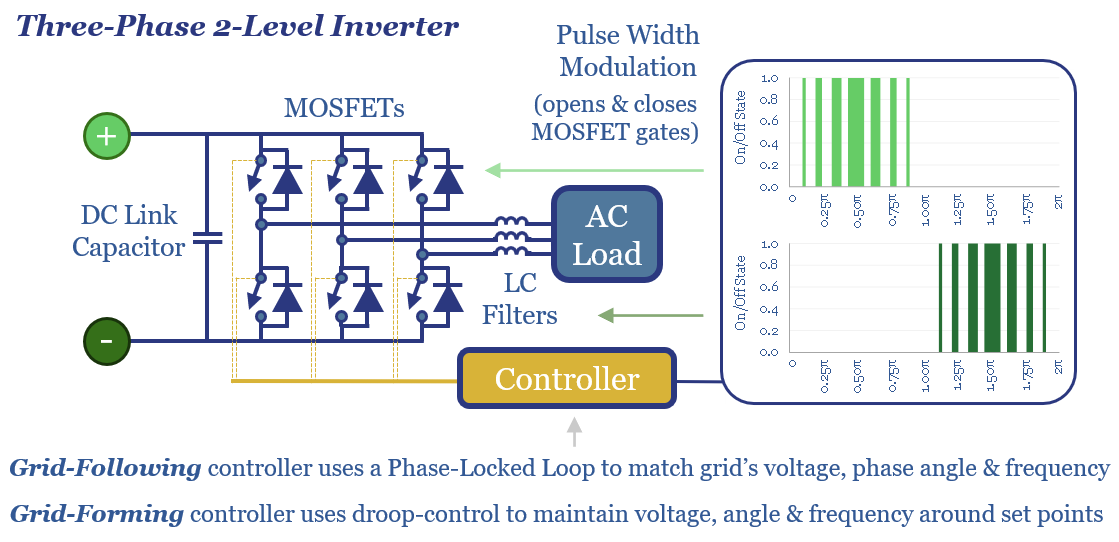
The grid-forming inverter market may soon inflect from $1bn to $15-20bn pa, to underpin most grid-scale batteries, and 20-40% of incremental solar and wind. This 11-page report finds that grid-forming inverters cost c$100/kW more than grid-following inverters, which is inflationary, but integrate more renewables, raise resiliency and efficiency?
-
eHighways: trucking by wire?
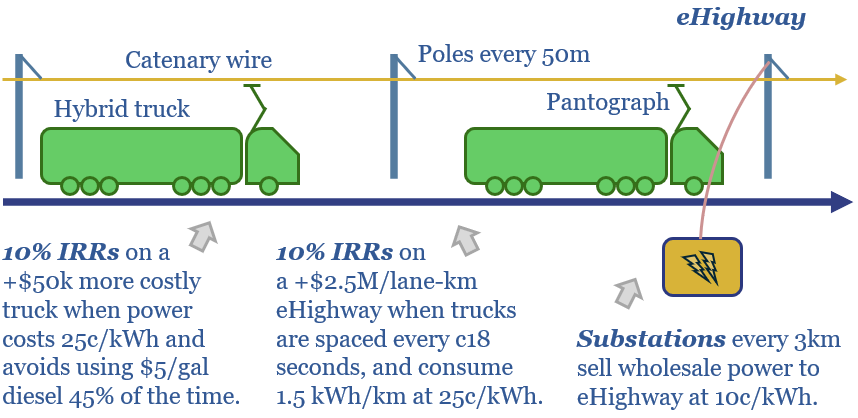
eHighways electrify heavy trucks via overhead catenary wires. They have been de-risked by half-a-dozen real-world pilots. High-utilization routes can support 10% IRRs on both road infrastructure and hybrid trucks. This 15-page report finds benefits in logistics networks and for integrating renewables?
-
Economics of flywheels: fast frequency response?
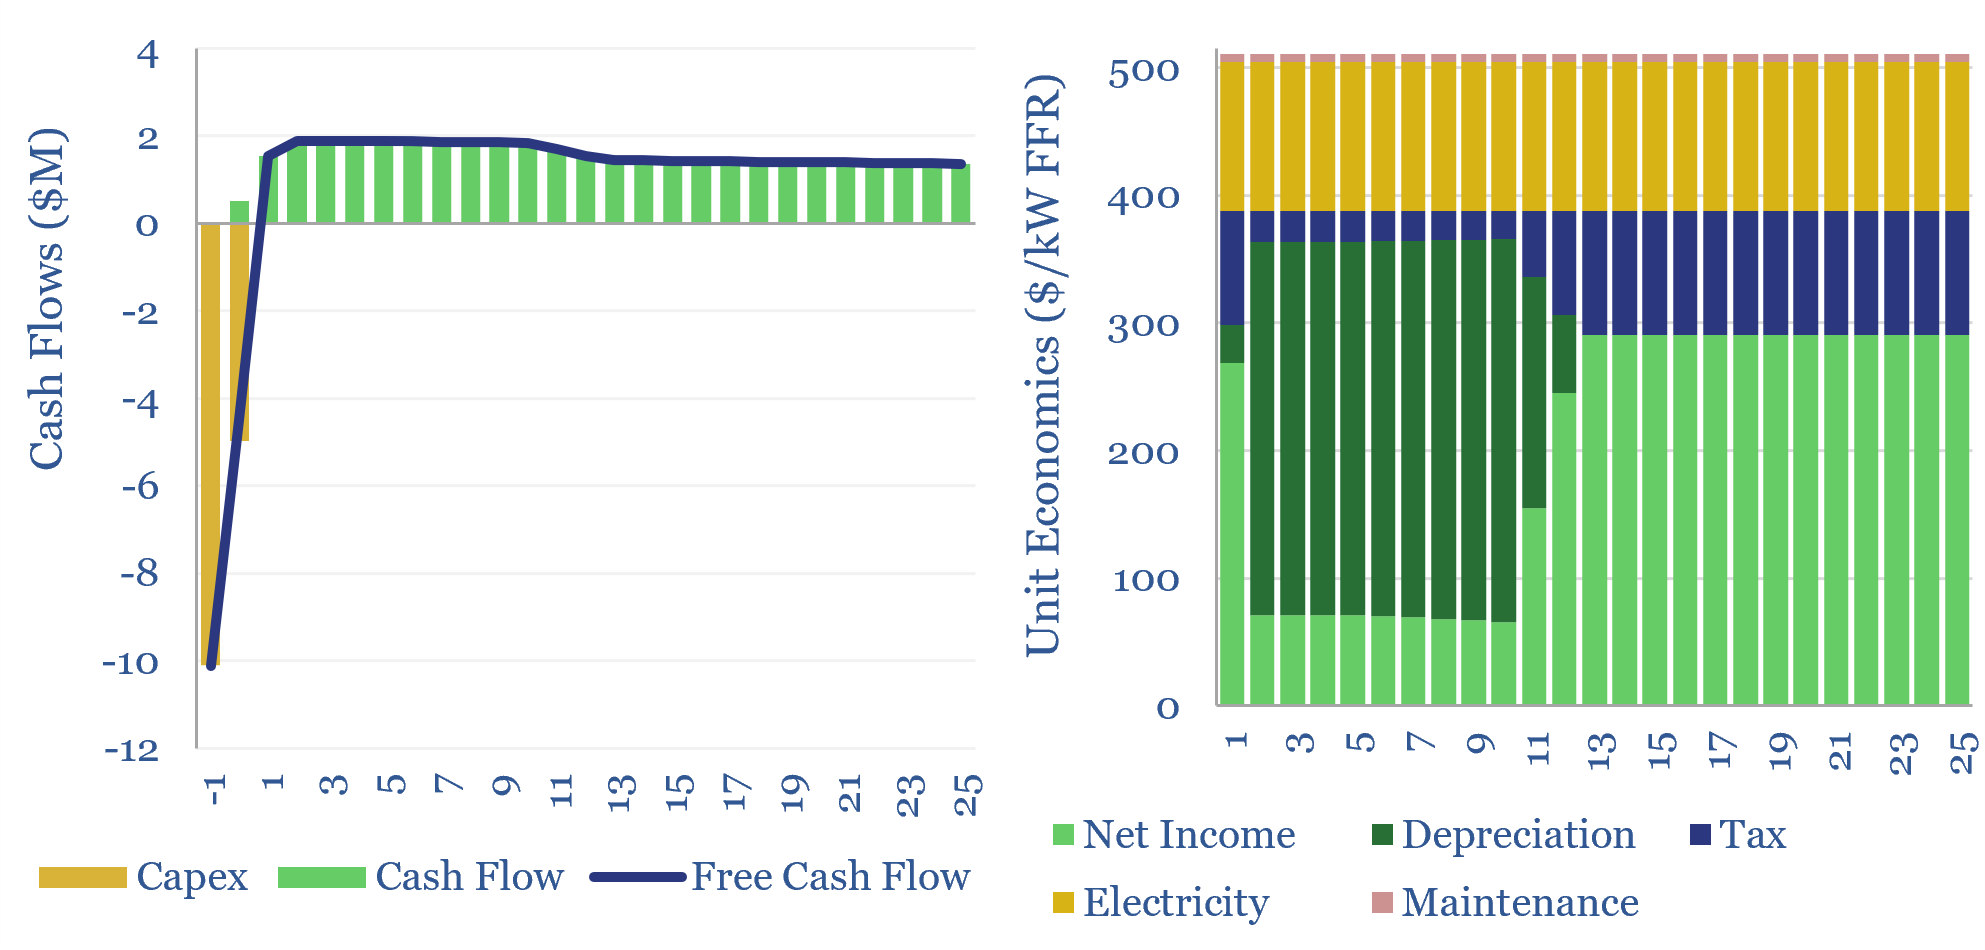
The economics of flywheels can be stress-tested in this data-file, requiring a $500/kW fee for fast-frequency response, to generate a 10% IRR on c$10,000/kWh of capex costs, on a typical flywheel plant with around 15-minutes of energy storage. The rise of renewables and AI increasingly requires adding inertia to power grids. Flywheels may be one…
Content by Category
- Batteries (89)
- Biofuels (44)
- Carbon Intensity (49)
- CCS (63)
- CO2 Removals (9)
- Coal (38)
- Company Diligence (94)
- Data Models (838)
- Decarbonization (160)
- Demand (110)
- Digital (59)
- Downstream (44)
- Economic Model (204)
- Energy Efficiency (75)
- Hydrogen (63)
- Industry Data (279)
- LNG (48)
- Materials (82)
- Metals (80)
- Midstream (43)
- Natural Gas (148)
- Nature (76)
- Nuclear (23)
- Oil (164)
- Patents (38)
- Plastics (44)
- Power Grids (130)
- Renewables (149)
- Screen (117)
- Semiconductors (32)
- Shale (51)
- Solar (68)
- Supply-Demand (45)
- Vehicles (90)
- Wind (44)
- Written Research (354)