Search results for: “climate model”
-
Global LNG supply model: by project and by country?

Global LNG output ran at 406MTpa in 2024. This model estimates global LNG production by facility across 150 LNG facilities. Our latest forecasts are that global LNG demand will rise at a 6% CAGR, to reach 710MTpa by 2035, for an absolute growth rate of +30MTpa per year, but there is a supply-crunch in 2024-26,…
-
Guyana: Economic Model
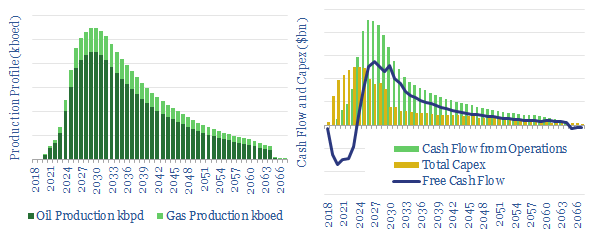
We have modeled the economics for the full development of Exxon, Hess and CNOOC-Nexen’s Stabroek block in Guyana, FPSO by FPSO. The data-file includes the field’s ultimate value, resource volumes, production volumes, cash flows, capex and per-barrel economics. Sensitivities can also modeled as a function of oil prices, WACCs and resources.
-
US shale: the economics?
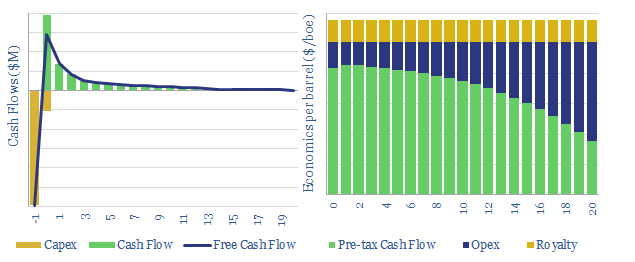
This model breaks down the economics of US shale, including a granular build-up of capex costs across 18 different categories. Our base case requires a $40/bbl oil price for a 10% IRR at a $7.0M shale well with a 1.0 kboed IP30. Economics range from $35-50/bbl. They are most sensitive to productivity.
-
Global steel supply-demand model?
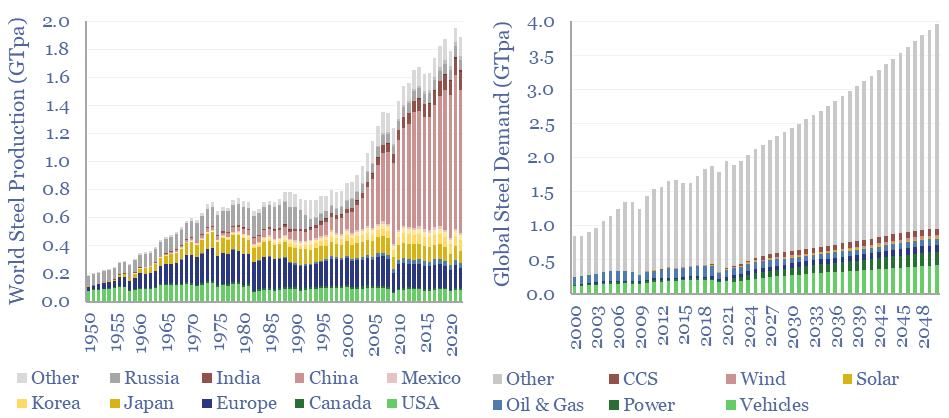
Global steel supply-demand runs at 2GTpa in 2023, having doubled since 2003. Our best estimate is that steel demand rises another 80%, to 3.6GTpa by 2050, including due to the energy transition. Global steel production by country is now dominated by China, whose output exceeds 1GTpa, which is 8x the #2 producer, India, at 125MTpa.
-
Road costs: economic model?
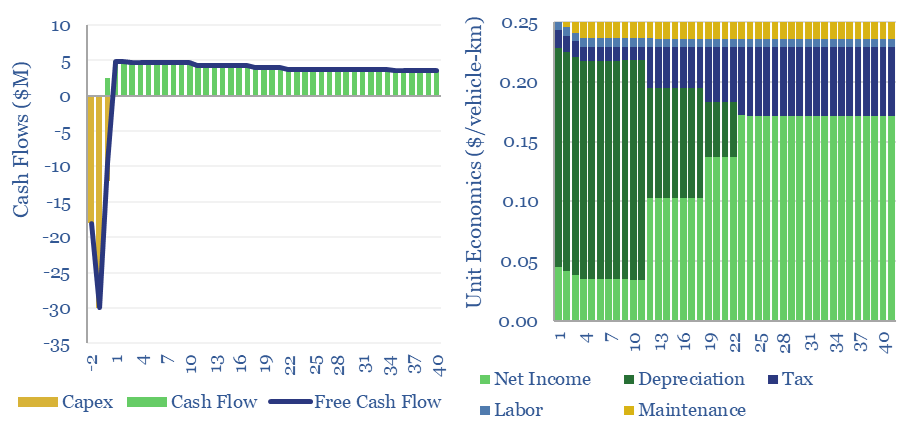
A typical road costs $3M/lane-km to construct, with an effective cost of $0.25 per vehicle-km subsequently travelled. The range varies with utilization and road complexity. Around 10% of the costs are materials, mainly aggregates, while the remainder of the capex is spent on construction and engineering.
-
Japan gas and power: supply-demand model?
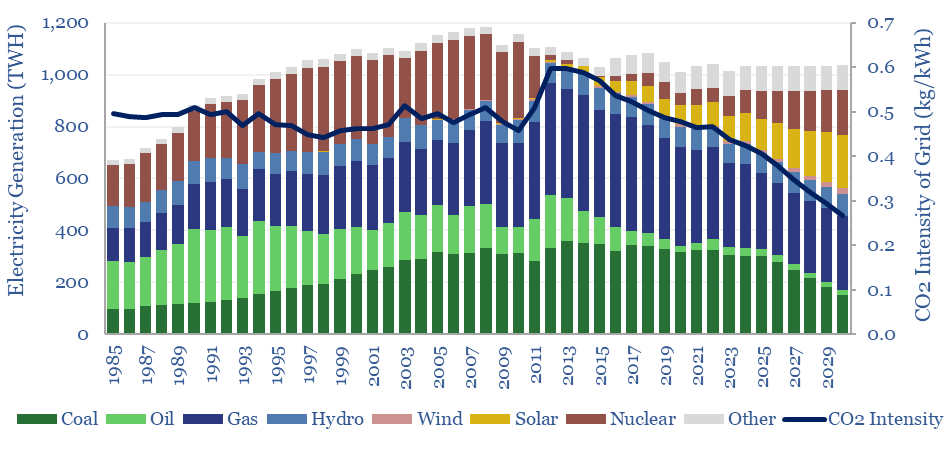
Japan’s gas and power markets are broken down by end use, traced back to 1990, and forecast forwards to 2030 in this model. Japan’s electricity demand now grows at 0.3% pa. Ramping renewables, nuclear and gas back-ups could halve Japan’s total grid CO2 intensity to below 0.25 kg/kWh by 2030.
-
Australia energy supply-demand model?
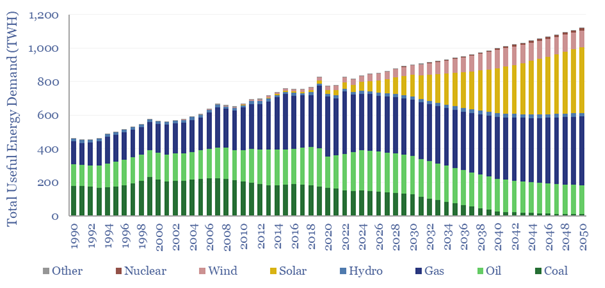
Australia’s useful energy consumption rises from 820TWH pa in 2023, by 1.2% pa 1,100 TWH pa in 2050. As a world-leader in renewables, it makes for an interesting case study. This Australia energy supply-demand model is disaggreated across 215 line items, broken down by source, by use, from 1990 to 2023, and with our forecasts…
-
Kardashev scale: a futuristic future of energy?
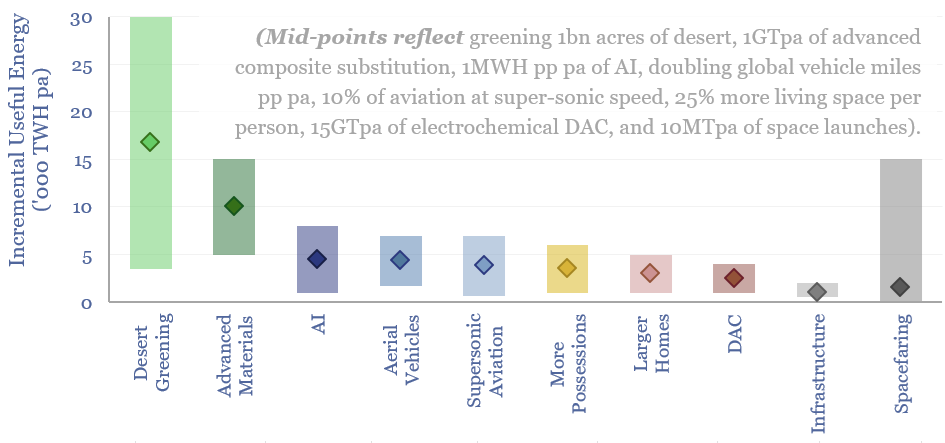
A Kardashev scale civilization uses all the energy it has available. Hence this 16-page report explores ten futuristic uses for global energy, which could absorb an additional 50,000 TWH pa by 2050 (60% upside), mainly from solar. And does this leap in human progress also allay climate concerns better than pre-existing roadmaps to net zero?
-
Development capex: long-term spending from Oil Majors?
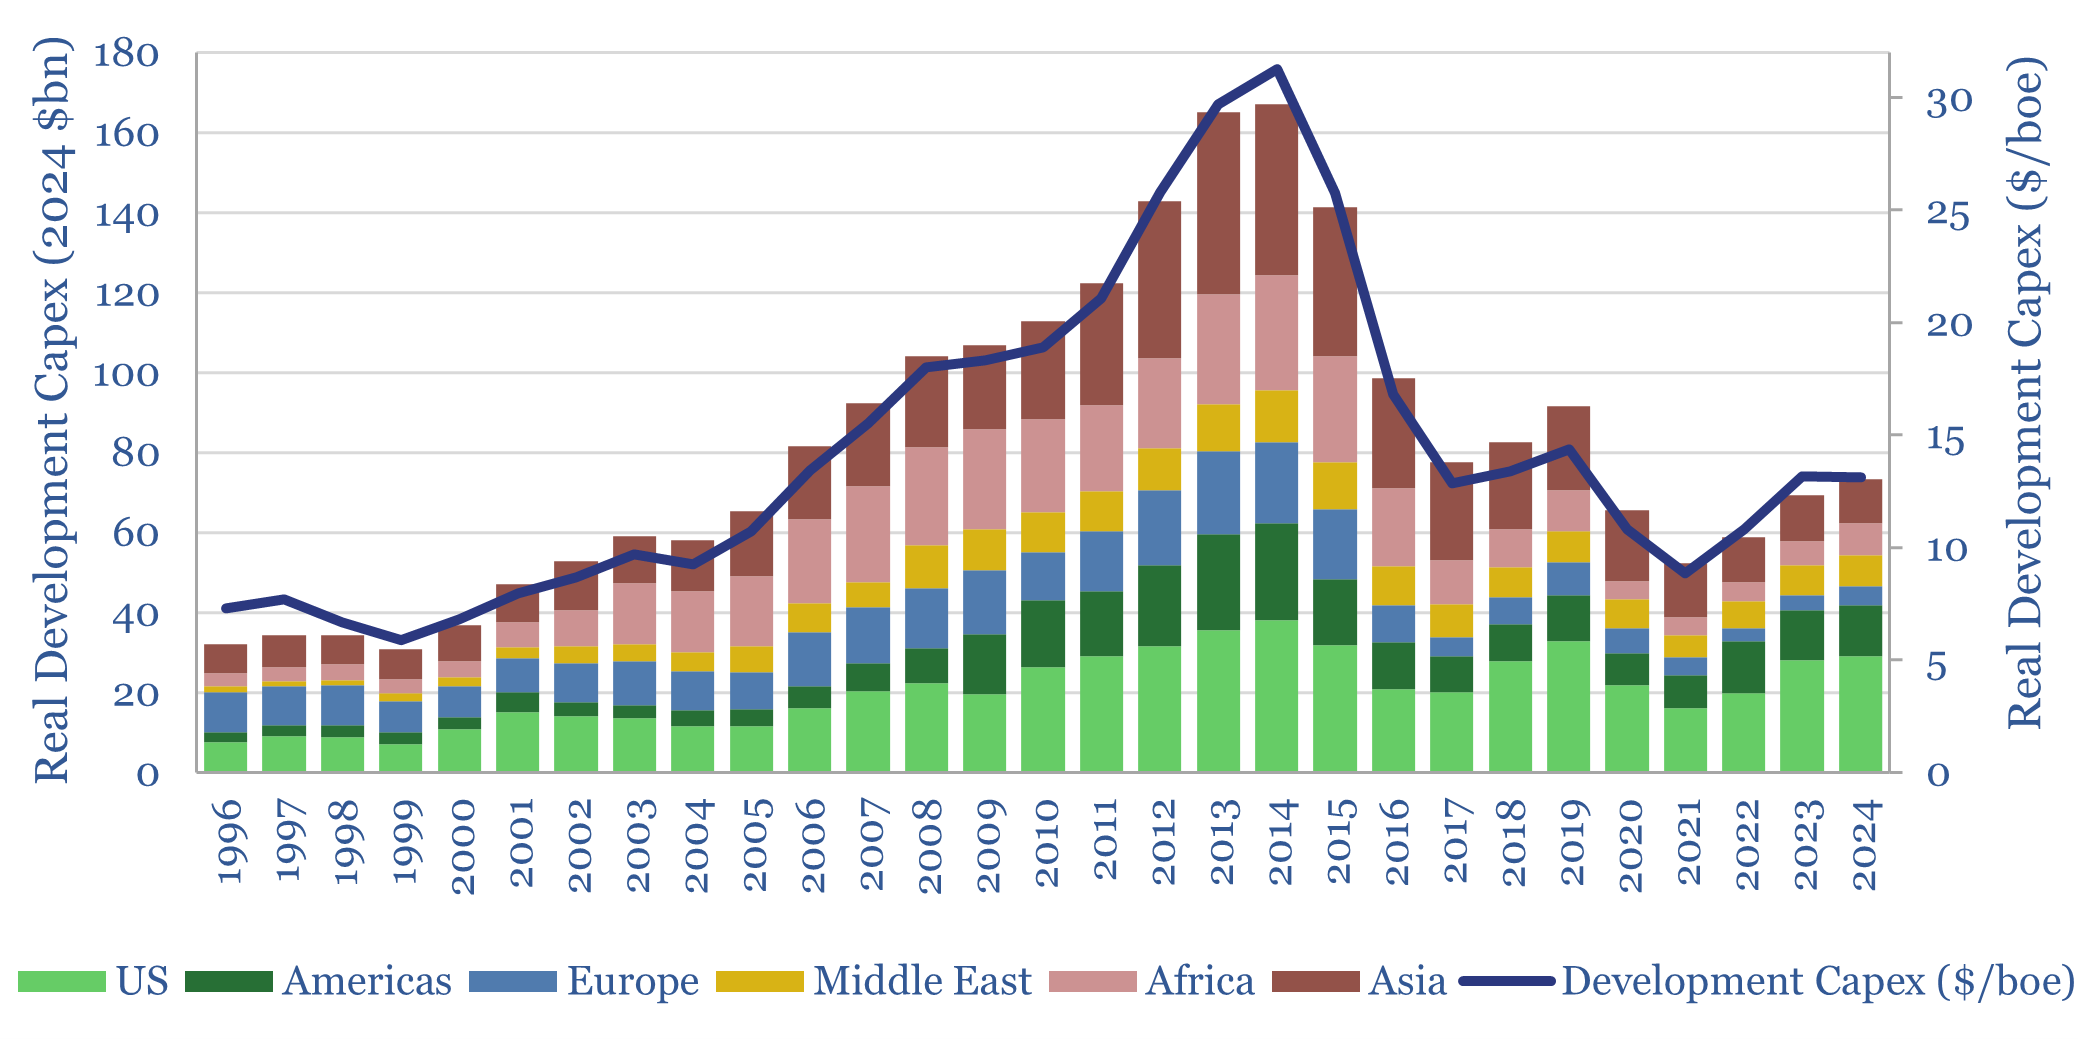
This data-file tabulates the five ‘Big Oil’ Super-Majors’ development capex from the mid-1990s, in headline terms (billions of dollars) and in per-barrel terms ($/boe of production). Real development capex quadrupled from $6/boe in 1995-2000 to $24/boe in 2010-15, collapsed to $10/boe, then recovered to $13/boe.
-
India: electricity demand and power grid over time?
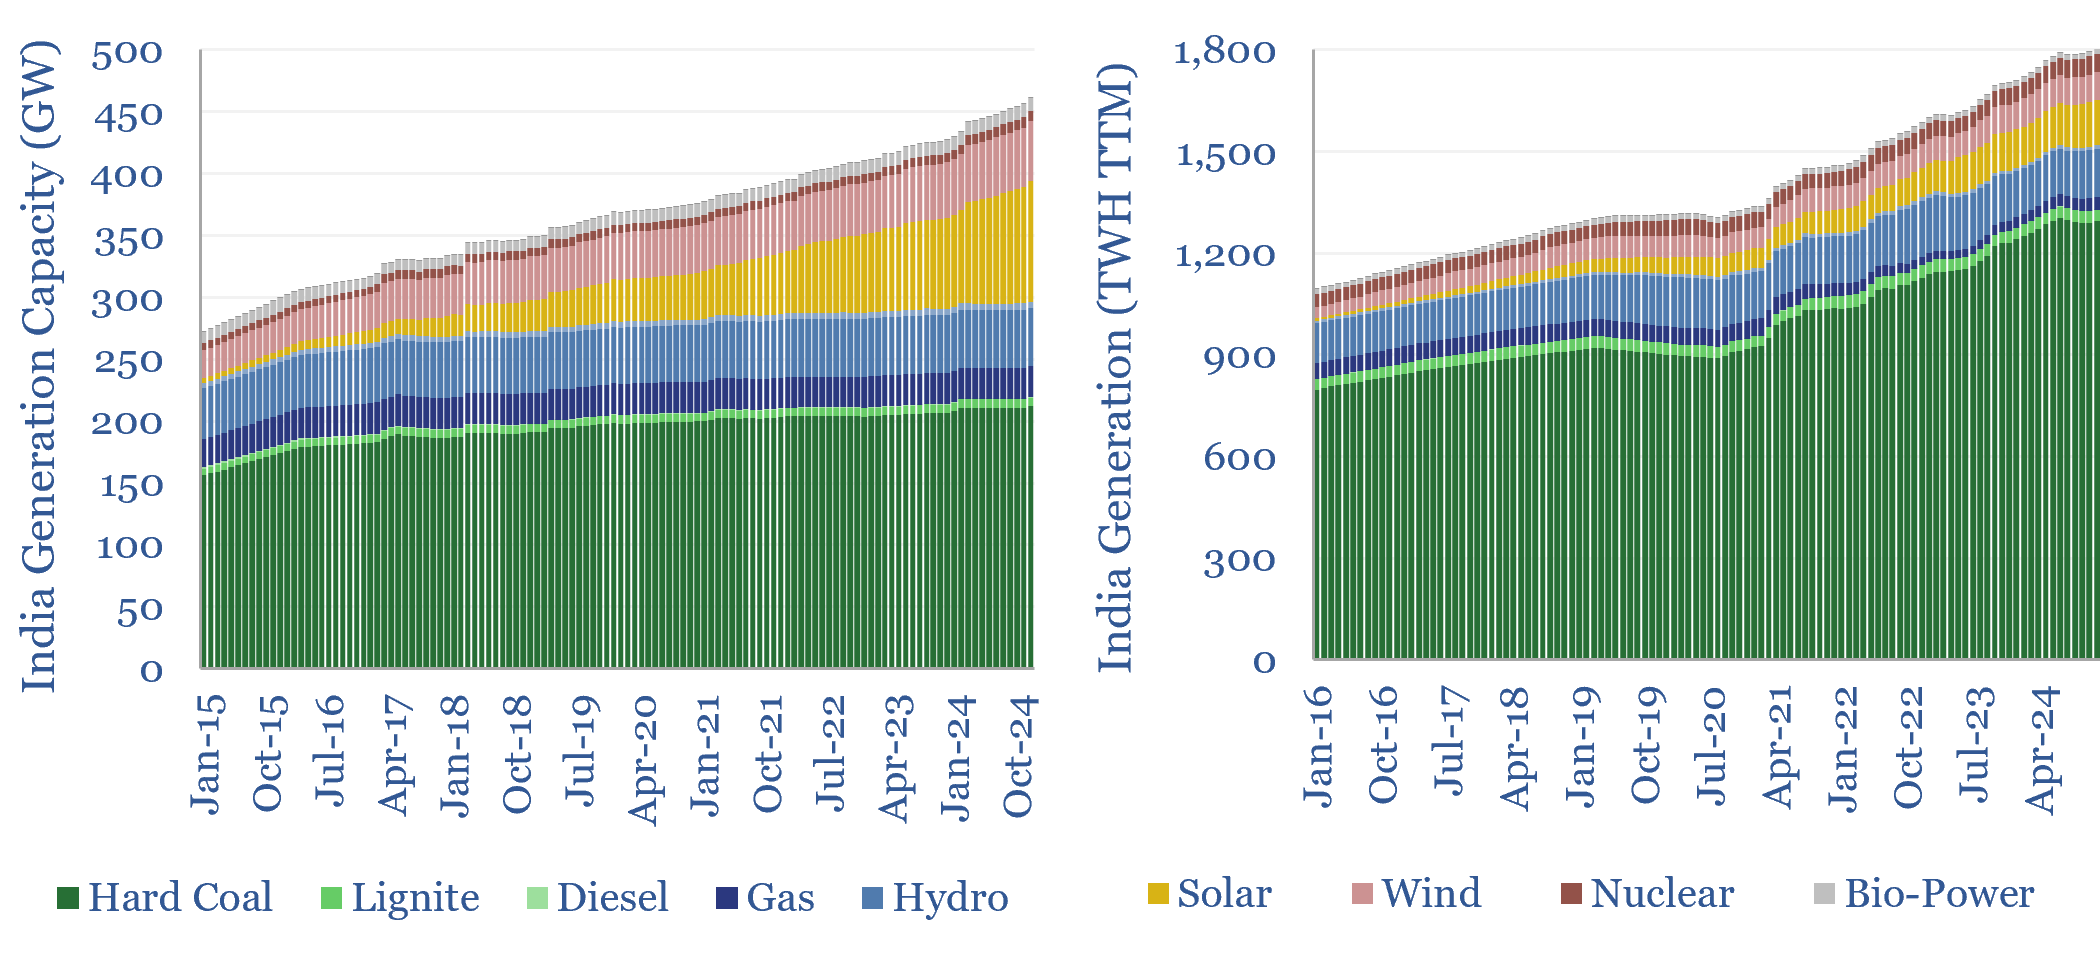
India’s electricity demand is growing by 6-8% (+100-140 TWH) per year, but 75% of the total still comes from coal, which has itself grown at a 5% CAGR over the past half-decade. Wind and solar would need to grow 4x faster than 2023 levels for thermal generation just to flatline. What implications and opportunities for…
Content by Category
- Batteries (89)
- Biofuels (44)
- Carbon Intensity (49)
- CCS (63)
- CO2 Removals (9)
- Coal (38)
- Company Diligence (95)
- Data Models (840)
- Decarbonization (160)
- Demand (110)
- Digital (60)
- Downstream (44)
- Economic Model (205)
- Energy Efficiency (75)
- Hydrogen (63)
- Industry Data (279)
- LNG (48)
- Materials (82)
- Metals (80)
- Midstream (43)
- Natural Gas (149)
- Nature (76)
- Nuclear (23)
- Oil (164)
- Patents (38)
- Plastics (44)
- Power Grids (130)
- Renewables (149)
- Screen (117)
- Semiconductors (32)
- Shale (51)
- Solar (68)
- Supply-Demand (45)
- Vehicles (90)
- Wind (44)
- Written Research (354)