Search results for: “electronic electronics”
-
Silver demand: upside and substitution?
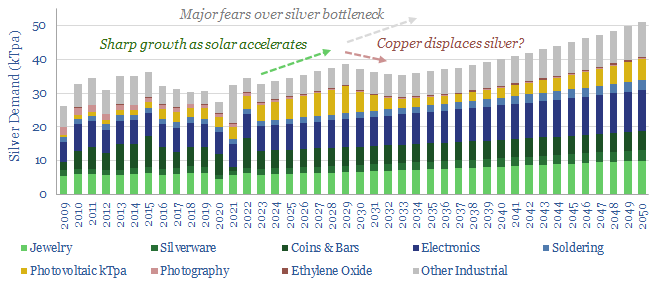
This data-file is a simple demand outlook for silver in the energy transition. Demand could rise 2.5x from 30kTpa to 85kTpa in 2050, driven by solar and electrification. Although in practice, we think a price spike will displace silver with copper.
-
Power grids: global investment?
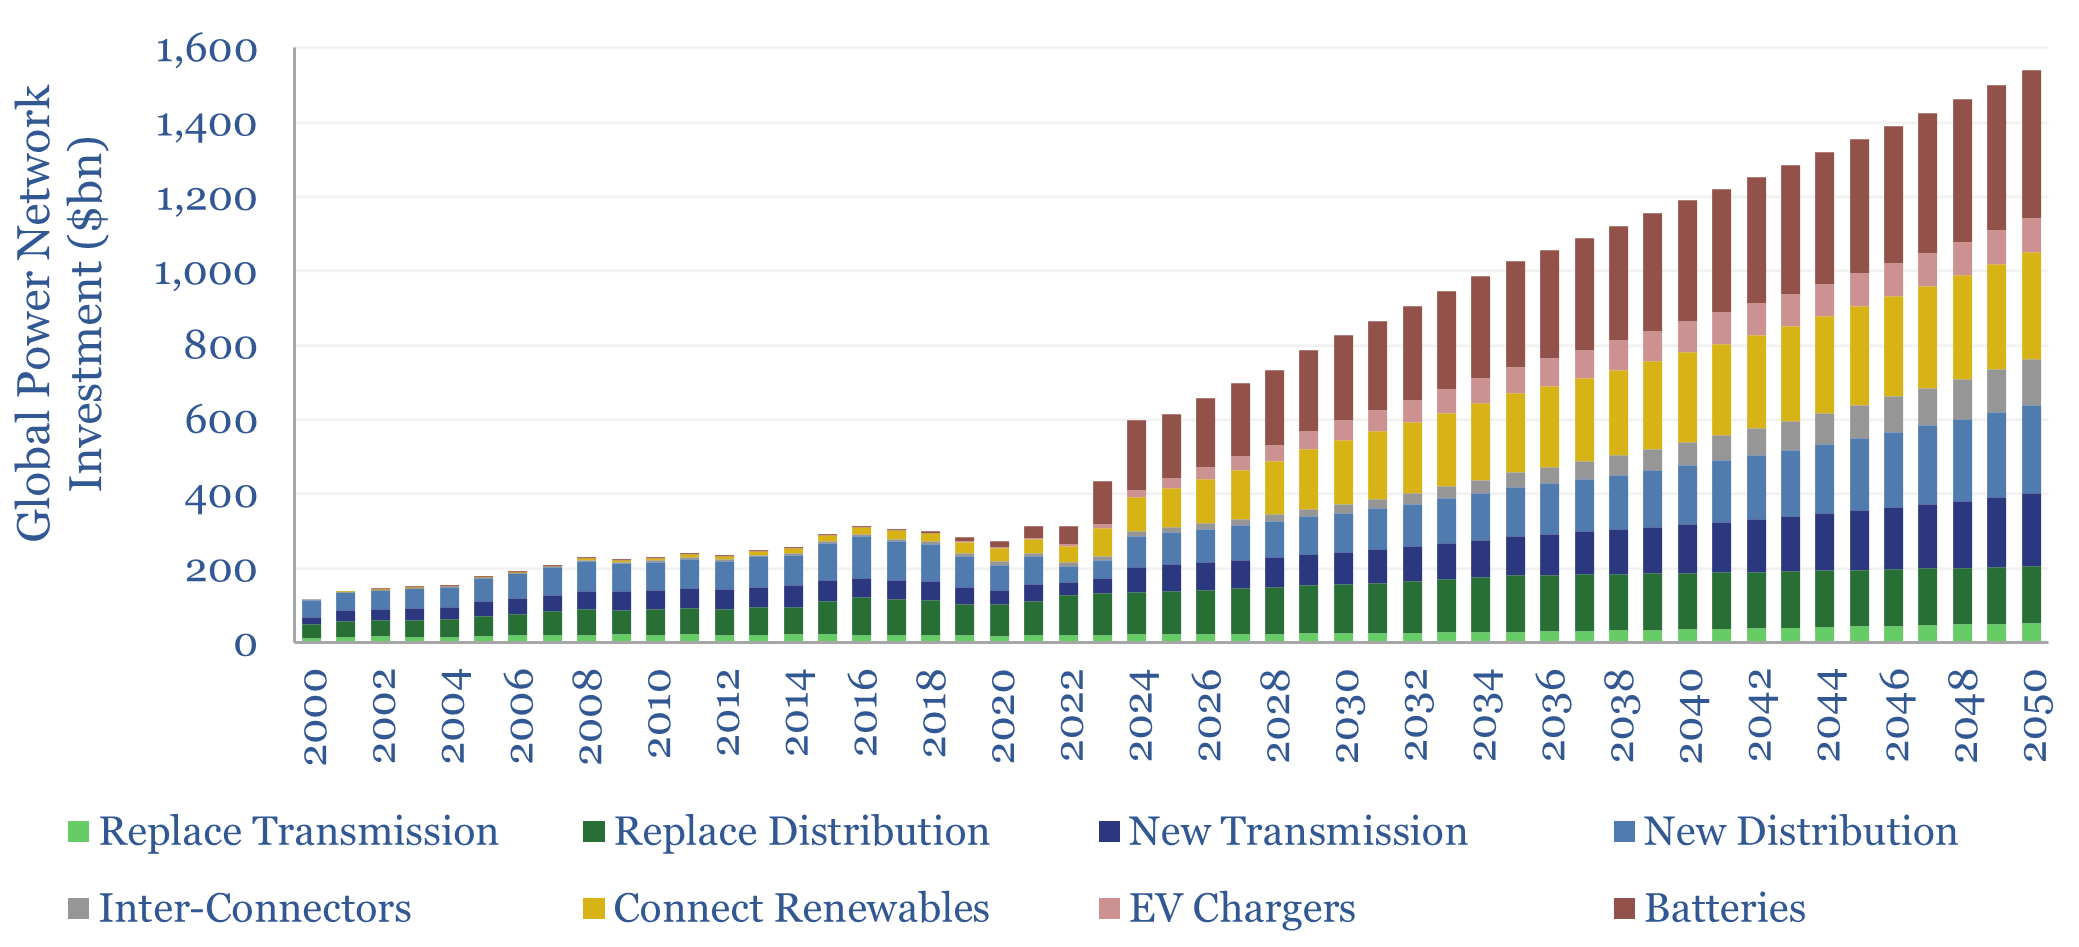
Global investment into power networks averaged $280bn per annum in 2015-20, of which two-thirds was for distribution and one-third was for transmission. Amazingly, these numbers step up to $600bn in 2030, >$1trn in the 2040s and can be as large as all primary energy investment.
-
Solar volatility: tell me lies, tell me sweet little lies?
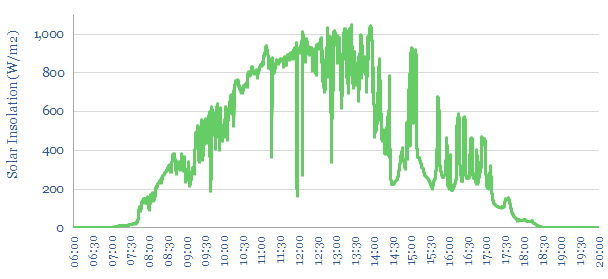
This 20-page note quantifies the statistical distribution of short-term volatility at solar power plants. Solar output typically flickers downwards by over 10%, around 100 times per day. Can industrial processes truly be ‘powered by solar’? What opportunities will arise to buffer the volatility?
-
Green hydrogen: can electrolysers run off renewables?
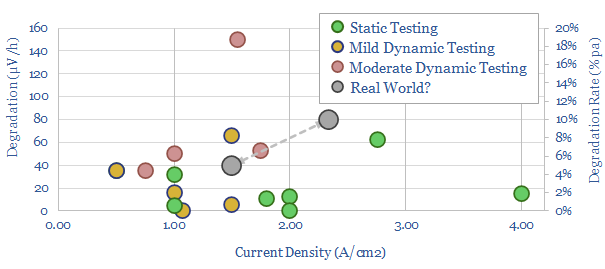
What degradation rate is expected for a green hydrogen electrolyser, if it is powered by volatile wind and solar inputs? This 15-page note reviews past projects and technical papers. 5-10% pa degradation rates would raise green hydrogen costs by $1/kg. Avoiding degradation justifies higher capex, especially on power-electronics and even batteries?
-
Battery degradation: causes, effects & implications?
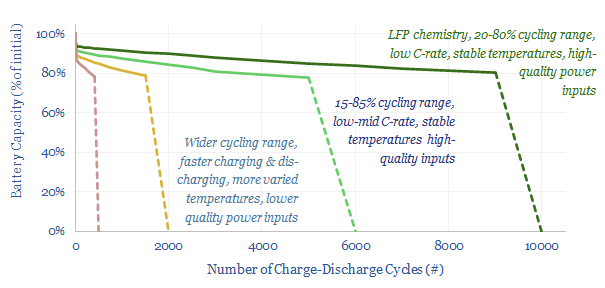
This 14-page note offers five rules of thumb to maximize the longevity of lithium-ion batteries, in grid-scale storage and electric vehicles. The data suggest hidden upside in the demand for batteries, for lithium and high-quality power electronics, especially if batteries are to backstop renewables.
-
Solar: energy payback and embedded energy?
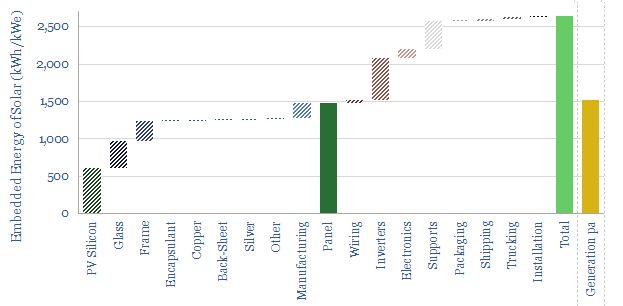
What is the energy payback and embedded energy of solar? We have aggregated the consumption of 10 different materials (in kg/kW) and around 10 other energy-consuming line-items (in kWh/kW). Our base case estimate is 2.5 MWH/kWe of solar and an energy payback of 1.5-years. Numbers and sensitivities can be stress-tested in the data-file.
-
Solar capacity: growth through 2030 and 2050?
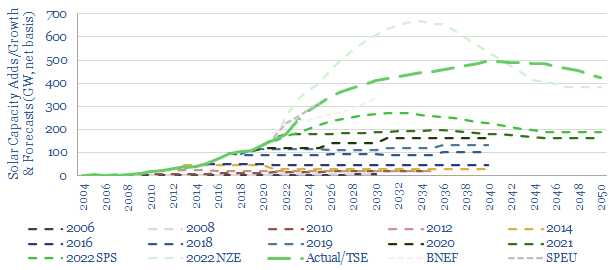
Forecasts for future solar growth have an unsatisfyingly uncertain range, varying by 3x. Hence this 15-page note discusses the future of solar. Solar capacity additions likely accelerate 3.5x by 2030 and 5x by 2040. But this creates bottlenecks, including for seven materials; and requires >$1trn pa of additional power grid capex plus $1trn pa of…
-
Electrification: the rings of power?
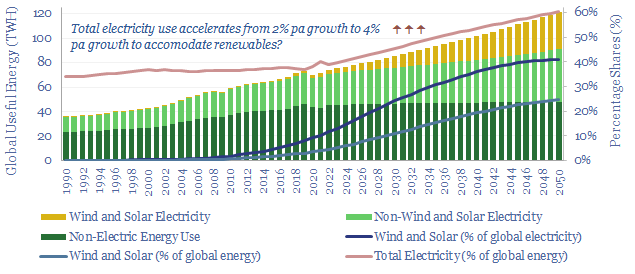
Electrification is the largest, most overlooked, most misunderstood part of the energy transition. Hence this 10-page note aims to explain the upside, simply and clearly. Electricity rises from 40% of total useful energy today to 60% by 2050. Within the next decade, this adds $2trn to the enterprise value of capital goods companies in power…
-
Offshore wind: installation vessels and time per turbine?
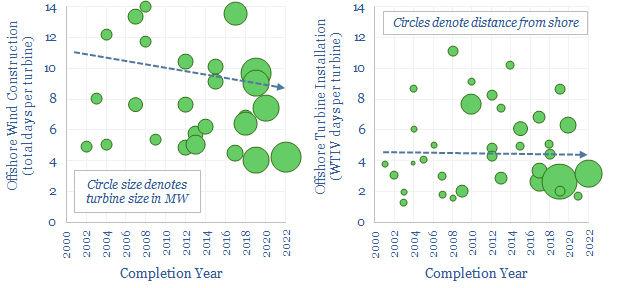
Wind turbine installation vessels are estimated to cost $100-500/kW in the breakdown of a typical offshore wind project’s capex. Total offshore construction time is around 10 days per turbine. Wind turbine installation vessel use averages around 5 days per turbine. Data from past projects are tabulated in this data-file.
-
Goldwind: frequency response from wind turbines?
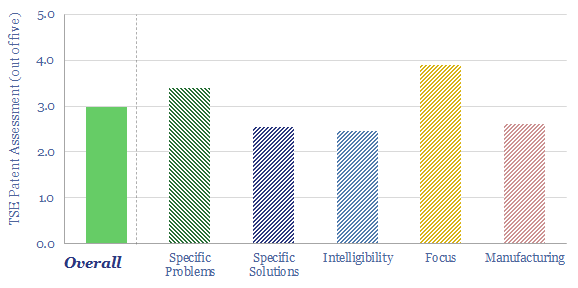
Goldwind is one of the largest wind turbine manufacturers in the world, headquartered in Beijing, and shares are publicly listed. The wind industry is increasingly aiming to mimic the inertia and frequency responses of synchronous power generators. Goldwind has published some interesting case studies. Hence we have reviewed its patents to see if we can…
Content by Category
- Batteries (89)
- Biofuels (44)
- Carbon Intensity (49)
- CCS (63)
- CO2 Removals (9)
- Coal (38)
- Company Diligence (94)
- Data Models (838)
- Decarbonization (160)
- Demand (110)
- Digital (59)
- Downstream (44)
- Economic Model (204)
- Energy Efficiency (75)
- Hydrogen (63)
- Industry Data (279)
- LNG (48)
- Materials (82)
- Metals (80)
- Midstream (43)
- Natural Gas (148)
- Nature (76)
- Nuclear (23)
- Oil (164)
- Patents (38)
- Plastics (44)
- Power Grids (130)
- Renewables (149)
- Screen (117)
- Semiconductors (32)
- Shale (51)
- Solar (68)
- Supply-Demand (45)
- Vehicles (90)
- Wind (44)
- Written Research (354)