Search results for: “gas”
-
Japan oil demand: breakdown over time?
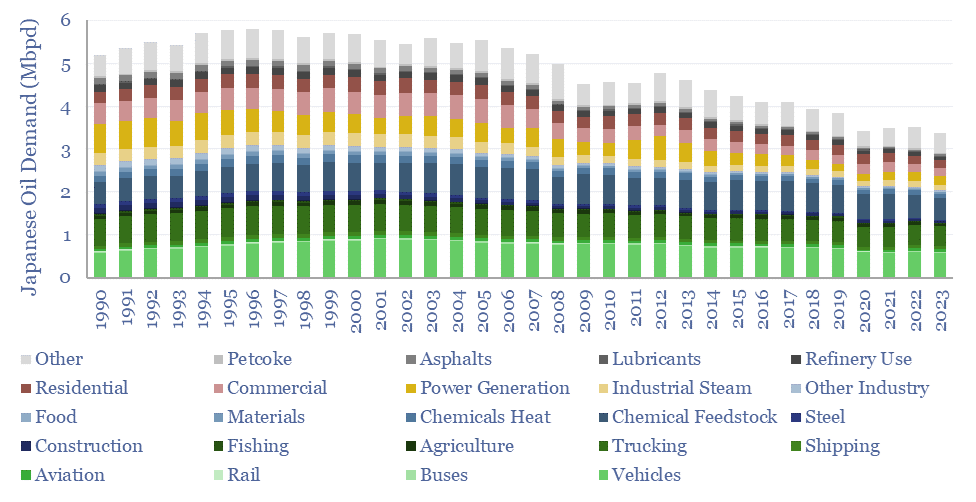
Japan’s oil demand peaked at 5.8Mbpd in 1996, and has since declined at -2.0% per year to 3.4Mbpd in 2023. To some, this trajectory may be a harbinger of events to come in broader global oil markets? While to others, Japan has unique features that do not generalize globally? Hence this report and data-file…
-
Peaker plants: finding the balance?
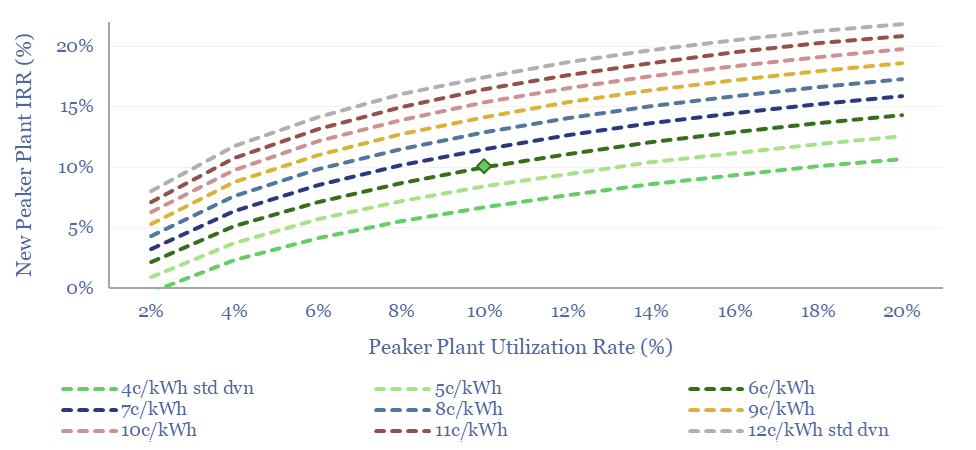
Today’s power grids fire up peaker plants to meet peak demand. But the grid is changing rapidly. Hence this 17-page report outlines the economics of gas peaker plants. Rising volatility will increase earnings and returns by 40-50%, before grid-scale batteries come into the money for peaking?
-
Global power price volatility tracker?
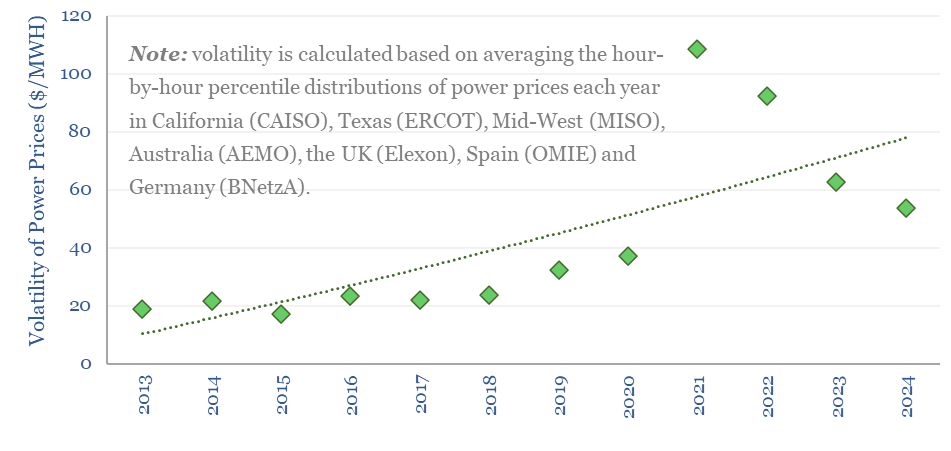
The volatility of power grids has doubled over the past decade from 2013-2024. This data-file tracks the percentile-by-percentile distributions of power prices, each year, in seven major grid regions (Texas, California, US MidWest, Australia, the UK, Germany, and Spain), as a way of tracking increases in global power price volatility. The growing volatility of power…
-
Electric vehicle cost breakdown by component?
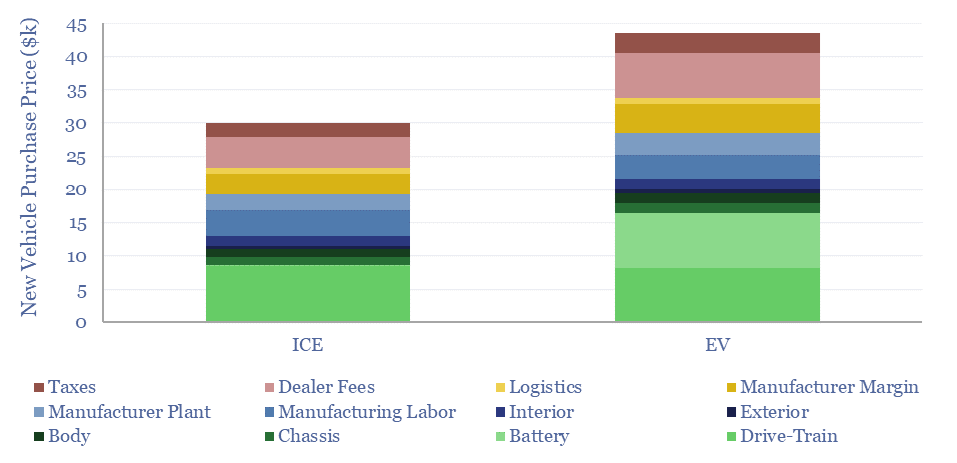
This data-file disaggregates the $30k total cost of a typical new ICE and the c$45k total cost of a typical new EV, as a sum-of-the-parts, across 25 cost lines. Drivetrain costs are similar at $8-9k each. The key challenge for the EV is the battery. The electric vehicle cost breakdown shows promise for improving power…
-
Air Products: ammonia cracking technology?
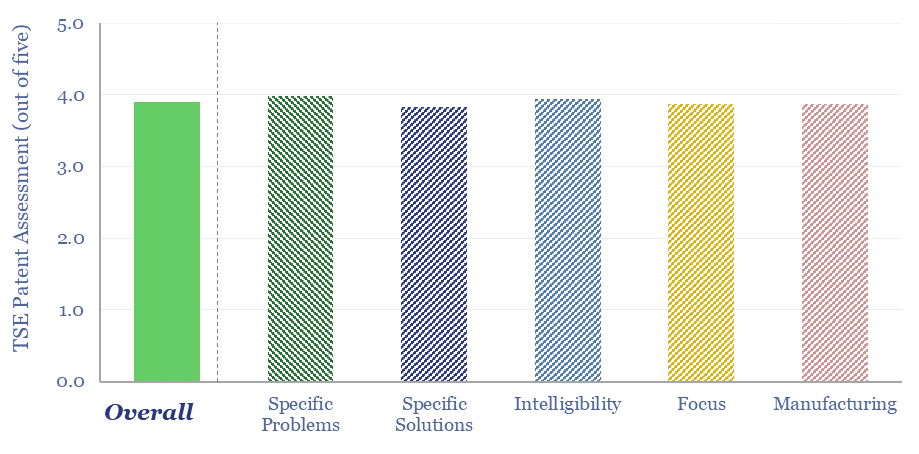
Can we de-risk Air Products’s ammonia cracking technology in our roadmaps to net zero, which is crucial to recovering green hydrogen in regions that import green ammonia from projects such as Saudi Arabia’s NEOM. We find strong IP in Air Products’s patents. However, we still see 15-35% energy penalties and $2-3/kg of costs in ammonia…
-
Global uranium supply-demand?
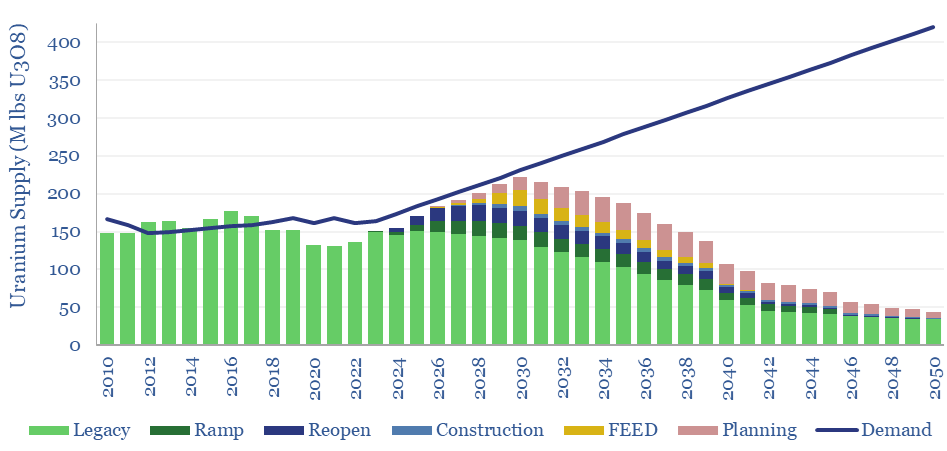
Our global uranium supply-demand model sees the market 5% under-supplied through 2030, including 7% market deficits at peak in 2025, as demand ramps from 165M lbs pa to 230M lbs pa in 2030. This is even after generous risking and no room for disruptions. What implications for broader power markets, decarbonization ambitions, and uranium prices?
-
Decarbonize shipping: alternative fuel costs?
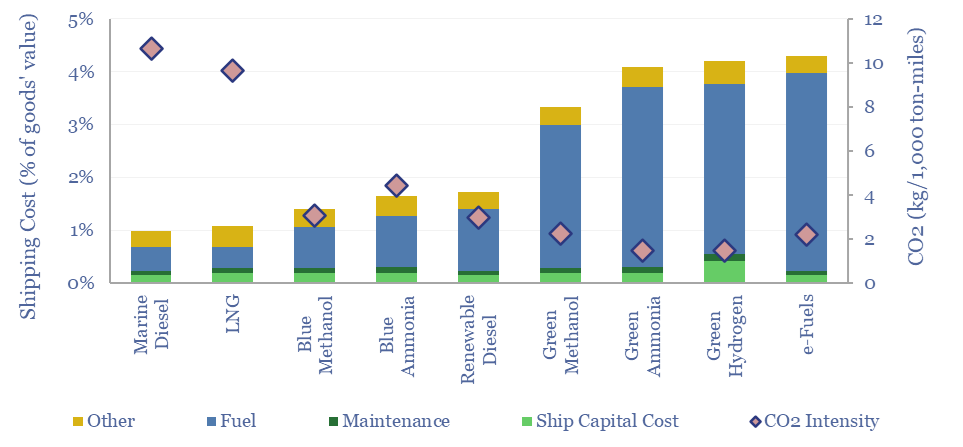
This data-file screens the costs of alternative shipping fuels, such as LNG, blue methanol, blue ammonia, renewable diesel, green methanol, green ammonia, hydrogen and e-fuels versus marine diesel. Shipping costs rise between 10% to 3x, inflating the ultimate costs of products by 0.1-30%, for CO2 abatement costs of $130-1,000/ton. We still prefer CO2 removals.
-
Duck curves: US power price duckiness over time?
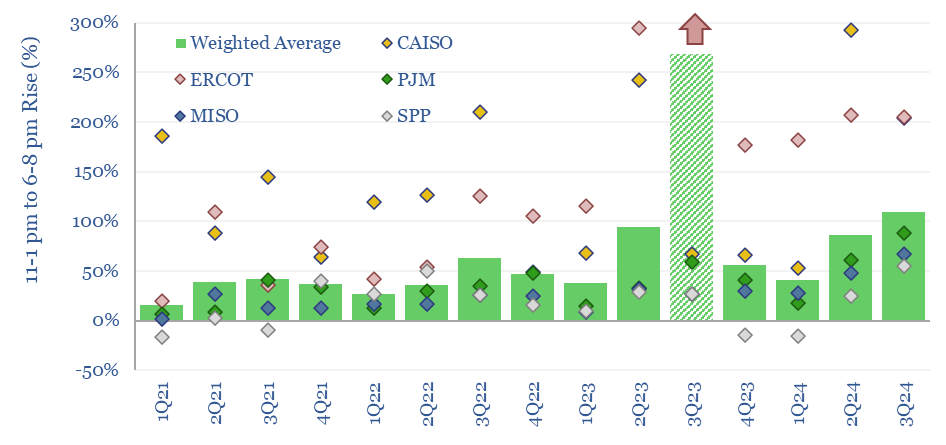
In solar-heavy grids, power prices trough around mid-day, then ramp up rapidly as the sunset. This price distribution over time is known as the duck curve. US power prices are getting 25-30% more ducky each year, based on some forms of measurement. Power prices are clearly linked to the instantaneous share of wind/solar in grids.
-
China coal production costs?
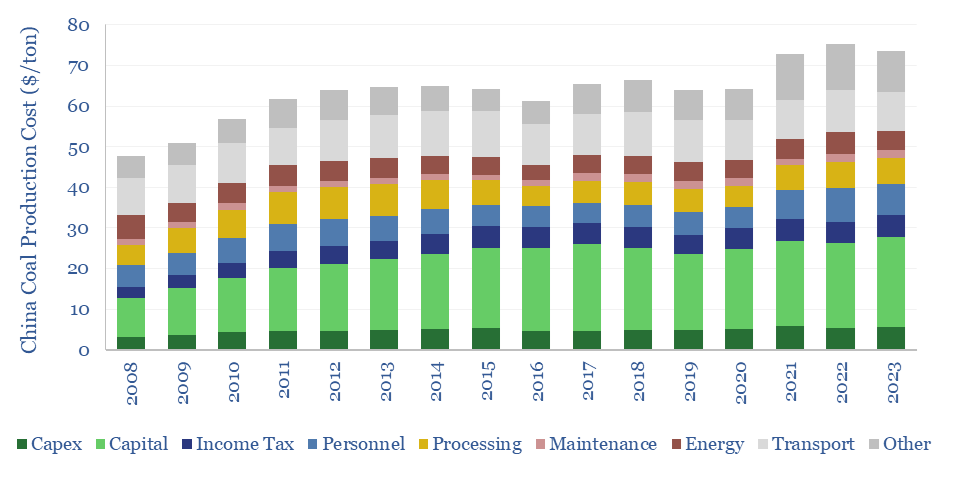
China coal production costs are estimated on a full-cycle basis in this data-file, averaging $75/ton across large listed miners, with assets in Shanxi, Inner Mongolia and Shaanxi. The costs are increasing at $1.3/ton/year, as mines move deeper and into smaller seams. Smaller regional have 1.5-2x higher costs again, and will hit LNG price parity around…
-
LNG plant compressors: chilling goes electric?
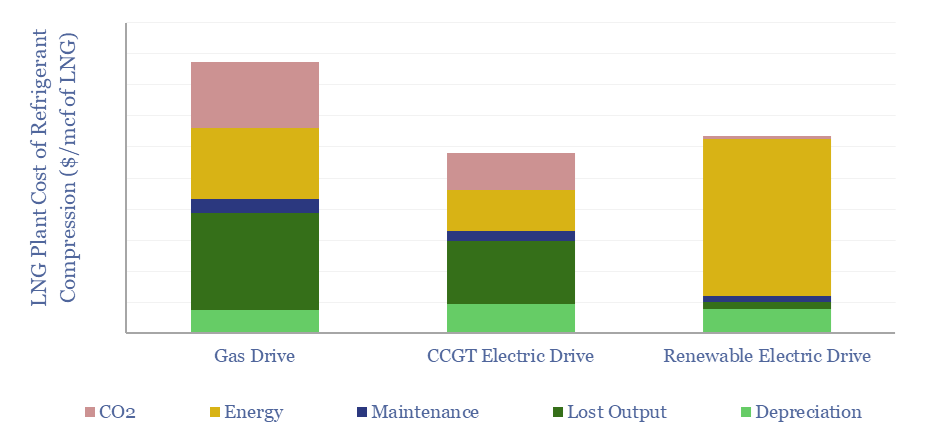
Electric motors were selected, in lieu of industry-standard gas turbines, to power the main refrigeration compressors at three of the four new LNG projects that took FID in 2024. Hence is a major change underway in the LNG industry? This 13-page report covers the costs of e-LNG, advantages and challanges, and who benfits from shifting…
Content by Category
- Batteries (89)
- Biofuels (44)
- Carbon Intensity (49)
- CCS (63)
- CO2 Removals (9)
- Coal (38)
- Company Diligence (95)
- Data Models (840)
- Decarbonization (160)
- Demand (110)
- Digital (60)
- Downstream (44)
- Economic Model (205)
- Energy Efficiency (75)
- Hydrogen (63)
- Industry Data (279)
- LNG (48)
- Materials (82)
- Metals (80)
- Midstream (43)
- Natural Gas (149)
- Nature (76)
- Nuclear (23)
- Oil (164)
- Patents (38)
- Plastics (44)
- Power Grids (130)
- Renewables (149)
- Screen (117)
- Semiconductors (32)
- Shale (51)
- Solar (68)
- Supply-Demand (45)
- Vehicles (90)
- Wind (44)
- Written Research (355)