Search results for: “power electronics”
-
California power generation over time?
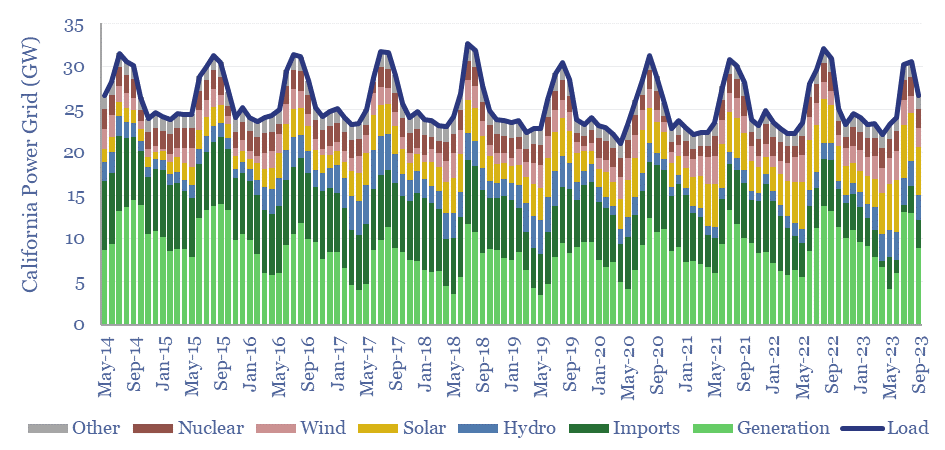
California’s power grid ranges from 26-61GW of demand. Utility scale solar has almost quadrupled in the past decade, rising from 5% to almost 20% of the grid. Yet it has not displaced thermal generation, which rose from 28% to 36% of the grid. We even wonder whether wind and solar are entrenching natural gas generators…
-
Gas power generation across five-minute intervals?
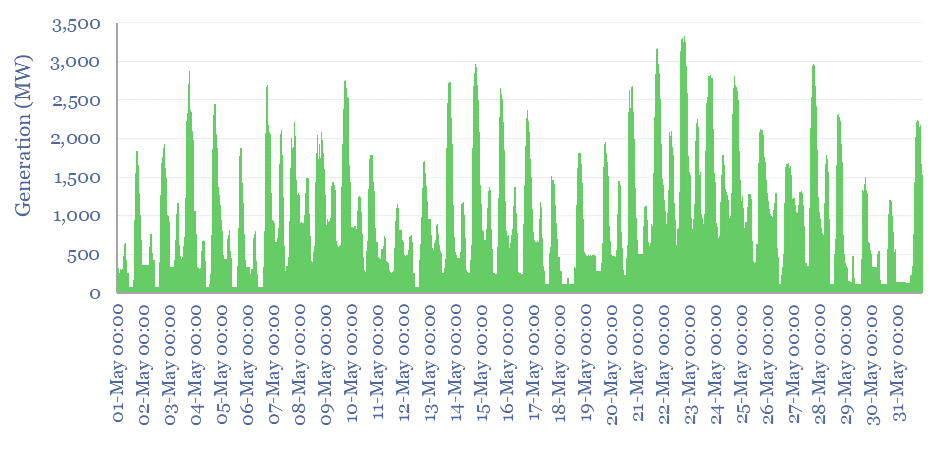
Power generation data are aggregated for ten of the largest CCGTs and gas peaker plants in Australia, across five-minute intervals, May-2024 and May-2014. This makes for a fascinating case study into how gas turbines are used to stabilize power grids, backstop renewables, and how this has changed over time.
-
Hydro power: generation by facility, availability over time?
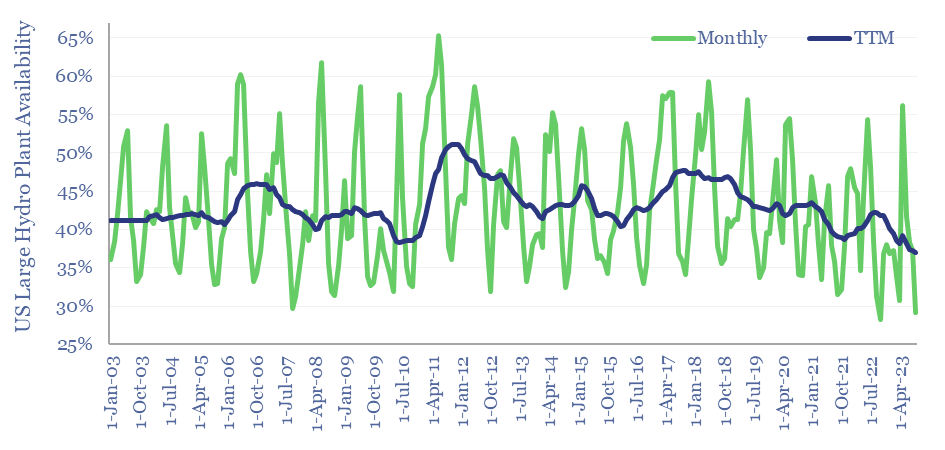
Hydro power generation by facility is tabulated in this data-file for the 20 largest hydro-electric plants in the US. The average facility achieves 43% availability, varying from 39% in hot-dry years to 51% in wet years; and from 33% at the seasonal trough in September-October to 53% at the seasonal peak in May-June. What implications…
-
Coal power generation: minute-by-minute flexibility?
Coal power generation is aggregated in this data-file, at the largest single-unit coal power plant in Australia, across five-minute intervals, for the whole of 2023. The Kogan Creek coal plant produces stable baseload power, with average utilization rate of 85%. But it exhibits lower flexibility to backstop renewables than gas-fired generation.
-
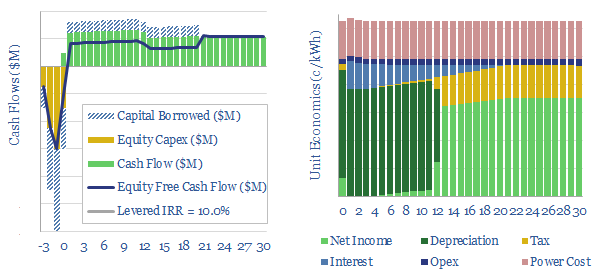
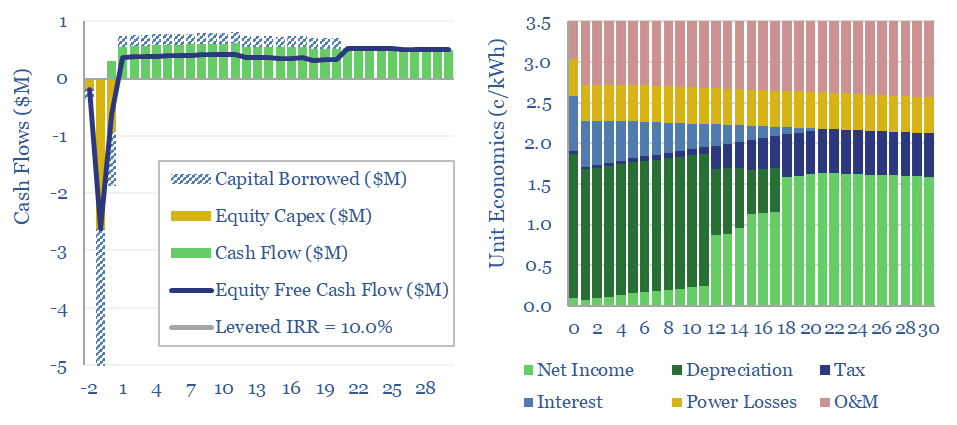
Nuclear Power Project Economics
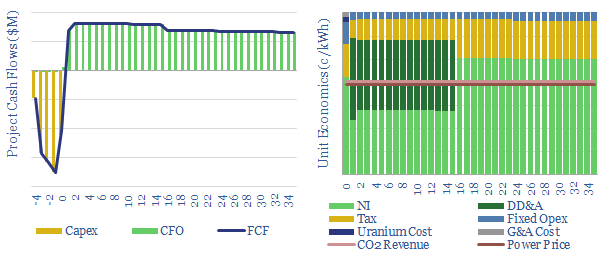
This data-file models the costs of nuclear power project, based on technical papers and past projects around the industry. An up-front capex cost of $6,000/kW might yield a levelized cost of 15c/kWh. But 6-10c/kWh is achievable via a renaissnace in next-generation nuclear.
-
HVDC power transmission: the economics?
This model captures the economics of transporting electricity (e.g., wind and solar), over vast distances, using high voltage direct current power cables (HVDCs). Our base case shows a 3-10c/kWh transportation spread is required to earn a 10% levered IRR on 1,000-mile cable.
-
High voltage transmission cables: power parameters?
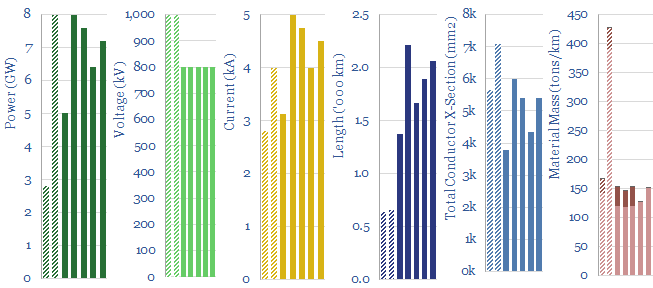
This data-file aggregates technical parameters of ultra high-voltage power lines. The average one transmits 6.5GW, at 800-1,000kV and 4,000 Amps, over a distance of 1,500 km. Every 500 meters, there is a 70m tall tower. The power lines have total mass of 200 tons/km, 2-3% losses per 1,000km and c$3M/mile costs.
-
Prime movers: efficiency of power generation over time?
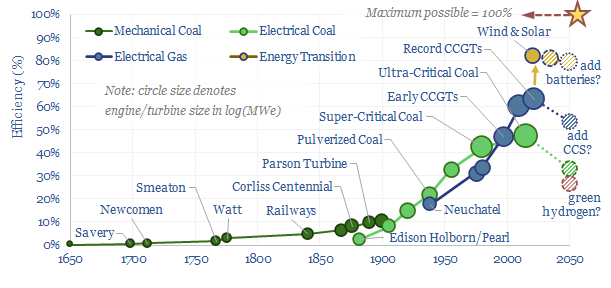
How has the efficiency of prime movers increased across industrial history? This data-file profiles the continued progress in the efficiency of power generation over time, from 1650 to 2050e. As a rule of thumb, the energy system has shifted to become ever more efficient over the past 400-years.
-
Plug power: green hydrogen breakthroughs?
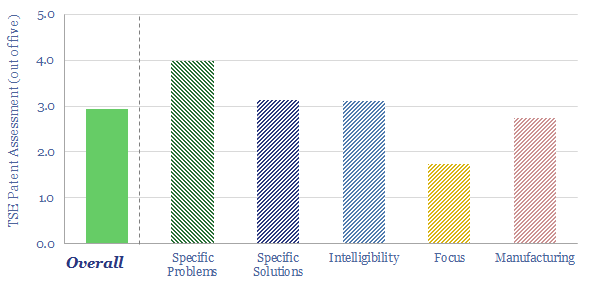
Our Plug Power technology review is drawn from the company’s recent patent filings, which offer some of the most detailed disclosures we have ever seen into the manufacturing of PEM electrolysers and fuel cells, underlying catalyst materials, membranes and their manufacturing. One patent seems like a breakthrough. Other patents candidly presented challenges.
-
Power distribution: the economics?
Power distribution costs to residential, commercial and industrial consumers are estimated at 3.5 c/kWh in this model, to generate a 10% levered return, in a 5km x 10MW distribution line, at 17kV, rated up to 400A, with a capex cost of $150/kW-km, a 5% line loss and 40% annualized utilization. All of these inputs can…
Content by Category
- Batteries (87)
- Biofuels (42)
- Carbon Intensity (49)
- CCS (63)
- CO2 Removals (9)
- Coal (38)
- Company Diligence (92)
- Data Models (823)
- Decarbonization (159)
- Demand (110)
- Digital (58)
- Downstream (44)
- Economic Model (200)
- Energy Efficiency (75)
- Hydrogen (63)
- Industry Data (276)
- LNG (48)
- Materials (81)
- Metals (75)
- Midstream (43)
- Natural Gas (146)
- Nature (76)
- Nuclear (23)
- Oil (163)
- Patents (38)
- Plastics (44)
- Power Grids (124)
- Renewables (149)
- Screen (112)
- Semiconductors (30)
- Shale (51)
- Solar (67)
- Supply-Demand (45)
- Vehicles (90)
- Wind (43)
- Written Research (347)