Search results for: “power factor”
-
Power grids: opportunities in the energy transition?
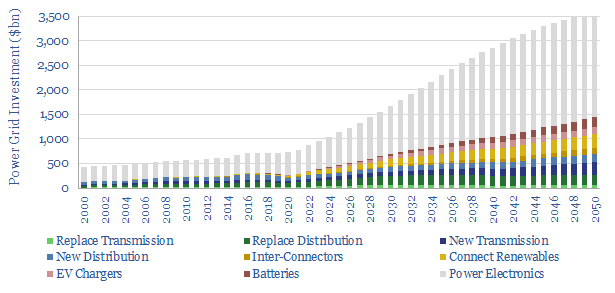
Power grids move electricity from the point of generation to the point of use, while aiming to maximize the power quality, minimize costs and minimize losses. Broadly defined, global power grids and power electronics investment must step up 5x in the energy transition, from a $750bn pa market to over $3.5trn pa. But this theme…
-
Capacitor banks: raising power factors?
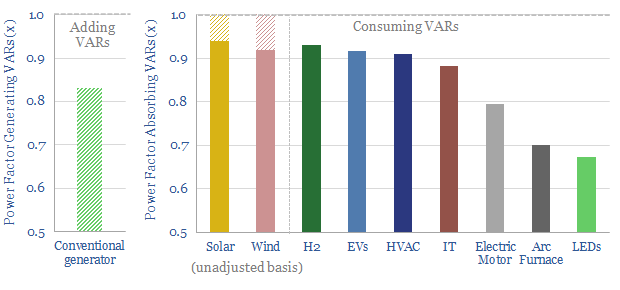
Power factor corrections could save 0.5% of global electricity, with $20/ton CO2 abatement costs in normal times, and 30% pure IRRs during energy shortages. They will also be needed to integrate more new energies into power grids. This note outlines the opportunity in capacitor banks, their economics and leading companies.
-
Power capacity of a typical home?
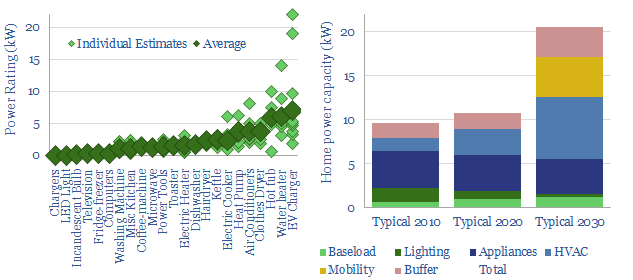
A typical home in the developed world currently has a 10kW maximum power capacity before tripping its circuit-breaker (although it varies). This could easily double in the energy transition, due to phasing back gas heating, gas cooking and the addition of home charging stations for electric vehicles.
-
Windy physics: how is power of a wind turbine calculated?
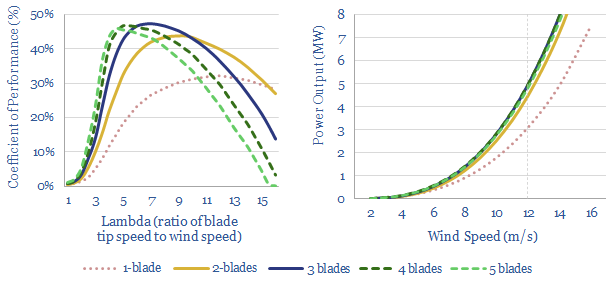
This data-file is an overview of wind power physics. Specifically, how is the power of a wind turbine calculated, in MW, as a function of wind speed, blade length, blade number, rotational speed (in RPM) and other efficiency factors (lambda). A large, modern offshore wind turbine will have 100m blades and surpass 10MW power outputs.
-
Air conditioning: energy demand sensitivity?
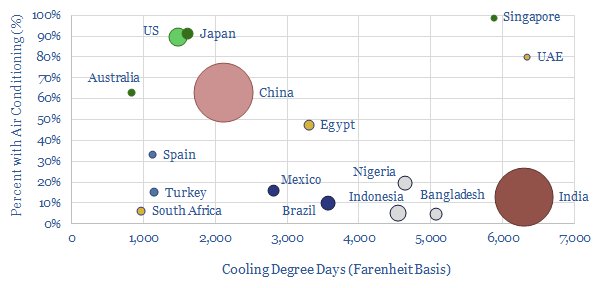
This data-file quantifies air conditioning energy demand. In the US each 100 variation in CDDs adds 26 TWH of electricity (0.6%) demand and 200bcf of gas (0.6%). Air conditioning already consumes 7% of all global electricity and could treble by 2050.
-
India: electricity demand and power grid over time?
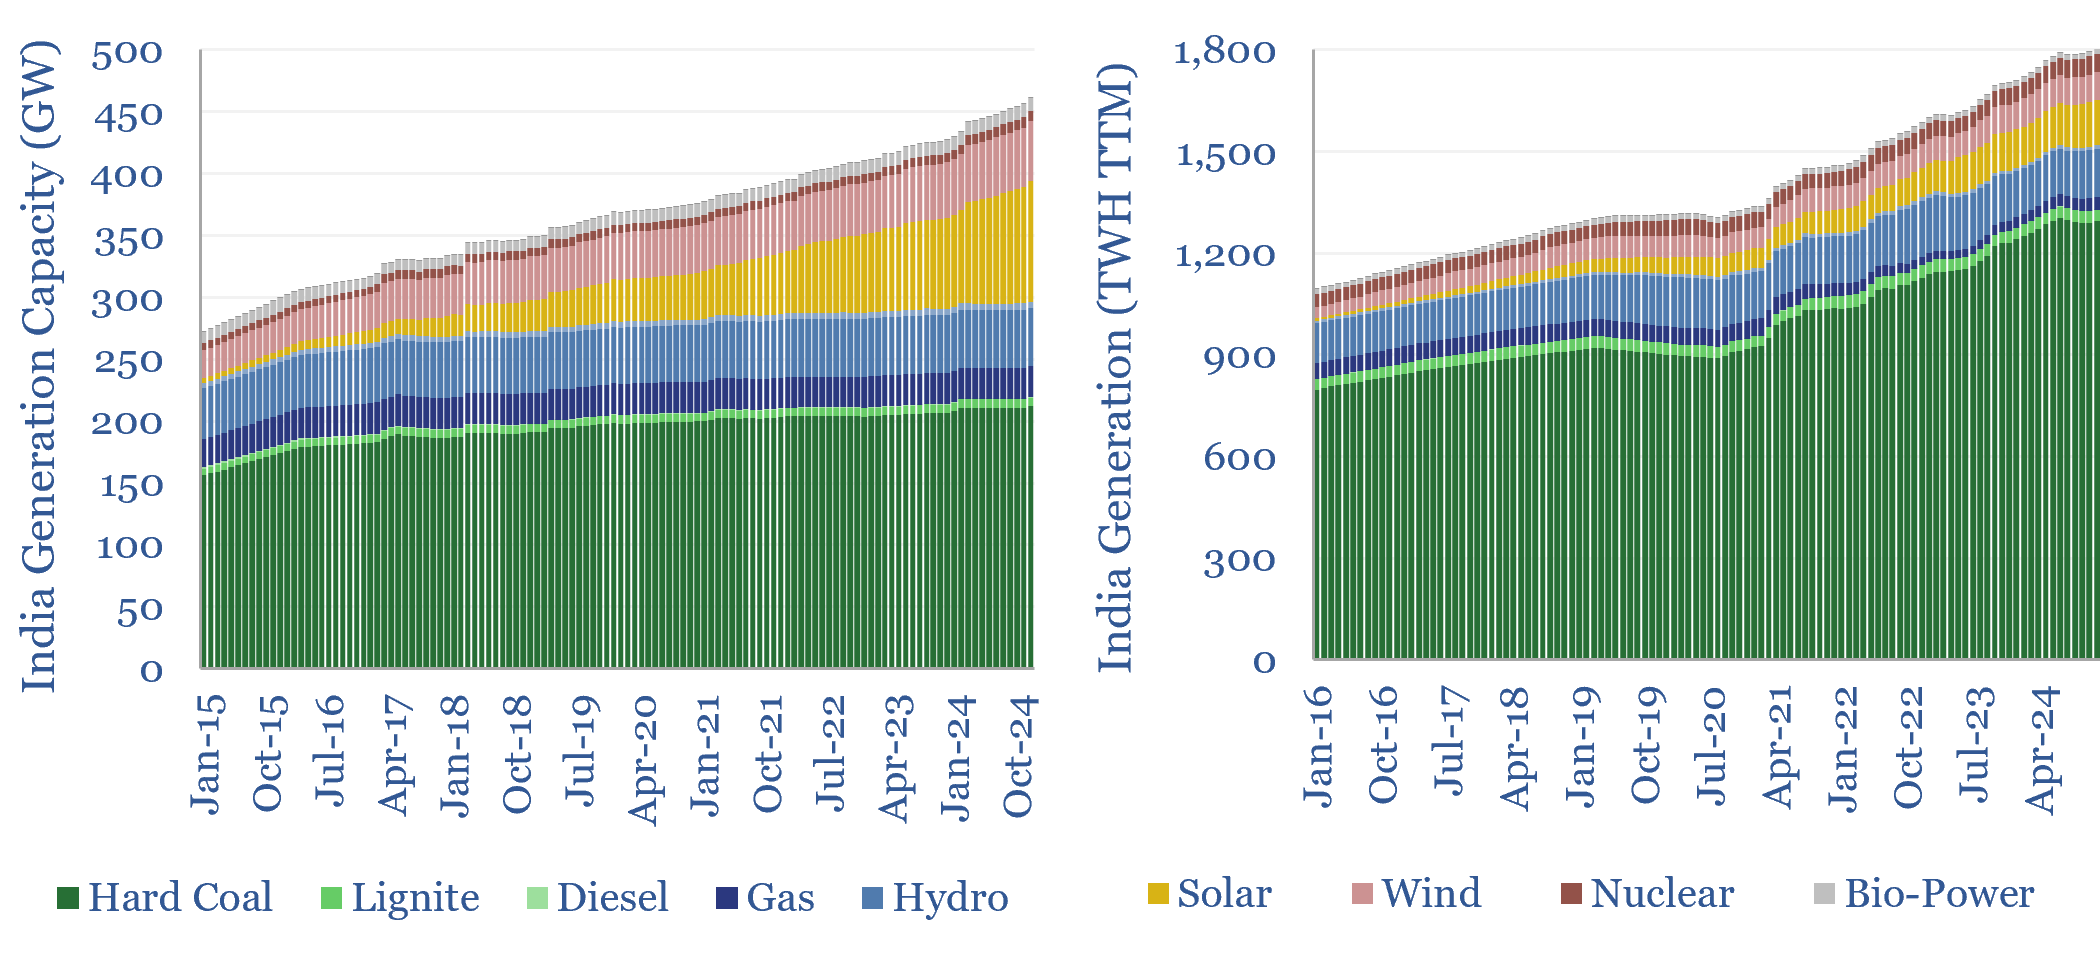
India’s electricity demand is growing by 6-8% (+100-140 TWH) per year, but 75% of the total still comes from coal, which has itself grown at a 5% CAGR over the past half-decade. Wind and solar would need to grow 4x faster than 2023 levels for thermal generation just to flatline. What implications and opportunities for…
-
Renewables: how much time to connect to the grid?
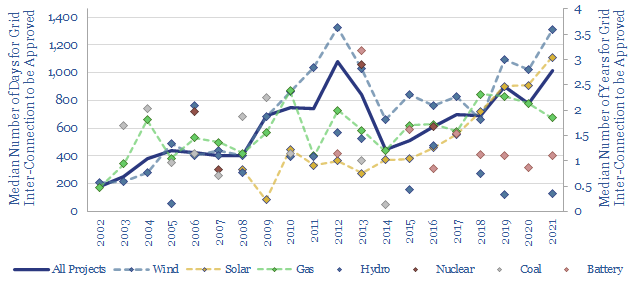
Is the power grid becoming a bottleneck for the continued acceleration of renewables? The median approval time to tie a new US power project into the grid has climbed by 30-days/year since 2001, and doubled since 2015, to over 1,000 days (almost 3-years) in 2021. Wind and solar projects are now taking longest. This data-file…
-
Wind turbine capacity factors: by country, by facility?
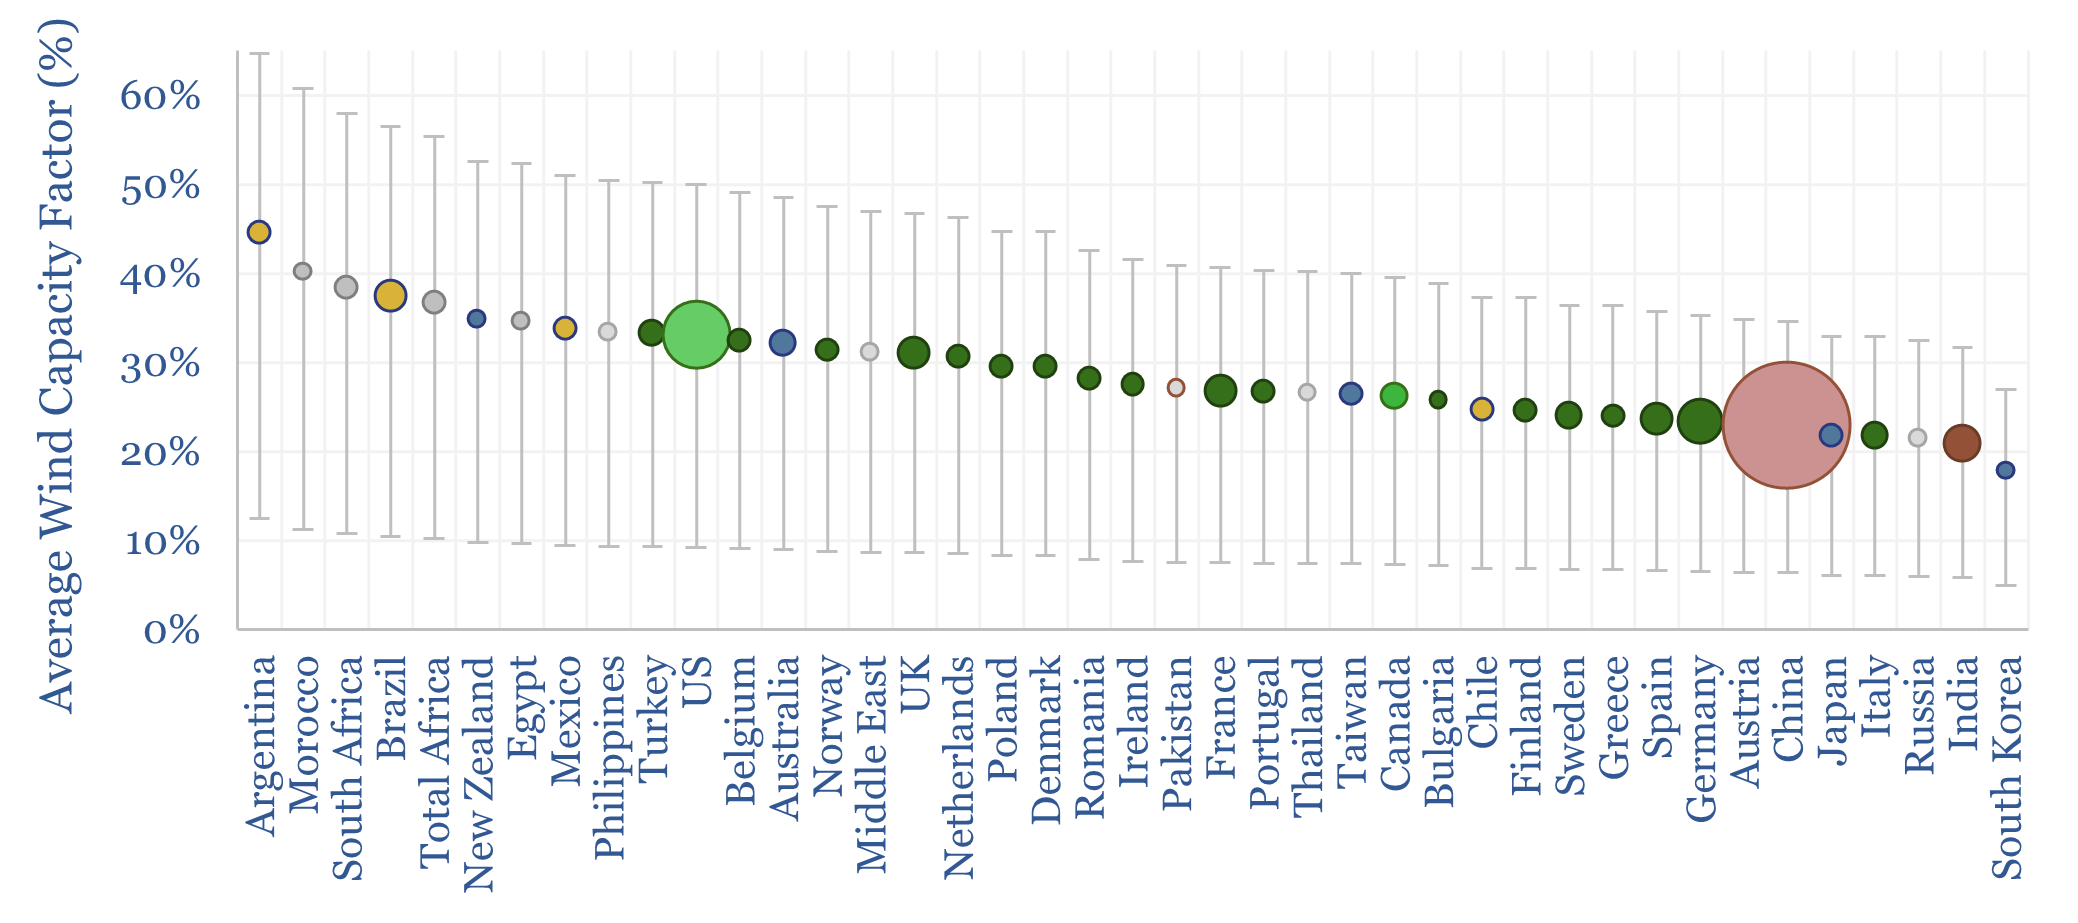
Wind turbine capacity factors average 26% globally. But they vary from c20% in non-windy countries to 45% in the windiest countries. And they also vary within countries, with a normal distribution and a standard deviation of 7-12%. This data-file maps capacity factors of wind power generation.
-
Power cuts: how frequent are grid disruptions?
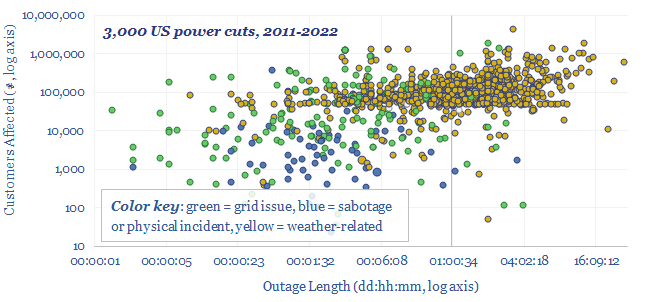
This data-file aggregates significant US power grid disruptions, based on data from the DOE. On average, there are 250 power cuts per year in the United States, lasting for a median average of 5-hours, and affecting a median average of 80,000 customers. 20% of the power cuts last longer than 1-day. 15% affect more than…
-
Solar inverters: companies, products and costs?
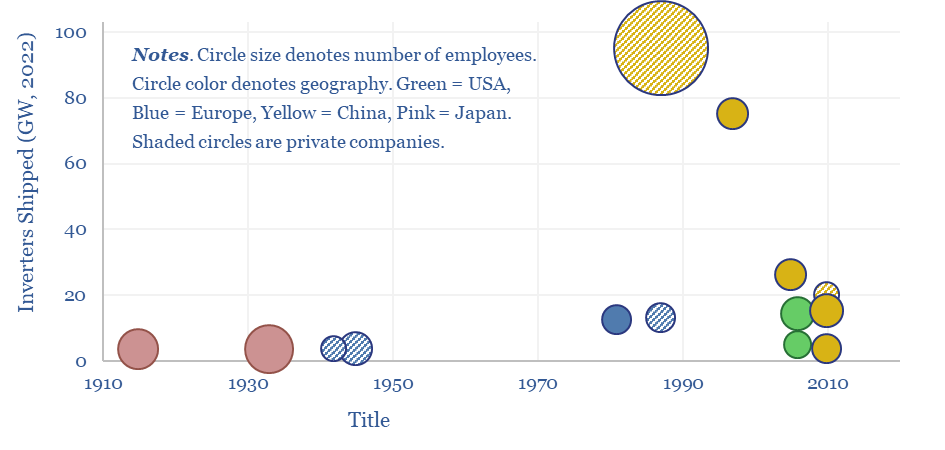
This data-file tracks some of the leading solar inverter companies and inverter costs, efficiency and power electronic properties. As China now supplies 85% of all global inverters, at 30-50% lower $/W pricing than Western companies, a key question explored in the data-file is around price versus quality.
Content by Category
- Batteries (89)
- Biofuels (44)
- Carbon Intensity (49)
- CCS (63)
- CO2 Removals (9)
- Coal (38)
- Company Diligence (95)
- Data Models (840)
- Decarbonization (160)
- Demand (110)
- Digital (60)
- Downstream (44)
- Economic Model (205)
- Energy Efficiency (75)
- Hydrogen (63)
- Industry Data (279)
- LNG (48)
- Materials (82)
- Metals (80)
- Midstream (43)
- Natural Gas (149)
- Nature (76)
- Nuclear (23)
- Oil (164)
- Patents (38)
- Plastics (44)
- Power Grids (130)
- Renewables (149)
- Screen (117)
- Semiconductors (32)
- Shale (51)
- Solar (68)
- Supply-Demand (45)
- Vehicles (90)
- Wind (44)
- Written Research (354)