Search results for: “renewables”
-
Redox flow batteries: for the duration?
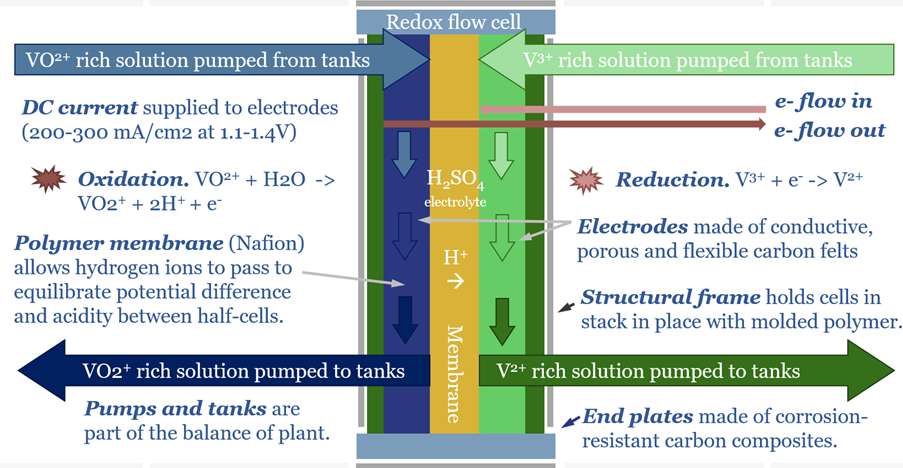
Redox flow batteries have 6-24 hour durations and require 15-20c/kWh storage spreads. They will increasingly compete with lithium ion batteries in grid-scale storage. Does this unlock a step-change for peak renewables penetration? Or create 3-30x upside for total global Vanadium demand? This 15-page note is our outlook for redox flow batteries.
-
Thermal energy storage: leading companies?
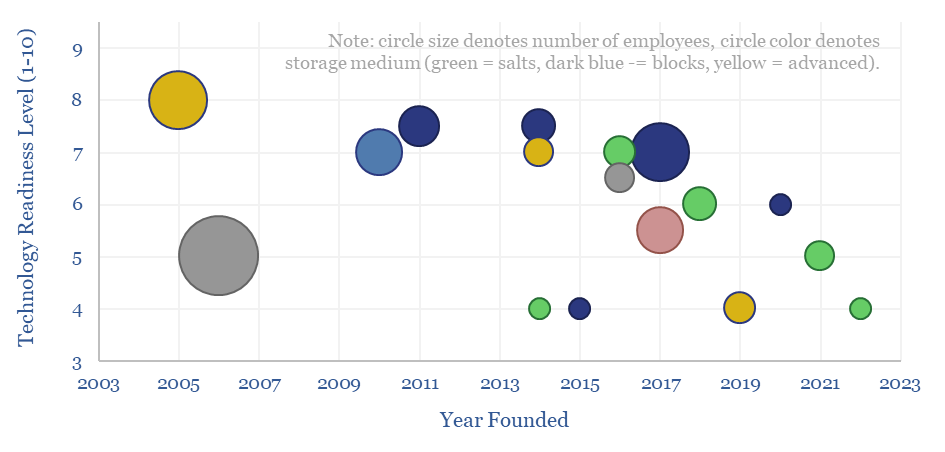
This data-file is a screen of thermal energy storage companies, developing systems that can absorb excess renewable electricity, heat up a storage medium, and then re-release the heat later, for example as high-grade steam or electricity. The space is fast-evolving and competitive, with 17 leading companies progressing different solutions.
-
Global steel supply-demand model?
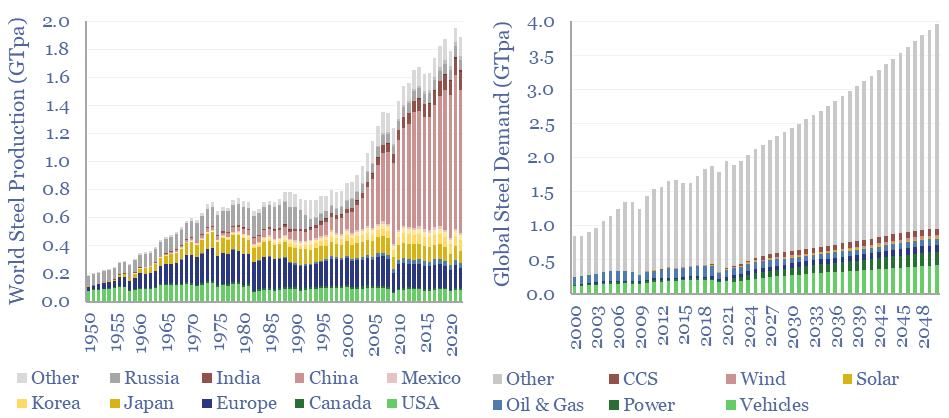
Global steel supply-demand runs at 2GTpa in 2023, having doubled since 2003. Our best estimate is that steel demand rises another 80%, to 3.6GTpa by 2050, including due to the energy transition. Global steel production by country is now dominated by China, whose output exceeds 1GTpa, which is 8x the #2 producer, India, at 125MTpa.
-
Oil markets: rising volatility?
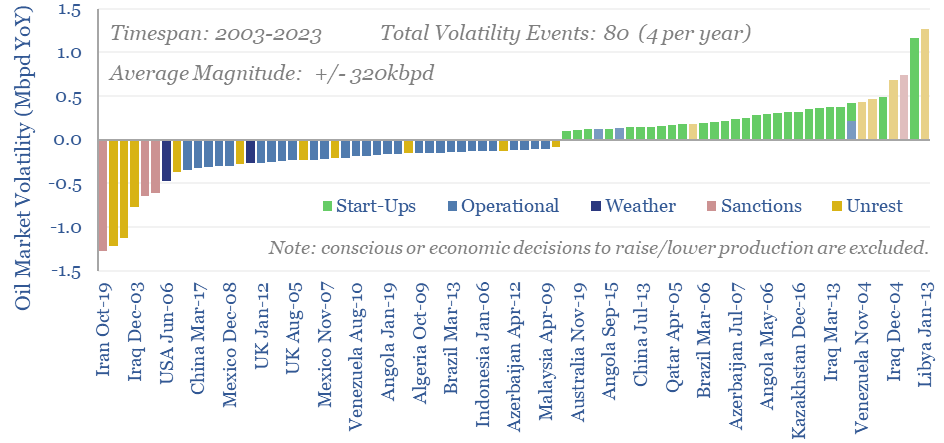
Oil markets endure 4 major volatility events per year, with a magnitude of +/- 320kbpd, on average. Their net impact detracts -100kbpd. OPEC and shale have historically buffered out the volatility, so annual oil output is 70% less volatile than renewables’ output. This 10-page note explores the numbers and the changes that lie ahead?
-
Power grids: the biggest bottleneck in the world?
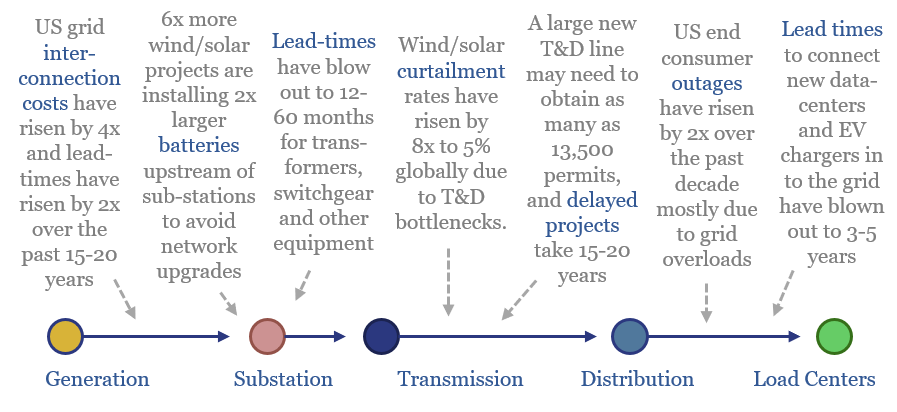
Power grids will be the biggest bottleneck in the energy transition, according to this 18-page report. Tensions have been building for a decade. They are invisible unless you are looking. And the tightness could last a decade. Further acceleration of renewables may be thwarted. And we are re-thinking grid back-ups.
-
Midstream gas: pipelines have pricing power ?!
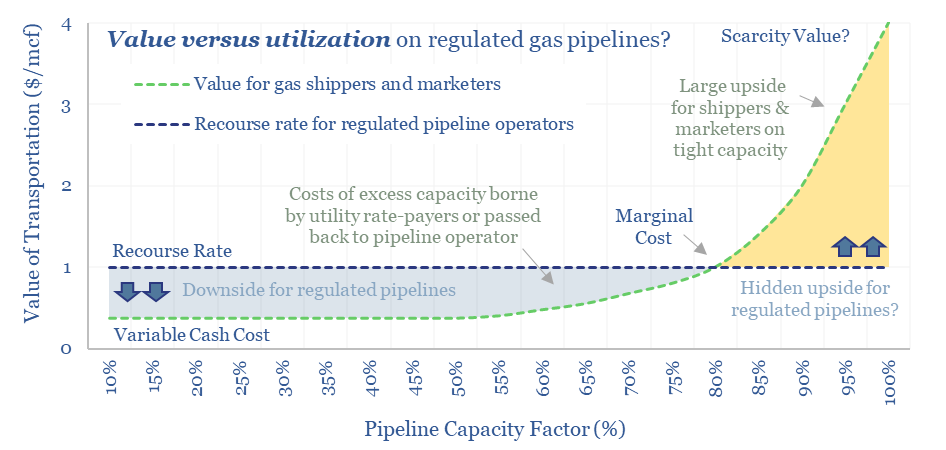
FERC regulations are surprisingly interesting!! In theory, gas pipelines are not allowed to have market power. But they increasingly do have it: gas use is rising, on grid bottlenecks, volatile renewables and AI; while new pipeline investments are being hindered. So who benefits here? Answers are explored in this 13-page report.
-
Midstream opportunities in the energy transition?
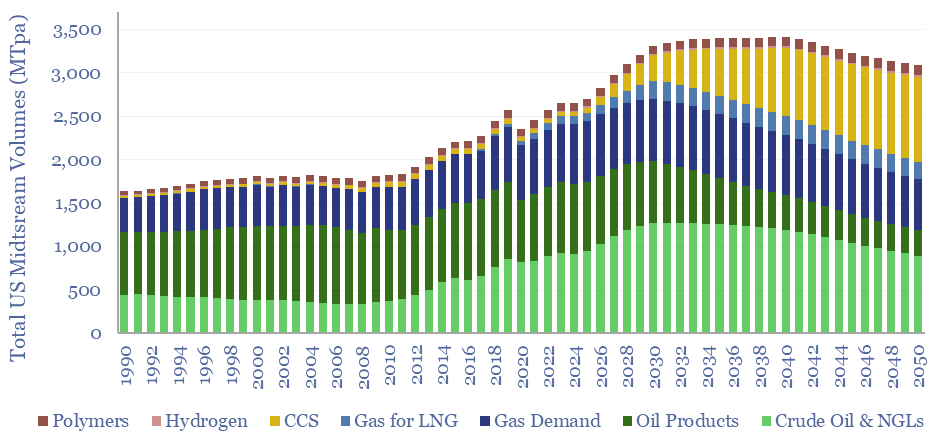
The midstream industry moves molecules, especially energy-molecules, and especially in pipelines. Despite the mega-trend of electrification, there are still strong midstream opportunities in the energy transition, backstopping volatility and moving new molecules. This short note captures our top ten conclusions. (1) Our overall outlook on the US midstream industry sees the total tonnage of molecules…
-
Commodity price volatility: energy, metals and ags?
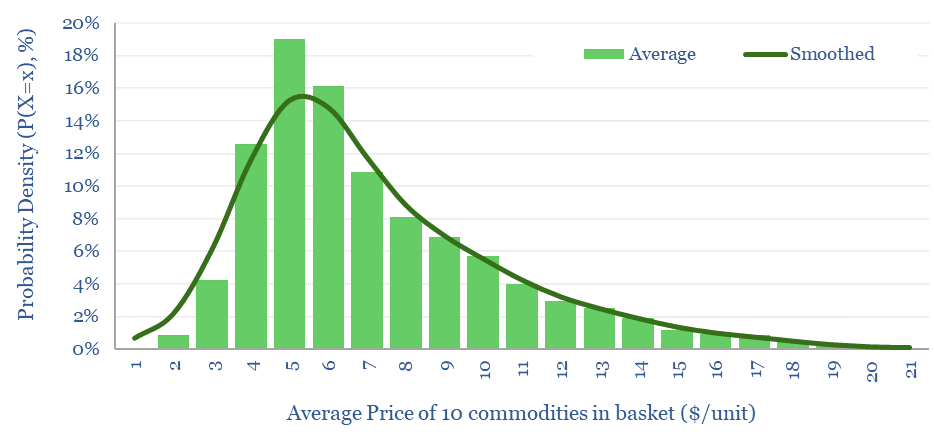
Commodity price volatility tends to be lognormally distributed, based on the data from ten commodities, over the past 50-years. Means are 20% higher than medians. Skew factors average +1.5x. Standard errors average 50%, while more volatile prices have more upside skew.
-
Energy trading: value in volatility?
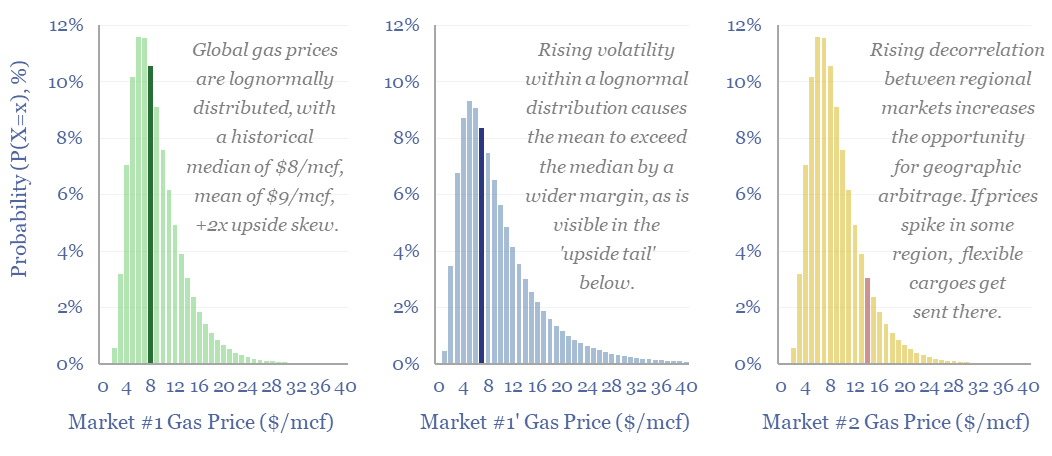
Could renewables increase hydrocarbon realizations? Or possibly even double the value in flexible LNG portfolios? Our reasoning in this 14-page report includes rising regional arbitrages, and growing volatility amidst lognormal price distributions (i.e., prices deviate more to the upside than the downside). What implications and who benefits?
-
Energy self-sufficiency by country and over time?
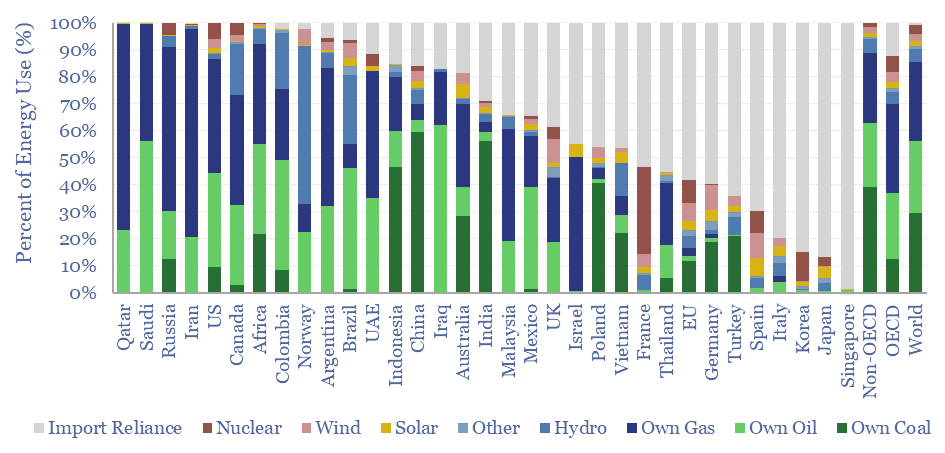
This data-file tabulates energy self-sufficiency, by country, over time, across 30 of the largest economies in the world. Among this sample, the median country generates 70% of its energy domestically, and is reliant on imports for 30% of the remainder. Energy self-sufficiency varies vastly by country.
Content by Category
- Batteries (88)
- Biofuels (44)
- Carbon Intensity (49)
- CCS (63)
- CO2 Removals (9)
- Coal (38)
- Company Diligence (93)
- Data Models (831)
- Decarbonization (159)
- Demand (110)
- Digital (58)
- Downstream (44)
- Economic Model (203)
- Energy Efficiency (75)
- Hydrogen (63)
- Industry Data (278)
- LNG (48)
- Materials (82)
- Metals (77)
- Midstream (43)
- Natural Gas (148)
- Nature (76)
- Nuclear (23)
- Oil (164)
- Patents (38)
- Plastics (44)
- Power Grids (127)
- Renewables (149)
- Screen (114)
- Semiconductors (30)
- Shale (51)
- Solar (67)
- Supply-Demand (45)
- Vehicles (90)
- Wind (43)
- Written Research (351)