Search results for: “renewables”
-
Power grids: opportunities in the energy transition?
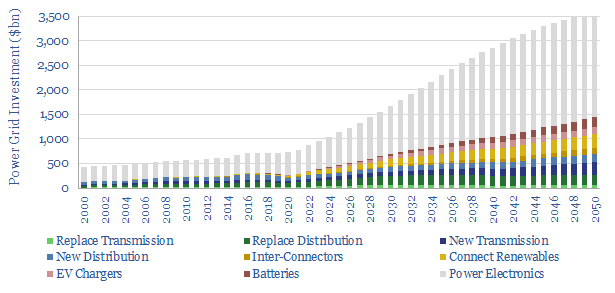
Power grids move electricity from the point of generation to the point of use, while aiming to maximize the power quality, minimize costs and minimize losses. Broadly defined, global power grids and power electronics investment must step up 5x in the energy transition, from a $750bn pa market to over $3.5trn pa. But this theme…
-
EROEI: energy return on energy invested?
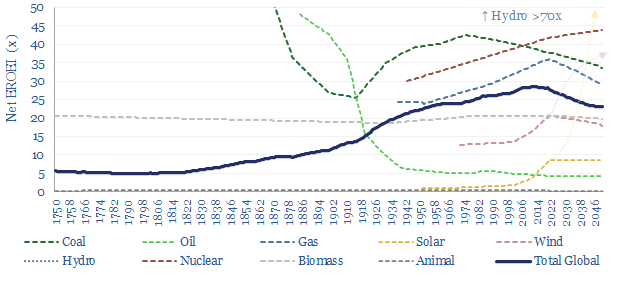
EROEI is the best metric for comparing end-to-end energy efficiencies. Wind and solar currently have EROEIs that are lower and ‘slower’ than today’s global energy mix; stoking upside to energy demand and capex. But future wind and solar EROEIs could improve 2-6x. This 13-page report explores whether this will be the make-or-break factor determining the…
-
Power grids: transmission and distribution kilometers by country?
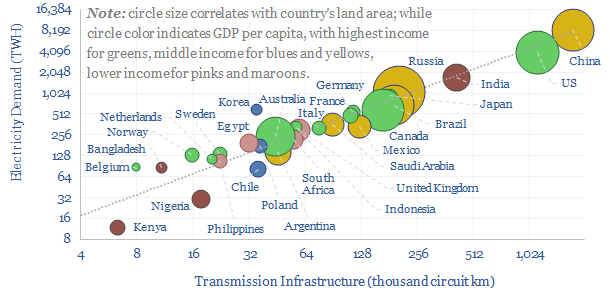
This data-file aggregates power transmission and distribution kilometers by country, across 30 key countries, which comprise 80% of global electricity use. In 2023, the world contains 7M circuit kilometers of power transmission lines and 110M kilometers of power distribution lines. Useful rules of thumb are in the data-file.
-
Global decarbonization: speeding up or slowing down?
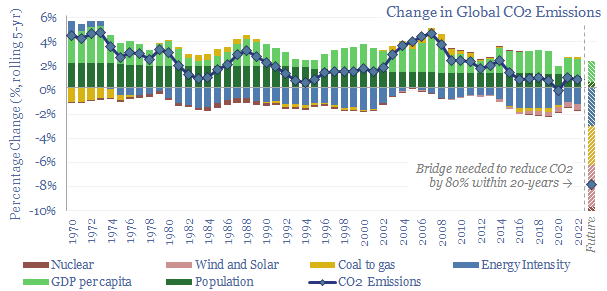
This 16-page report beaks down global CO2 emissions, across six causal factors and 28 countries and regions. Global emissions rose at +0.7% pa CAGR from 2017-2022, of which +1.0% pa is population growth, +1.4% pa rising incomes, -1.4% pa efficiency gains, -0.5% renewables, 0% nuclear, +0.2% ramping back coal due to underinvestment in gas. Depressingly,…
-
Smooth operators: who benefits from volatile power grids?
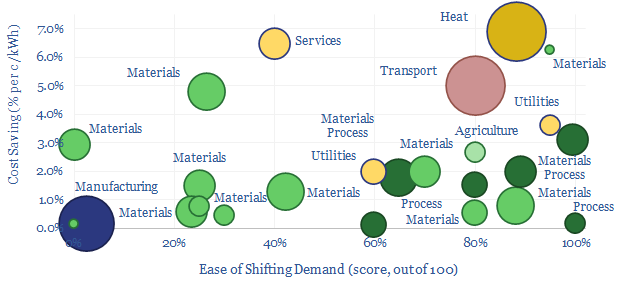
Some industries can absorb low-cost electricity when renewables are over-generating and avoid high-cost electricity when they are under-generating. The net result can lower electricity costs by 2-3c/kWh and uplift ROCEs by 5-15% in increasingly renewables-heavy grids. This 14-page note ranges over 10,000 demand shifting opportunities, to identify who can benefit most.
-
Storage tank costs: storing oil, energy, water and chemicals?
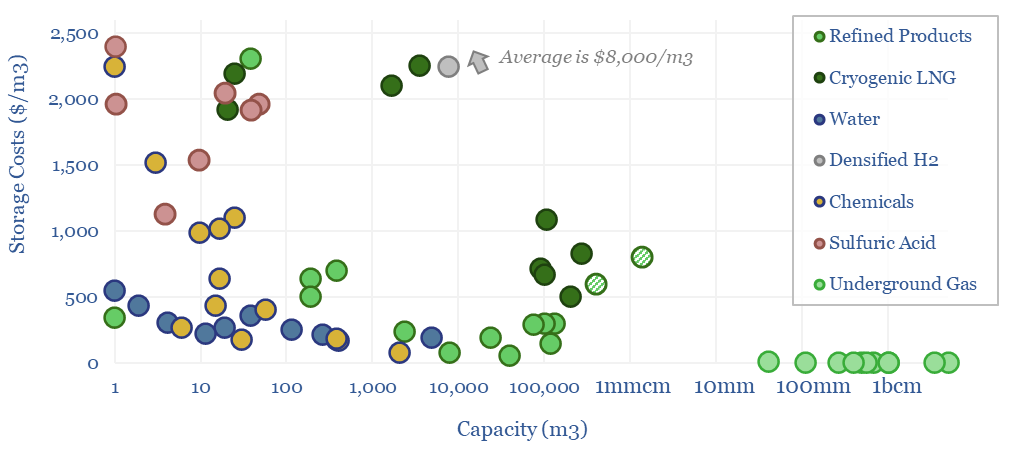
Storage tank costs are tabulated in this data-file, averaging $100-300/m3 for storage systems of 10-10,000 m3 capacity. Costs are 2-10x higher for corrosive chemicals, cryogenic storage, or very large/small storage facilities. Some rules of thumb are outlined below with underlying data available in the Excel.
-
Redox flow batteries: costs and capex?
Redox flow battery costs are built up in this data-file, especially for Vanadium redox flow. In our base case, a 6-hour battery that charges and discharges daily needs a storage spread of 20c/kWh to earn a 10% IRR on $3,000/kW of up-front capex. Longer-duration redox flow batteries start to out-compete lithium ion batteries for grid-scale…
-
California power generation over time?
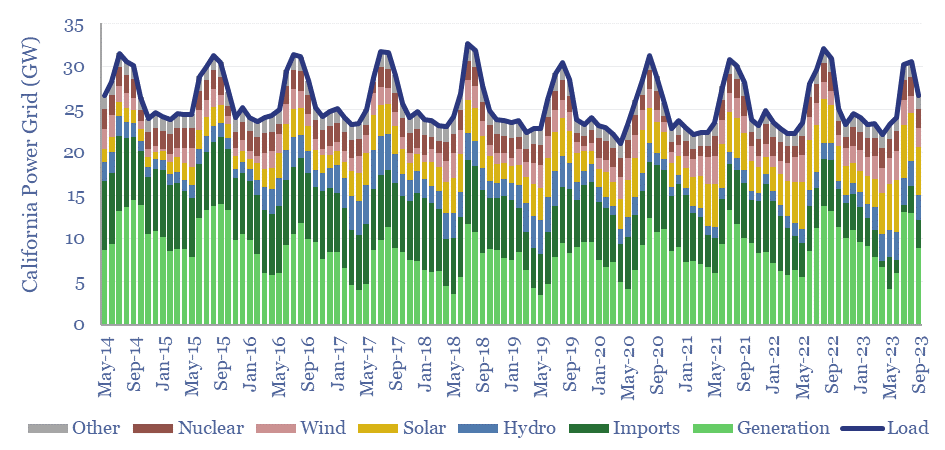
California’s power grid ranges from 26-61GW of demand. Utility scale solar has almost quadrupled in the past decade, rising from 5% to almost 20% of the grid. Yet it has not displaced thermal generation, which rose from 28% to 36% of the grid. We even wonder whether wind and solar are entrenching natural gas generators…
-
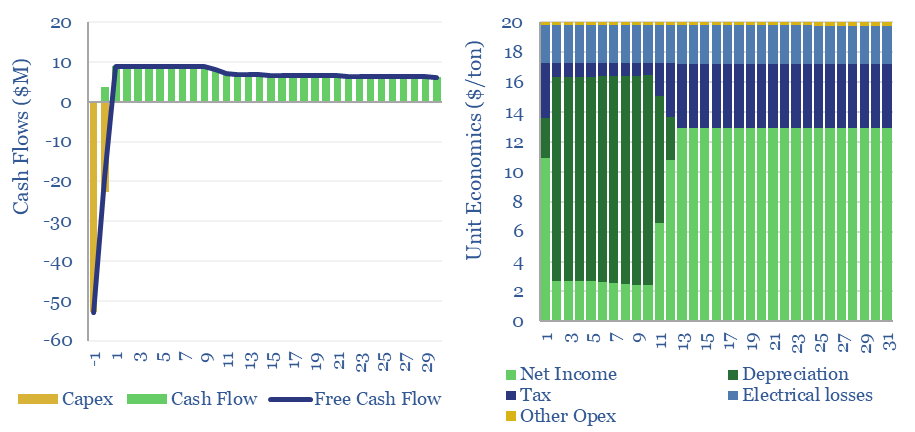
Thermal energy storage: cost model?
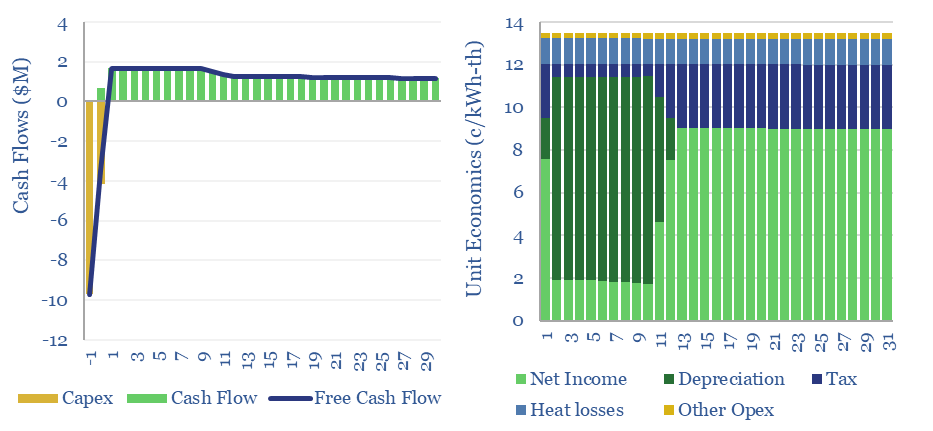
This data-file captures the costs of thermal energy storage, buying renewable electricity, heating up a storage media, then releasing the heat for industrial, commercial or residential use. Our base case requires 13.5 c/kWh-th for a 10% IRR, however 5-10 c/kWh-th heat could be achieved with lower capex costs.
-
California’s grid: wind and solar statistical distributions?
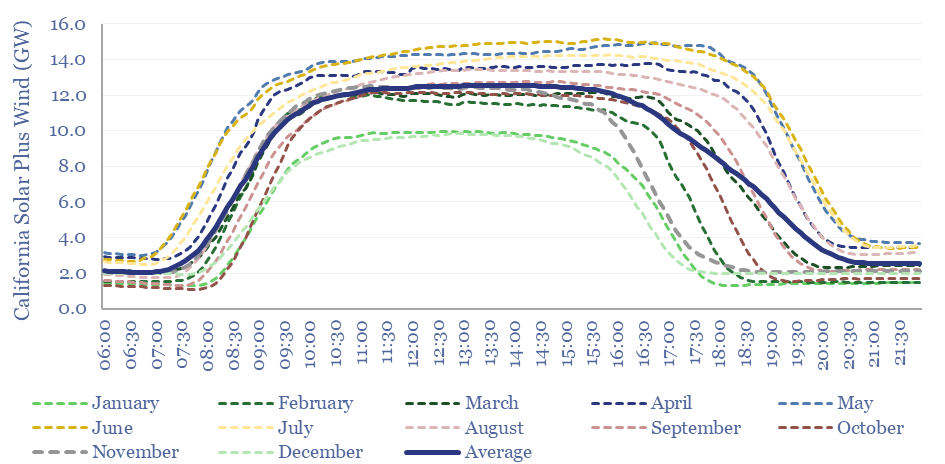
This data-file aggregates the statistical distribution of total electricity demand, solar generation and wind generation, every 5-minutes, across California, for the entirety of 2022, in order to understand their volatility and curtailment rates. The data suggest that wind and solar will most likely peak at 50-55% of renewables-heavy grids.
Content by Category
- Batteries (89)
- Biofuels (44)
- Carbon Intensity (49)
- CCS (63)
- CO2 Removals (9)
- Coal (38)
- Company Diligence (95)
- Data Models (840)
- Decarbonization (160)
- Demand (110)
- Digital (60)
- Downstream (44)
- Economic Model (205)
- Energy Efficiency (75)
- Hydrogen (63)
- Industry Data (279)
- LNG (48)
- Materials (82)
- Metals (80)
- Midstream (43)
- Natural Gas (149)
- Nature (76)
- Nuclear (23)
- Oil (164)
- Patents (38)
- Plastics (44)
- Power Grids (130)
- Renewables (149)
- Screen (117)
- Semiconductors (32)
- Shale (51)
- Solar (68)
- Supply-Demand (45)
- Vehicles (90)
- Wind (44)
- Written Research (354)