Search results for: “small scale LNG”
-
CO2 intensity of coal production?
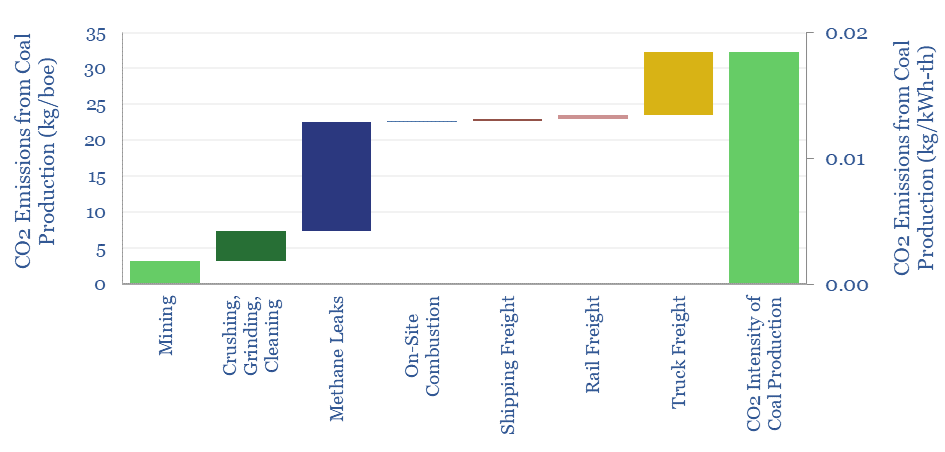
Producing a ton of coal typically emits 0.19T of CO2, equivalent to 50kg/boe. The numbers comprise mining, methane leaks and transportation. Hence domestic coal production will tend to emit 2x more CO2 than gas production, plus c2x more CO2 in combustion. However, numbers vary widely based on input assumptions, such as methane lakage rates, btu content…
-
Decarbonization in Europe: but is there enough gas?
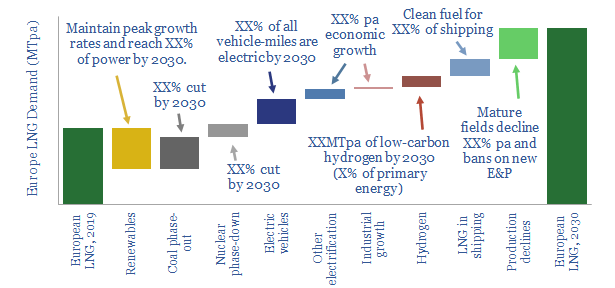
A lack of gas is likely to slow down Europe’s energy transition in the 2020s. This is the conclusion in our new 12-page note, which captures basic EU policy objectives. An incremental 85MTpa of LNG must be sourced by 2030, absorbing one third of new global LNG supplies and stoking shortages.
-
Coal mining: the economics?
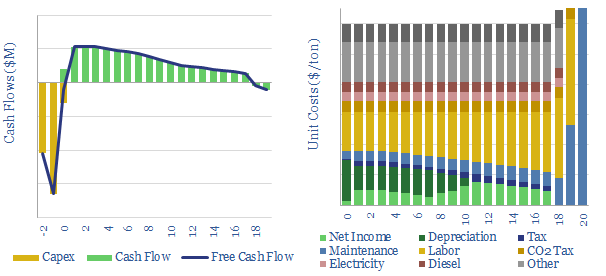
Coal is ridiculously cheap, providing thermal energy at around 1c/kWh while also generating a 10% IRR on new investment. But CO2 intensity is also very high at 0.55kg/kWh (thermal basis). Capex, opex and cost breakdowns are in the data-file.
-
Energy development times: first consideration to full production?
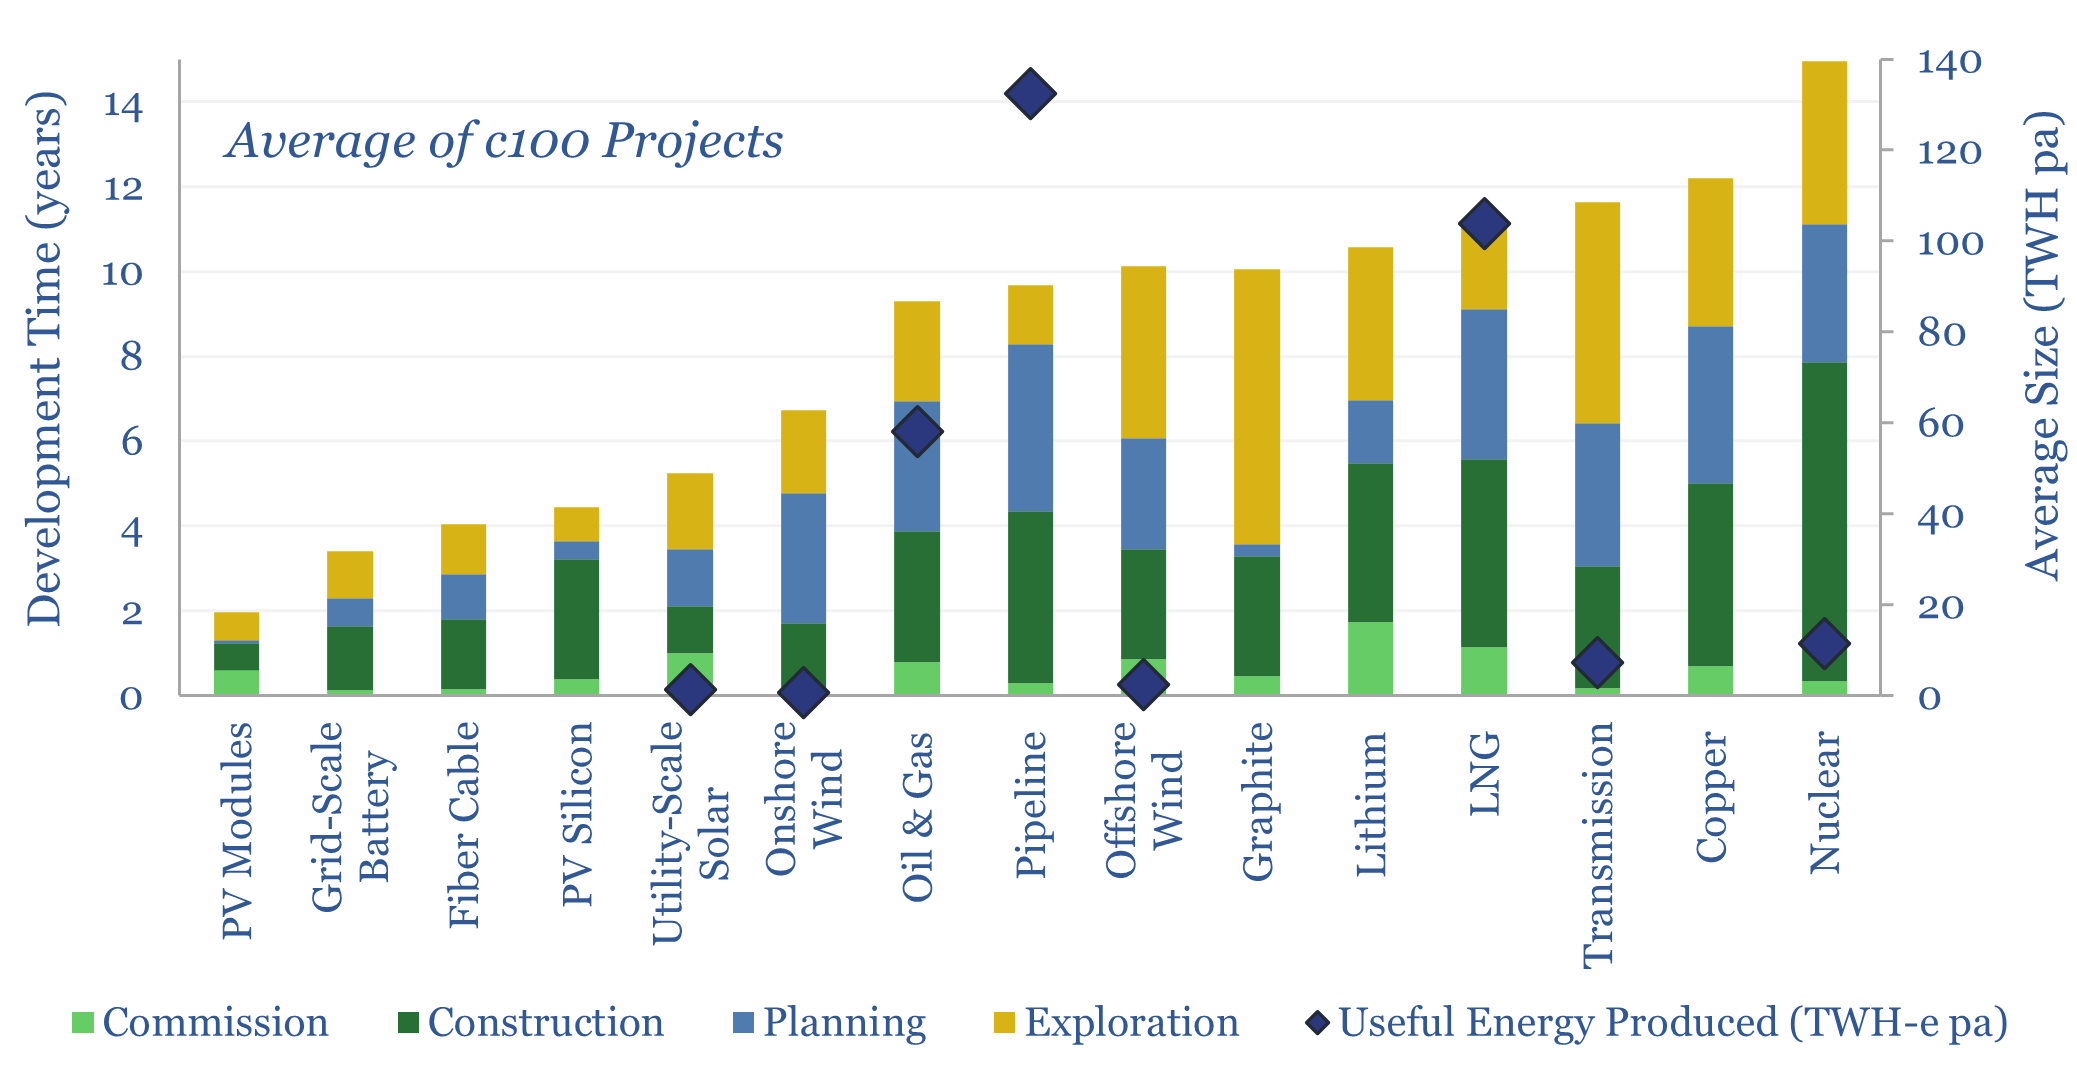
Full cycle development times tend to average c4-years for large solar projects, 6-years for large offshore wind, 7-years for new pipelines, 7-years for new oil and gas projects, 9-years for new LNG plants and 13-years for new nuclear plants. This data-file reviews 35 case studies.
-
North Field: sharing the weight of the world?
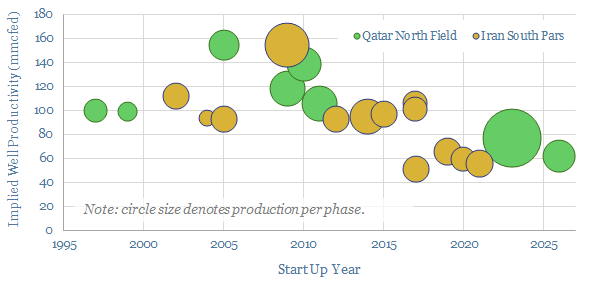
The North Field is now the most important conventional energy asset on the planet. It produces 4% of world energy, 20% of global LNG and aims to ramp another 50MTpa of low-carbon LNG by 2028. But what if Qatar’s exceptional reliability gets disrupted by unforeseen conflict with Iran?
-
Global trade: balance or darkness?
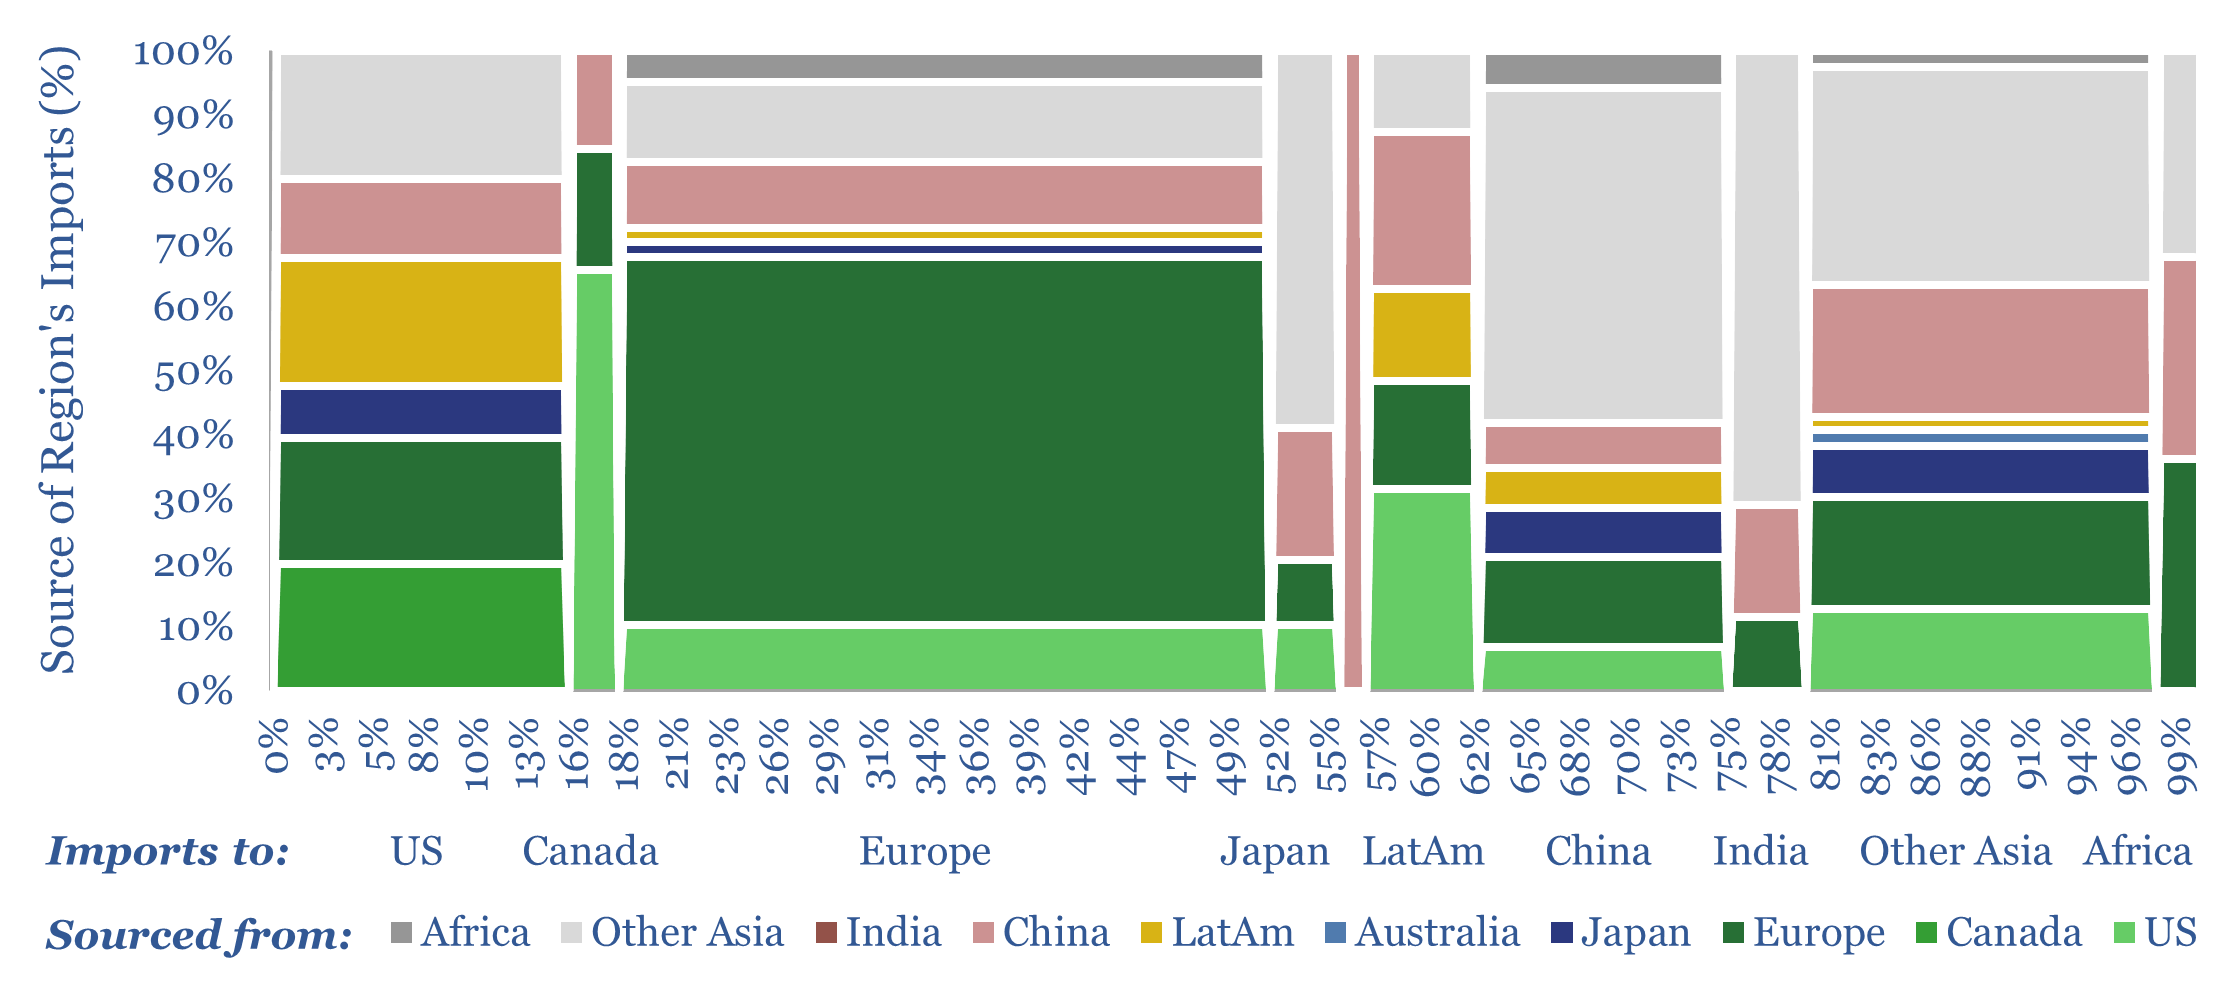
Global trade has been growing more adversarial. US foreign relations are also shifting. Hence this 16-page note maps 20 trade categories, across energy, materials and capital goods; in each case, breaking down global imports by source, and global exports by destination. Our top ten conclusions follow.
-
Global commodity trade: by product by region?
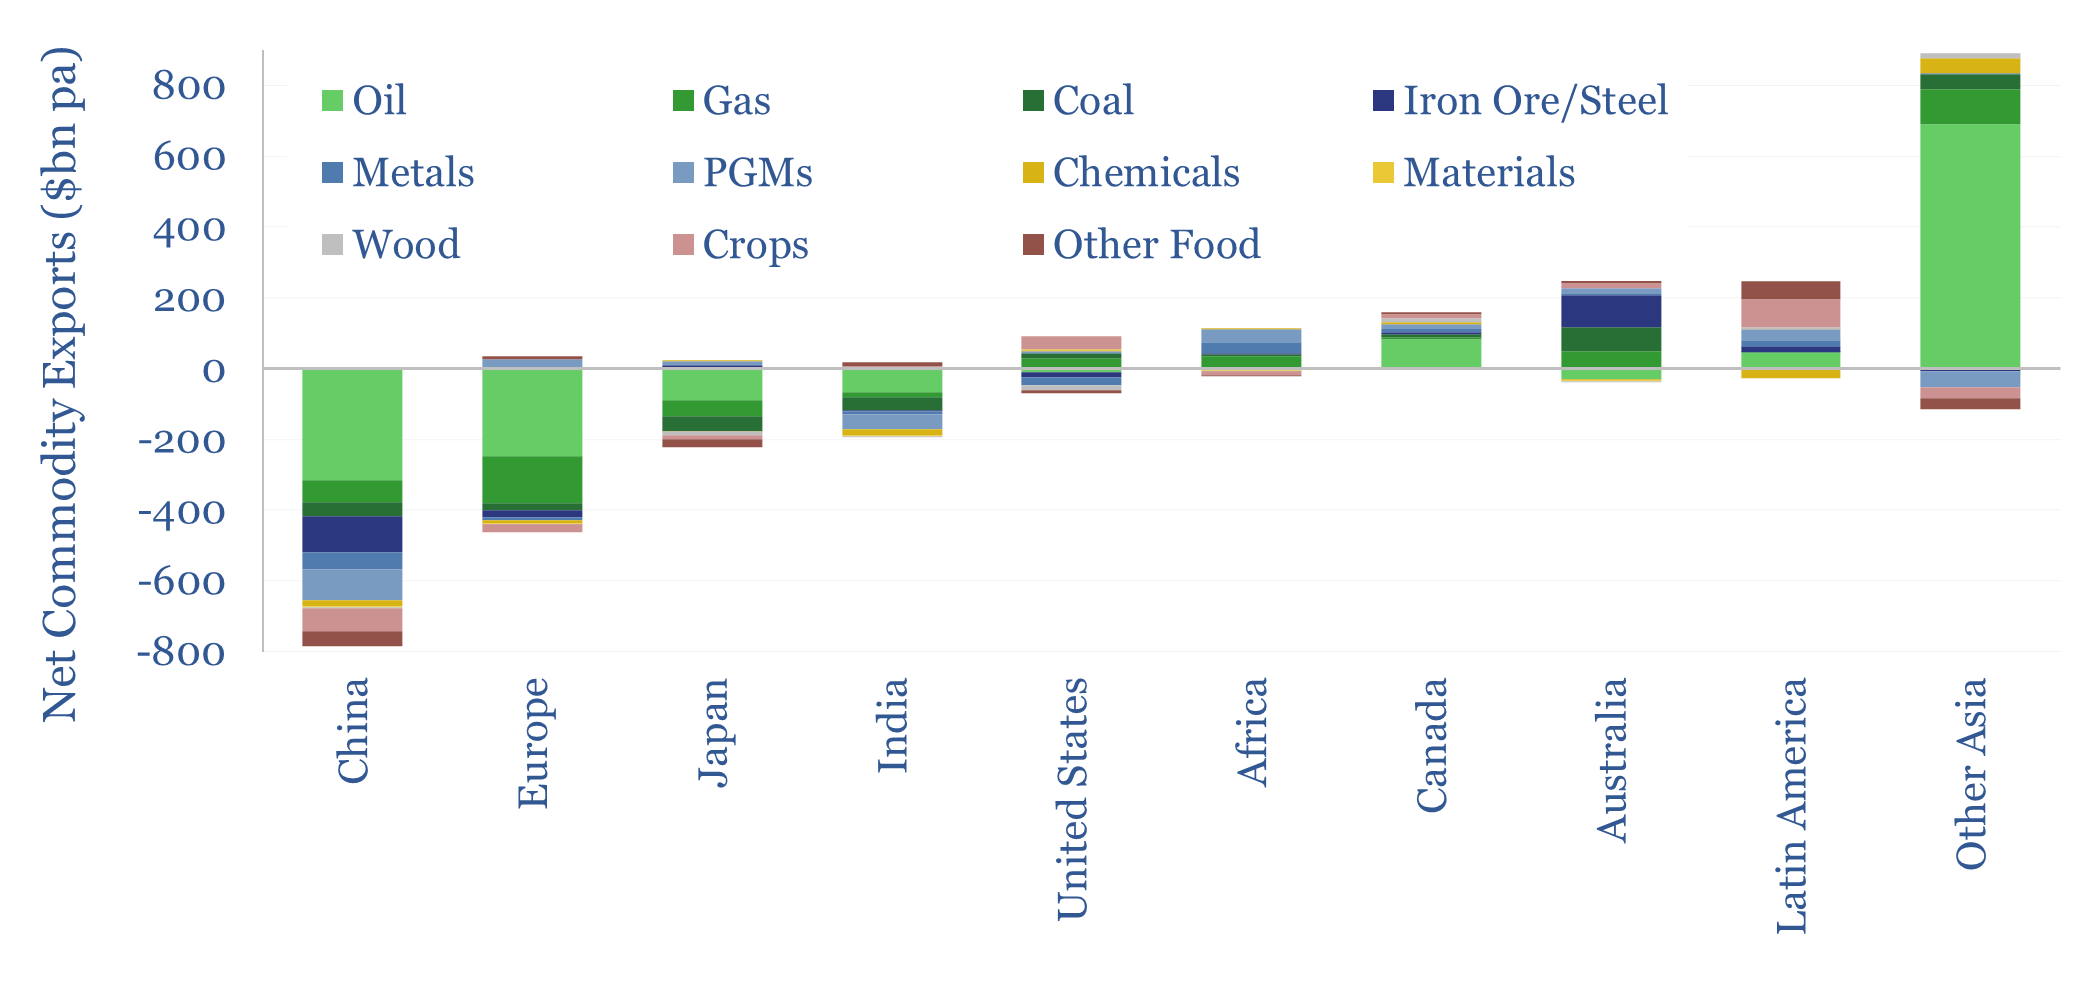
Commodities comprise over $6trn of of the world’s $33trn pa in global trade, or around 20%, alongside $10trn in services, $2trn of electronic goods, $1trn in cars, $1trn in mechanical capital goods. This data-file breaks down global commodity imports and exports, by country and by region.
-
Biogas: the economics?
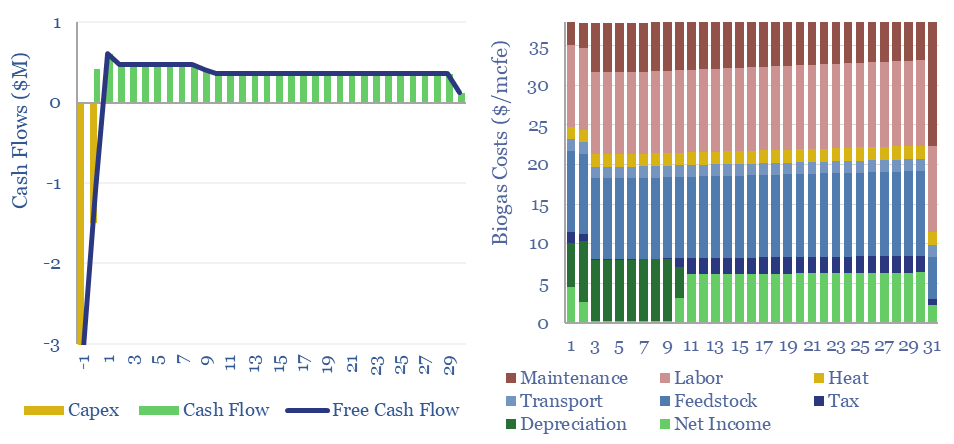
Biogas costs are broken down in this economic model, generating a 10% IRR off $180M/kboed capex, via a mixture of $16/mcfe gas sales, $60/ton waste disposal fees and $50/ton CO2 prices. High gas prices and landfill taxes can make biogas economical in select geographies. Although diseconomies of scale reward smaller projects?
-
Supercapacitors: case studies for renewable-heavy grids?
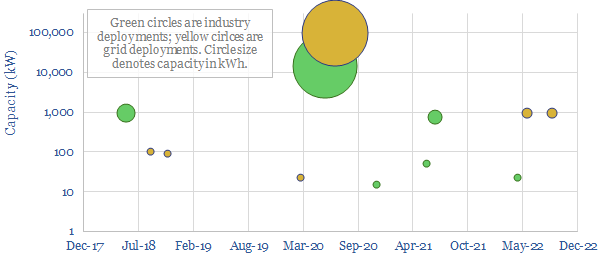
Supercapacitors are well suited to smoothing short-term volatility in increasingly renewables-heavy grids. Typical systems are 10kW-10MW, 1M chage-discharge cycles, 5-30 seconds storage and $30/kW costs. Expect the market to surprise to the upside, especially in combination with other power-electronics. Who benefits?
-
Renewables: how much time to connect to the grid?
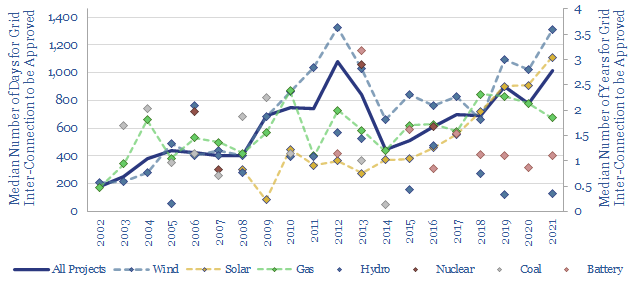
Is the power grid becoming a bottleneck for the continued acceleration of renewables? The median approval time to tie a new US power project into the grid has climbed by 30-days/year since 2001, and doubled since 2015, to over 1,000 days (almost 3-years) in 2021. Wind and solar projects are now taking longest. This data-file…
Content by Category
- Batteries (89)
- Biofuels (44)
- Carbon Intensity (49)
- CCS (63)
- CO2 Removals (9)
- Coal (38)
- Company Diligence (94)
- Data Models (838)
- Decarbonization (160)
- Demand (110)
- Digital (59)
- Downstream (44)
- Economic Model (204)
- Energy Efficiency (75)
- Hydrogen (63)
- Industry Data (279)
- LNG (48)
- Materials (82)
- Metals (80)
- Midstream (43)
- Natural Gas (148)
- Nature (76)
- Nuclear (23)
- Oil (164)
- Patents (38)
- Plastics (44)
- Power Grids (130)
- Renewables (149)
- Screen (117)
- Semiconductors (32)
- Shale (51)
- Solar (68)
- Supply-Demand (45)
- Vehicles (90)
- Wind (44)
- Written Research (354)