Search results for: “volatility volatile”
-
Global oil production by country?
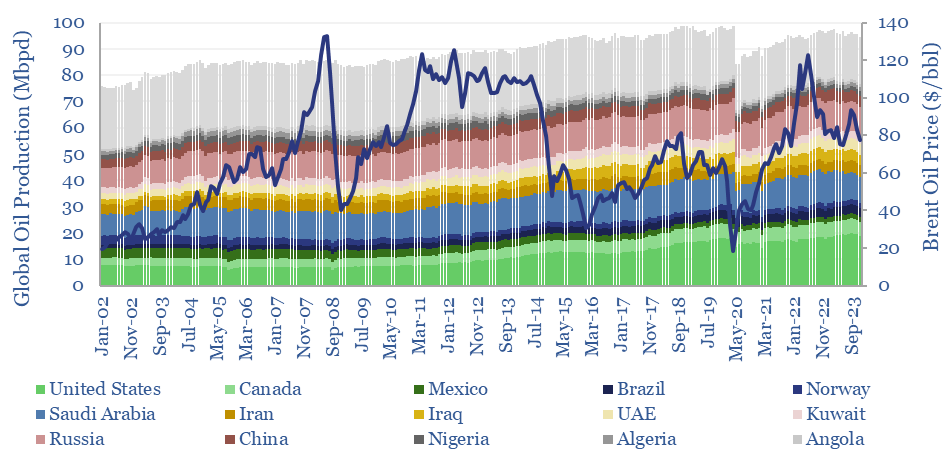
Global oil production by country by month is aggregated across 35 countries that produce 80kbpd of crude, NGLs and condensate, explaining >96% of the global oil market. Production has grown by +1Mbpd/year in the past two-decades, led by the US, Iraq, Russia, Canada. Oil market volatility is usually low, at +/- 1.5% per year, of…
-
Energy trading: value in volatility?
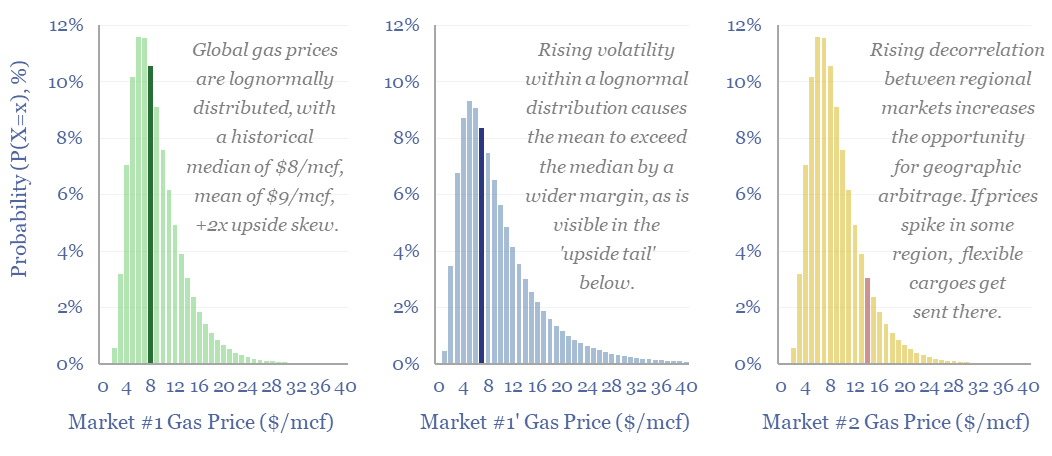
Could renewables increase hydrocarbon realizations? Or possibly even double the value in flexible LNG portfolios? Our reasoning in this 14-page report includes rising regional arbitrages, and growing volatility amidst lognormal price distributions (i.e., prices deviate more to the upside than the downside). What implications and who benefits?
-
Overview of inertia in renewable-heavy grids?
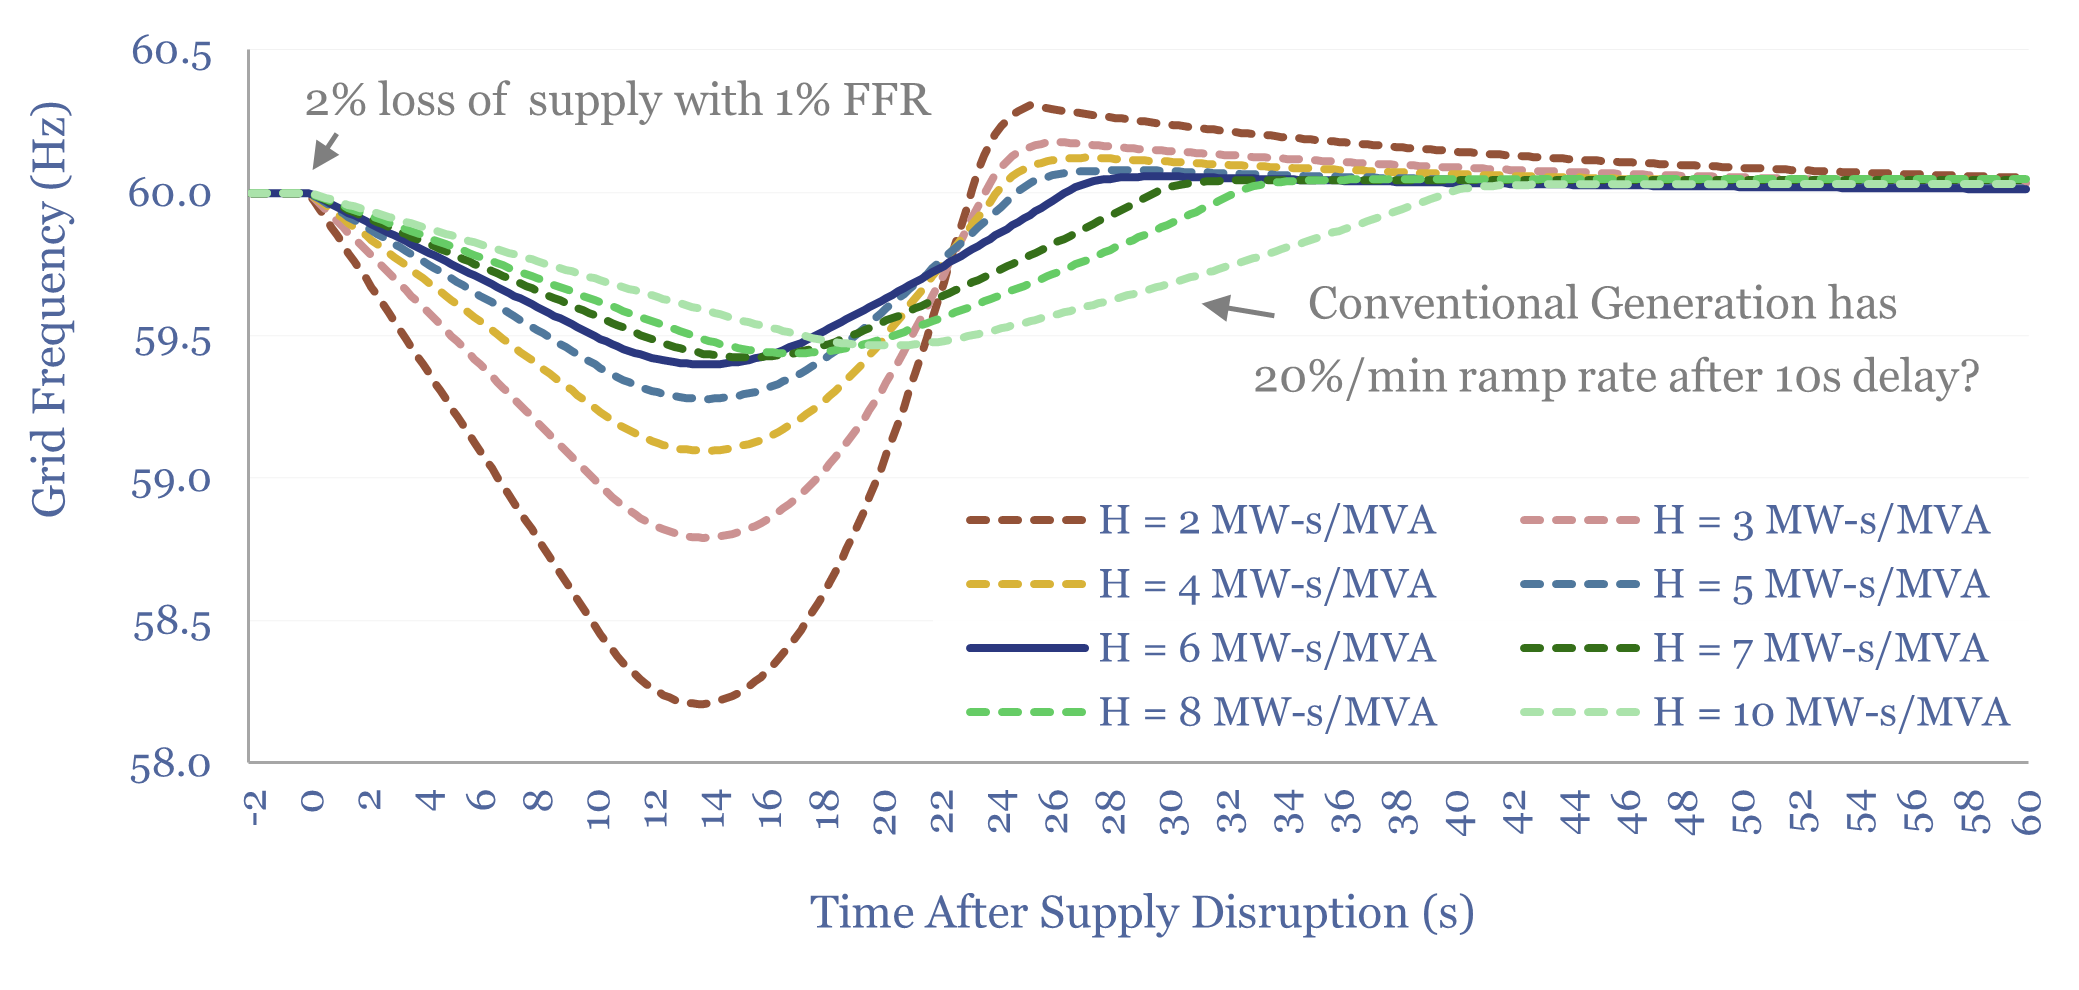
This overview of inertia in renewable-heavy grids tabulates the typical inertia of rotating generators, then models the resultant Rate of Change of Frequency (ROCOF) during supply disruptions. In our base case, a grid with 6 MW-s/MVA of inertia rides through a 2% supply-disruption, buffered by 1% fast frequency response (FFR), via lowering grid frequency from…
-
Gas peaker plants: the economics?
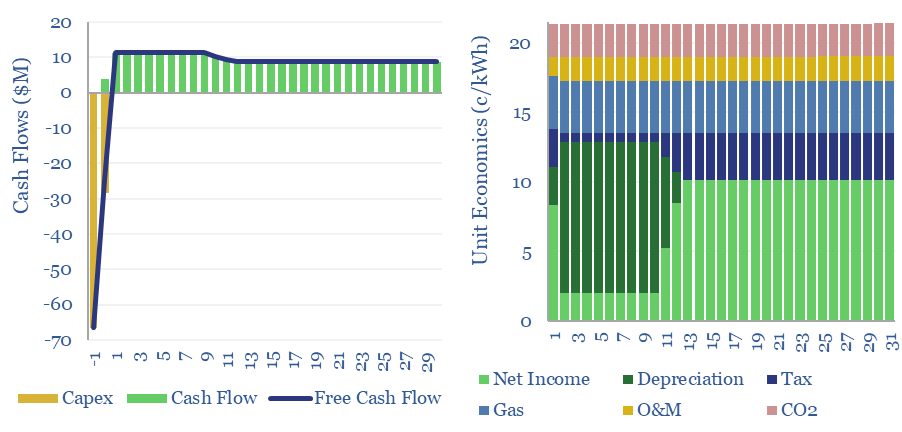
Gas peaker plants run at low utilizations of 2-20%, during times of peak demand in power grids. A typical peaker costing $950/kW and running at 10% utilization has a levelized cost of electricity around 20c/kWh, to generate a 10% IRR with 0.5 kg/kWh of CO2 intensity. This data-file shows the economic sensitivities to volatility and…
-
Coal-to-gas switching: what CO2 abatement cost?
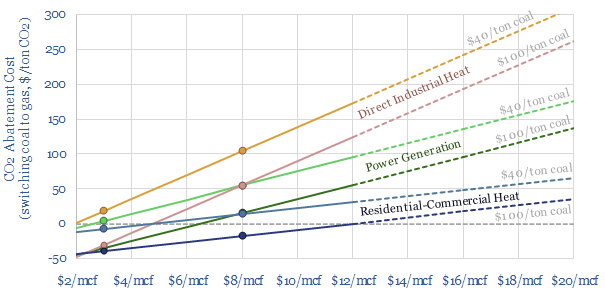
Coal-to-gas switching halves the CO2 emissions per unit of primary energy. This data-file estimates the CO2 abatement costs. Gas is often more expensive than coal. But as a rule of thumb, a $30-60/ton CO2 price makes $6-8/mcf gas competitive with $60-80/ton coal. CO2 abatement costs are materially lower in the US and after reflecting efficiency.…
-
Manufacturing utilization rates by industry?
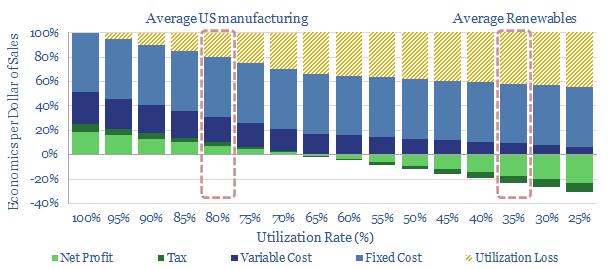
This data-file tabulates the utilization rates of different industries over time, based on a variety of data sources. Manufacturing utilization rates ran at almost 80% prior to the COVID crisis, underpinning 11% of US GDP and 25% of US energy consumption. No manufacturing industry can realistically be profitable running at the c35% utilization rates of…
-
Coal power generation: minute-by-minute flexibility?
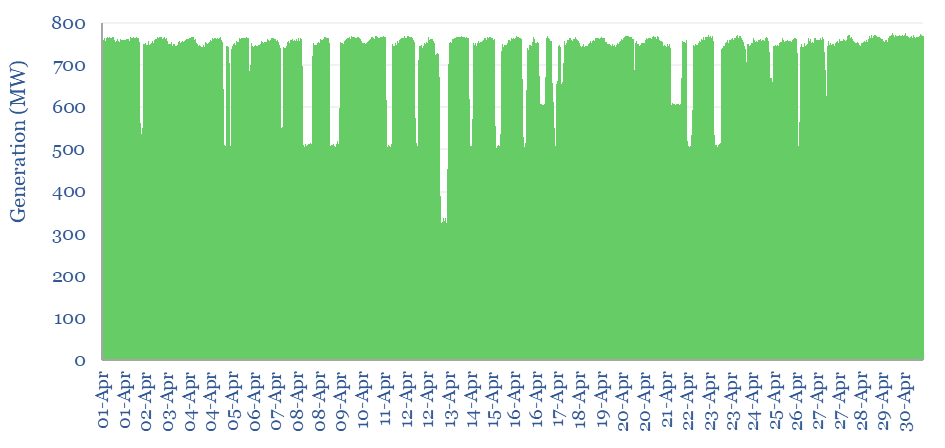
Coal power generation is aggregated in this data-file, at the largest single-unit coal power plant in Australia, across five-minute intervals, for the whole of 2023. The Kogan Creek coal plant produces stable baseload power, with average utilization rate of 85%. But it exhibits lower flexibility to backstop renewables than gas-fired generation.
-
Load bearing: will solar+gas be cheaper than gas alone?
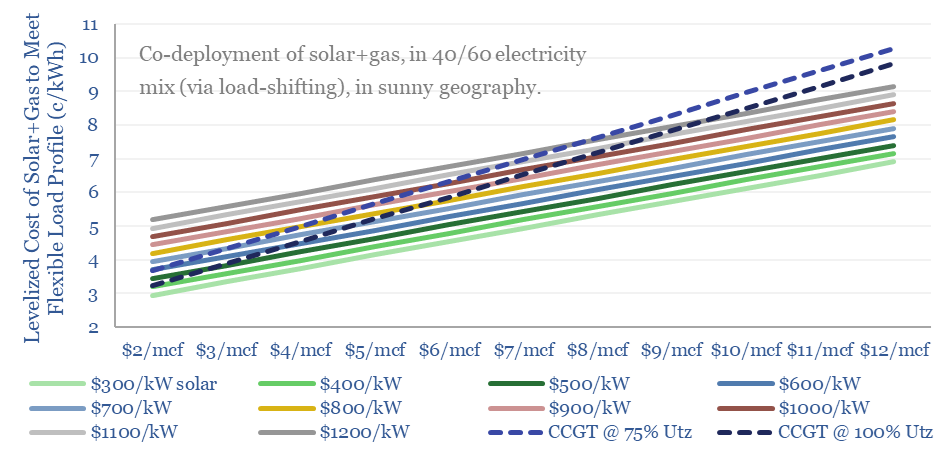
The costs to power a real-world load – e.g., a data center – with solar+gas will very often be more expensive than via a standalone gas CCGT in the US today. But not internationally? Or in the future? This 9-page note shows how solar deflation and load shifting can boost solar to >40% of future…
-
Duck curves: US power price duckiness over time?
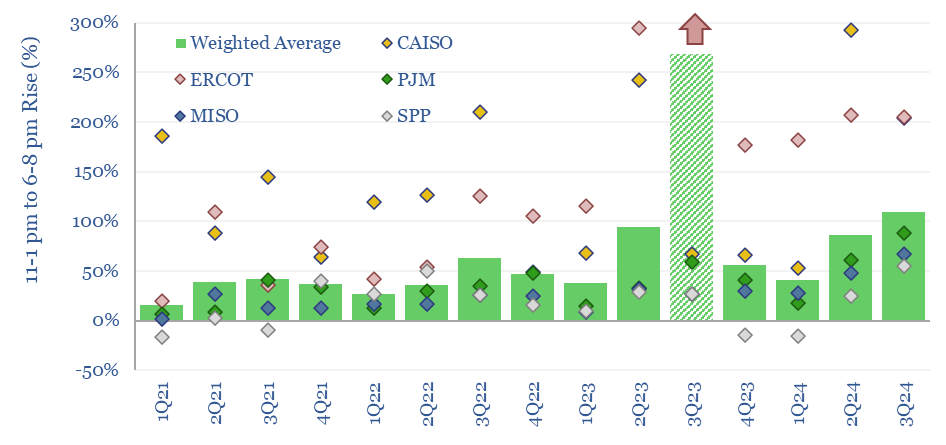
In solar-heavy grids, power prices trough around mid-day, then ramp up rapidly as the sunset. This price distribution over time is known as the duck curve. US power prices are getting 25-30% more ducky each year, based on some forms of measurement. Power prices are clearly linked to the instantaneous share of wind/solar in grids.
-
California power generation over time?
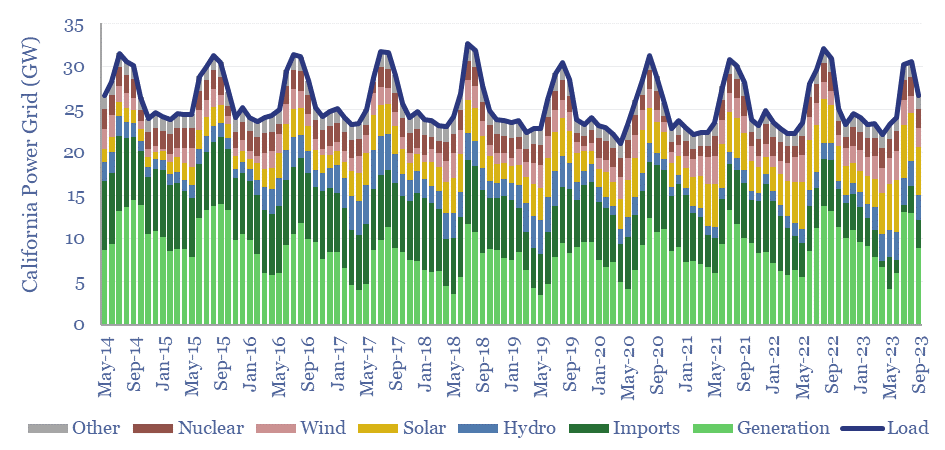
California’s power grid ranges from 26-61GW of demand. Utility scale solar has almost quadrupled in the past decade, rising from 5% to almost 20% of the grid. Yet it has not displaced thermal generation, which rose from 28% to 36% of the grid. We even wonder whether wind and solar are entrenching natural gas generators…
Content by Category
- Batteries (89)
- Biofuels (44)
- Carbon Intensity (49)
- CCS (63)
- CO2 Removals (9)
- Coal (38)
- Company Diligence (95)
- Data Models (840)
- Decarbonization (160)
- Demand (110)
- Digital (60)
- Downstream (44)
- Economic Model (205)
- Energy Efficiency (75)
- Hydrogen (63)
- Industry Data (279)
- LNG (48)
- Materials (82)
- Metals (80)
- Midstream (43)
- Natural Gas (149)
- Nature (76)
- Nuclear (23)
- Oil (164)
- Patents (38)
- Plastics (44)
- Power Grids (130)
- Renewables (149)
- Screen (117)
- Semiconductors (32)
- Shale (51)
- Solar (68)
- Supply-Demand (45)
- Vehicles (90)
- Wind (44)
- Written Research (354)