Search results for: “volatility volatile”
-
Renewables: share of global energy and electricity by country?
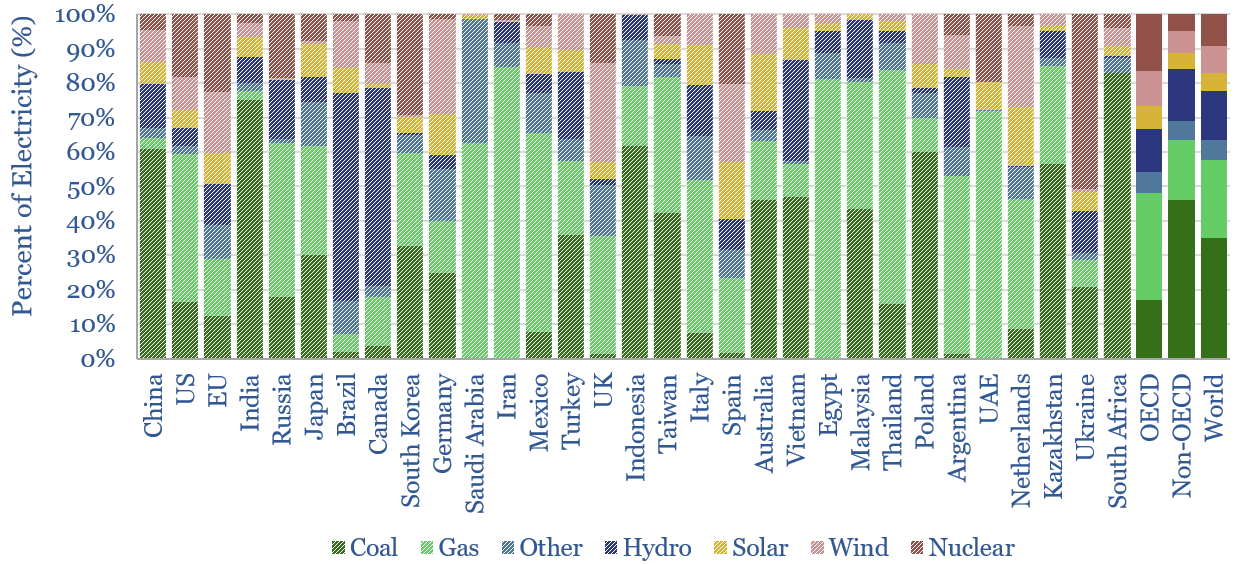
This data-file is an Excel “visualizer” for some of the key headline metrics in global energy: such as total global energy use, electricity generation by source and growing renewables penetration; broken down country-by-country, and showing how these metrics have changed over time.
-
Storage tank costs: storing oil, energy, water and chemicals?
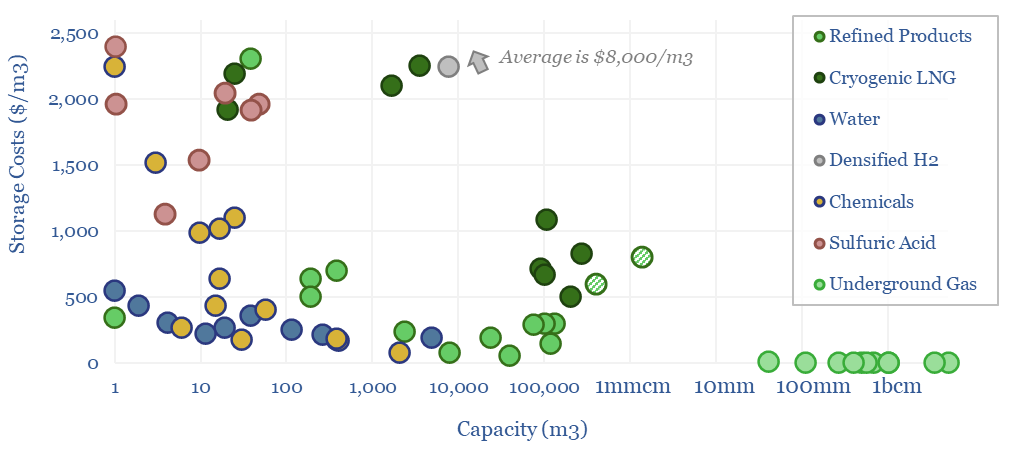
Storage tank costs are tabulated in this data-file, averaging $100-300/m3 for storage systems of 10-10,000 m3 capacity. Costs are 2-10x higher for corrosive chemicals, cryogenic storage, or very large/small storage facilities. Some rules of thumb are outlined below with underlying data available in the Excel.
-
Solar variability: how much does solar energy vary by year?
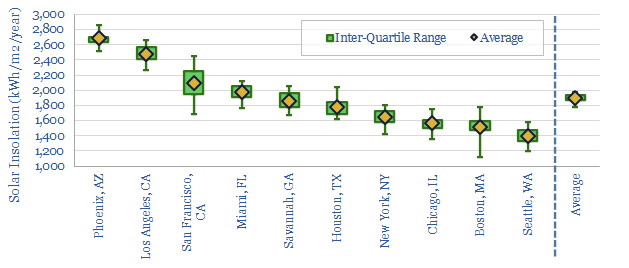
This data-file aggregates the average annual volatility of solar (and wind) resources across ten locations, mainly cities, in the United States. Annual volatility of incoming solar energy reaching ground level tends to vary by +/- 6% per year, is 96% correlated across different locations within that city, and 50-70% correlated with other cities in the…
-
Solar power: the economics?
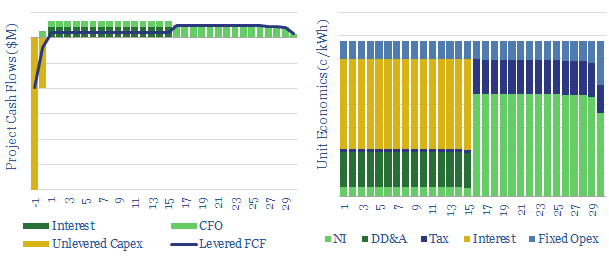
Levelized costs of solar electricity are estimated at 7c/kWh in our base case, but can realistically range from 4-40c/kWh. This data-file is a breakdown of solar costs, as a function of capex, opex, insolation, curtailment and decline rates. Solar can be highly competitive, up to 35-50% of many power grids.
-
Renewable grids: solar, wind and grid-scale battery sizing?
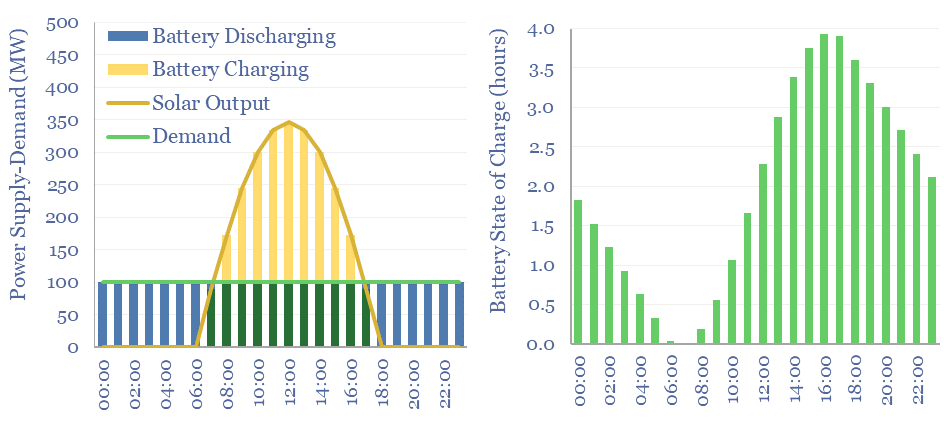
How much wind, solar and/or batteries are required to supply a stable power output, 24-hours per day, 7-days per week, or at even longer durations? This data-file stress-tests different scenarios, with each 1MW of average load requiring at least 3.5MW of solar and 3.5MW of lithium ion batteries, for a total system cost of at…
-
Costs of biogas upgrading to biomethane?
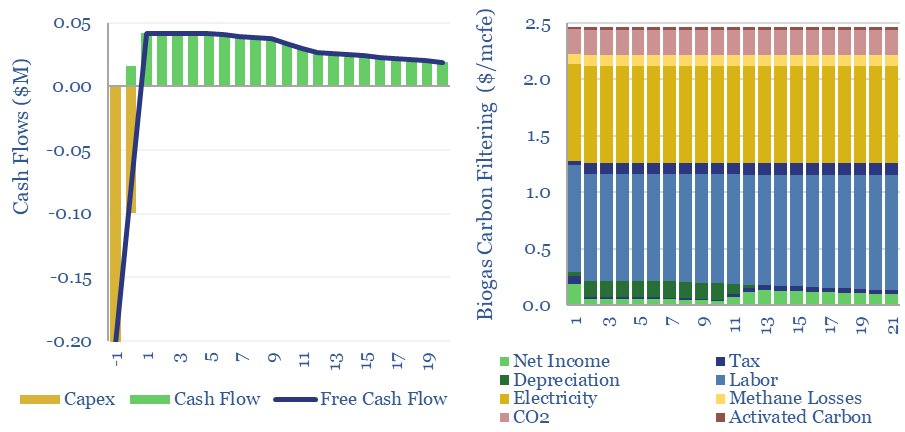
Costs of biogas upgrading into biomethane are estimated at $7/mcf off of capex cost of $400/ton, in this data-file. The largest contributor to total costs is carbon filtering, to remove siloxanes, VOCs and H2S, which we have modelled from first principles, at $2/mcfe. Underlying data into biogas compositions and impurities are also tabulated for reference.
-
Coal grades: what CO2 intensity?
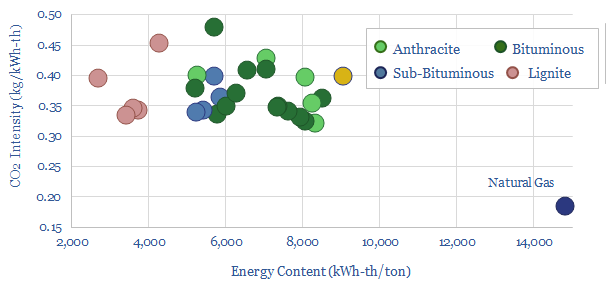
The CO2 intensity of coal is estimated at 0.37kg/kWh of thermal energy, at a typical coal grade comprising 63% carbon and 6,250 kWh/ton of energy content. This is the average across 25 samples in our data-file, while moisture, ash and sulphur are also appraised. Coal is 2x more CO2 intensive than natural gas.
-
Grid-scale battery operation: a case study?
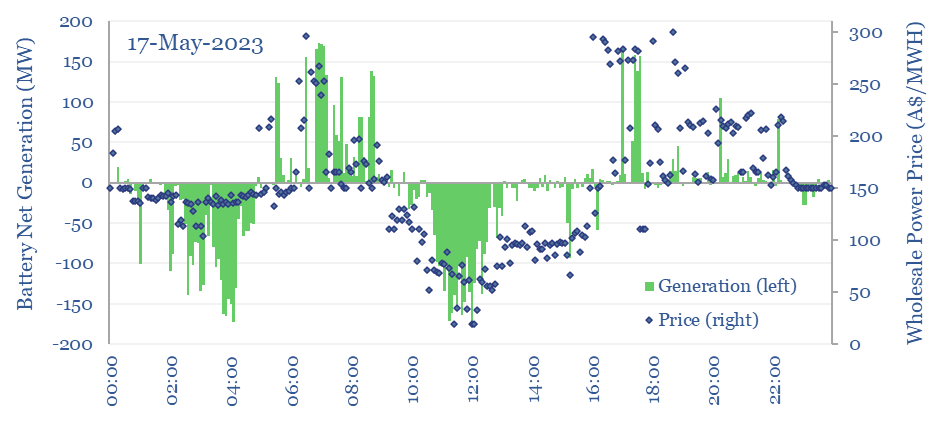
Grid-scale batteries are not simply operated to store up excess renewables and move them to non-windy and non-sunny moments, in order to increase reneawble penetration rates. Their key practical rationale is providing short-term grid stability to increasingly volatile grids that need ‘synthetic inertia’. Their key economic rationale is arbitrage. Numbers are borne out by our…
-
Energy transition: top commodities?
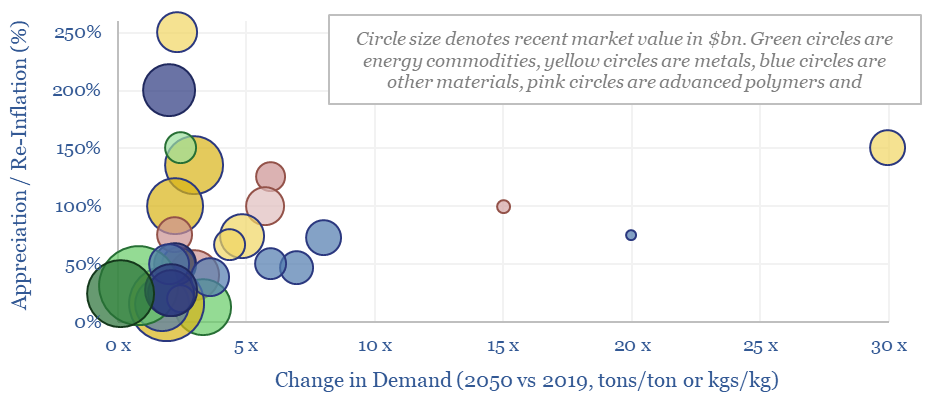
This data-file summarizes our latest thesis on ten commodities with upside in the energy transition. The average one will see demand rise by 3x and price/cost appreciate or re-inflate by 100%. The data-file contains a 6-10 line summary of our work into each commodity.
-
California’s grid: wind and solar statistical distributions?
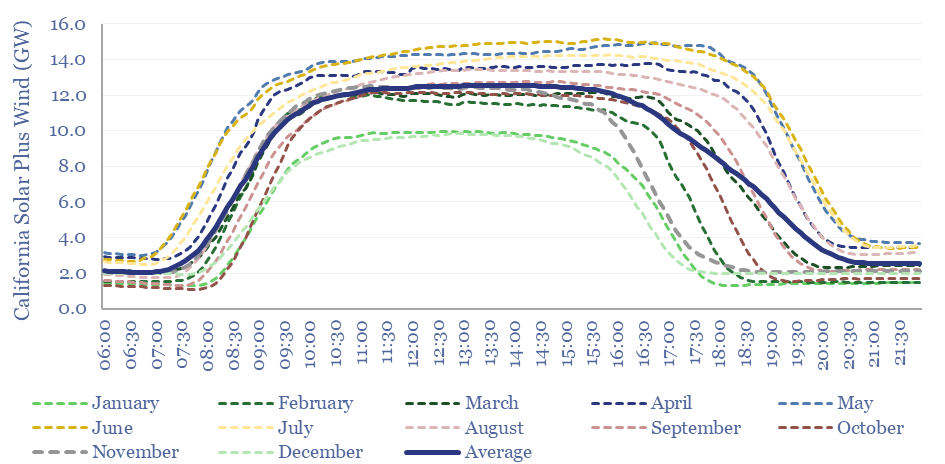
This data-file aggregates the statistical distribution of total electricity demand, solar generation and wind generation, every 5-minutes, across California, for the entirety of 2022, in order to understand their volatility and curtailment rates. The data suggest that wind and solar will most likely peak at 50-55% of renewables-heavy grids.
Content by Category
- Batteries (89)
- Biofuels (44)
- Carbon Intensity (49)
- CCS (63)
- CO2 Removals (9)
- Coal (38)
- Company Diligence (95)
- Data Models (840)
- Decarbonization (160)
- Demand (110)
- Digital (60)
- Downstream (44)
- Economic Model (205)
- Energy Efficiency (75)
- Hydrogen (63)
- Industry Data (279)
- LNG (48)
- Materials (82)
- Metals (80)
- Midstream (43)
- Natural Gas (149)
- Nature (76)
- Nuclear (23)
- Oil (164)
- Patents (38)
- Plastics (44)
- Power Grids (130)
- Renewables (149)
- Screen (117)
- Semiconductors (32)
- Shale (51)
- Solar (68)
- Supply-Demand (45)
- Vehicles (90)
- Wind (44)
- Written Research (354)