Search results for: “volatility volatile”
-
Solar trackers: following the times?

Solar trackers are worth $10bn pa. They typically raise solar revenues by 30%, earn 13% IRRs on their capex costs, and lower LCOEs by 0.4 c/kWh. But these numbers are all likely to double, as solar gains share, grids grow more volatile, and AI unlocks further optimizations? This 14-page report explores the theme and who…
-
Global biofuel production: by region, by liquid fuel?
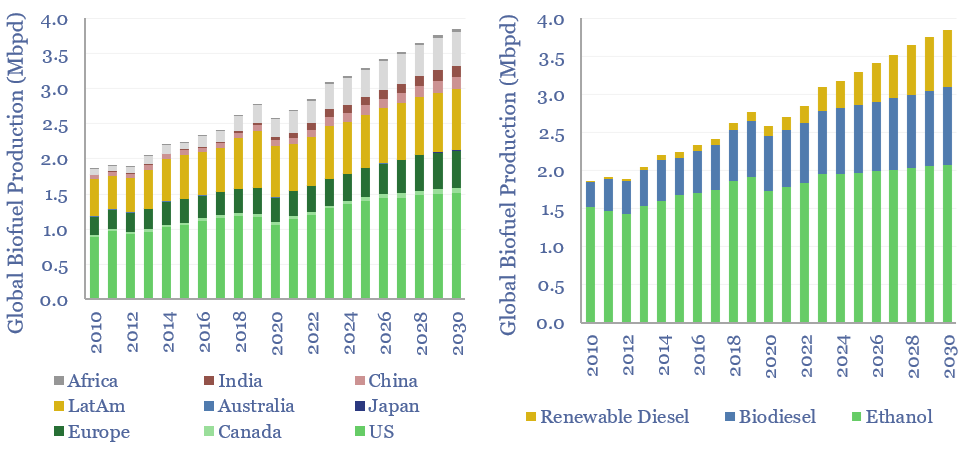
Global liquid biofuel production ran at 3.2Mbpd in 2024, of which c60% is ethanol, c30% is biodiesel and c10% is renewable diesel. 65% of global production is from the US and Brazil. Global liquid biofuel production reaches 3.8Mbpd by 2030 on our forecasts.
-
Australia energy supply-demand model?
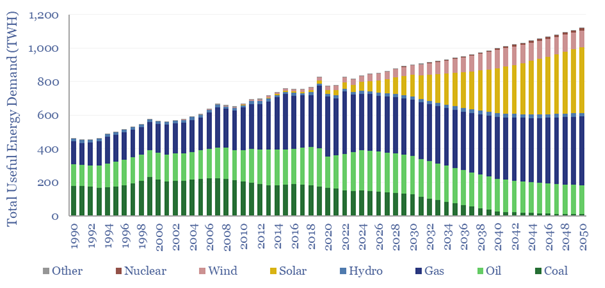
Australia’s useful energy consumption rises from 820TWH pa in 2023, by 1.2% pa 1,100 TWH pa in 2050. As a world-leader in renewables, it makes for an interesting case study. This Australia energy supply-demand model is disaggreated across 215 line items, broken down by source, by use, from 1990 to 2023, and with our forecasts…
-
Residential energy prices: reasons for optimism?
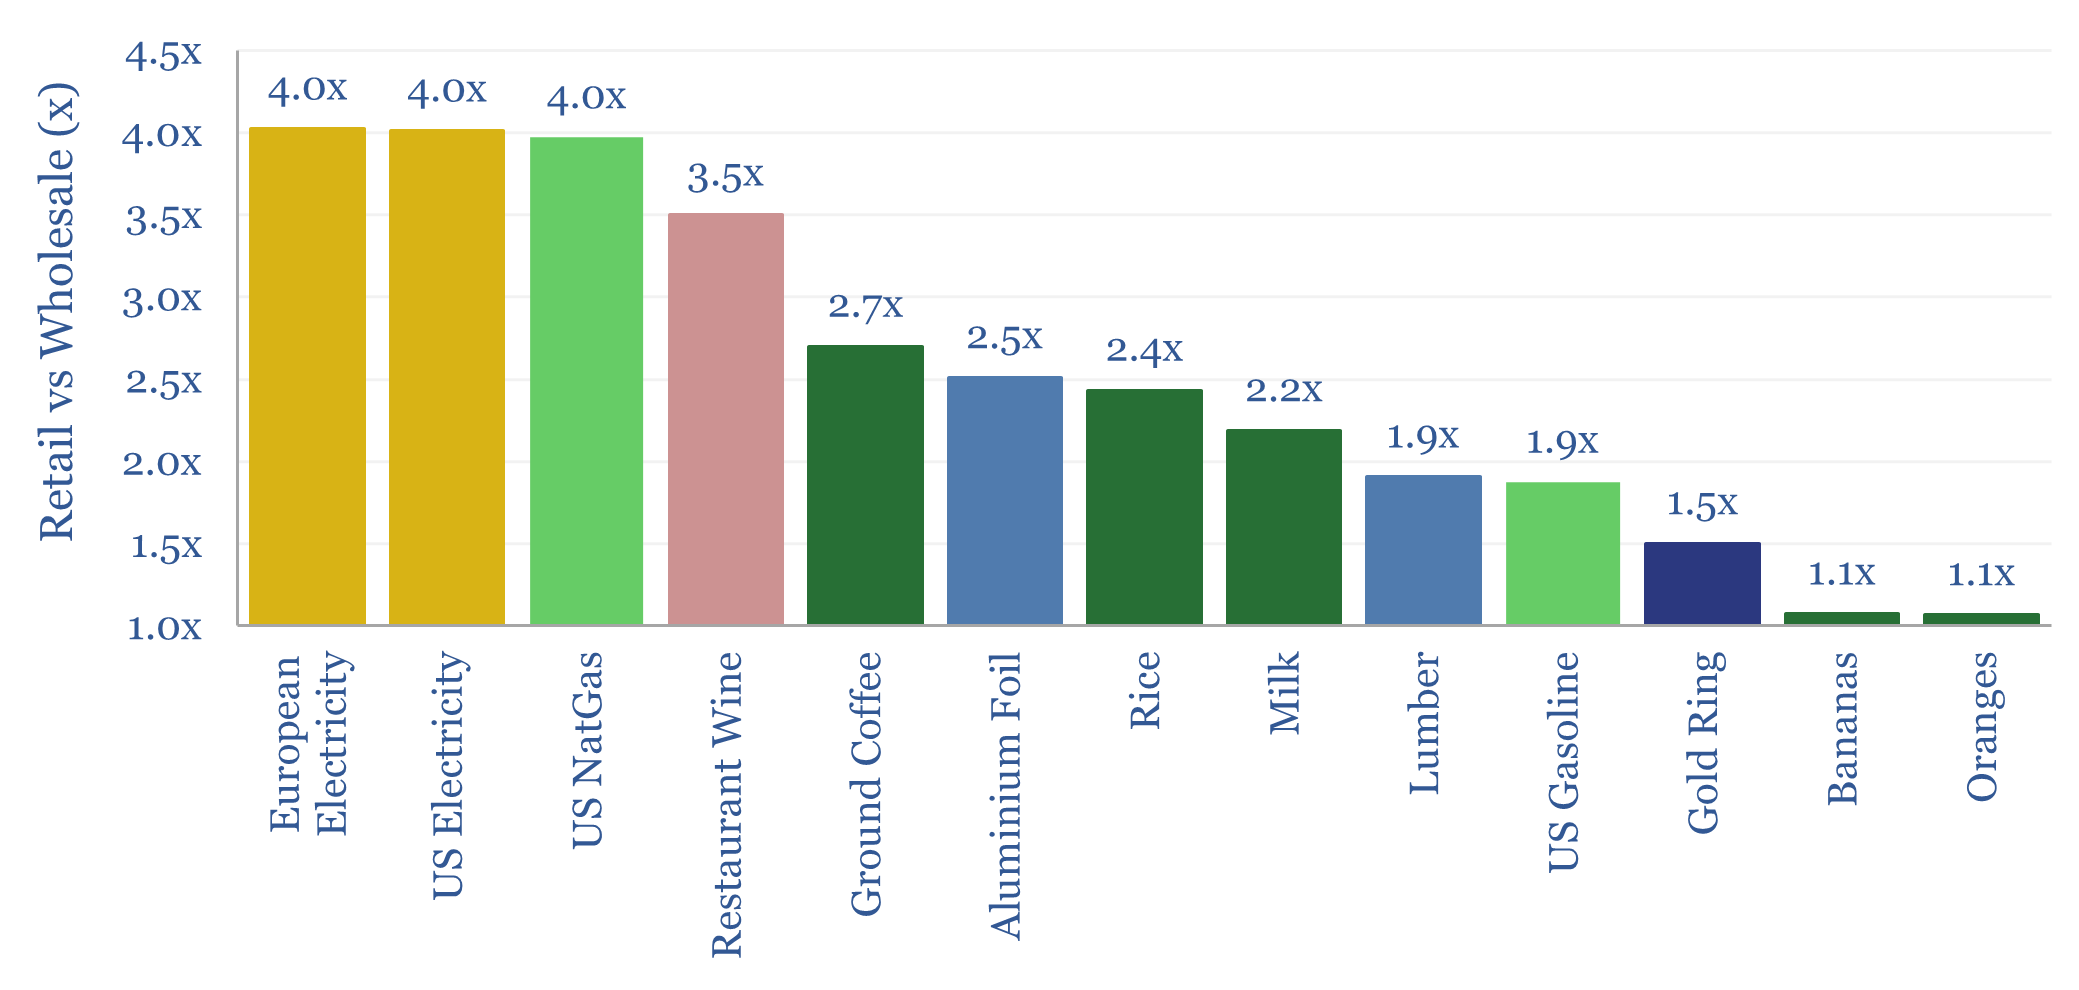
Residential energy prices tend to run 4x higher than underlying wholesale energy prices. This is a very wide margin, as by contrast, typical commoditized products in supermarkets are usually only marked up by about 2x, compared to their wholesale prices. Today’s data-file compares retail prices vs wholesale prices across a dozen different categories. A remarkable…
-
Computer memory: aide memoire?
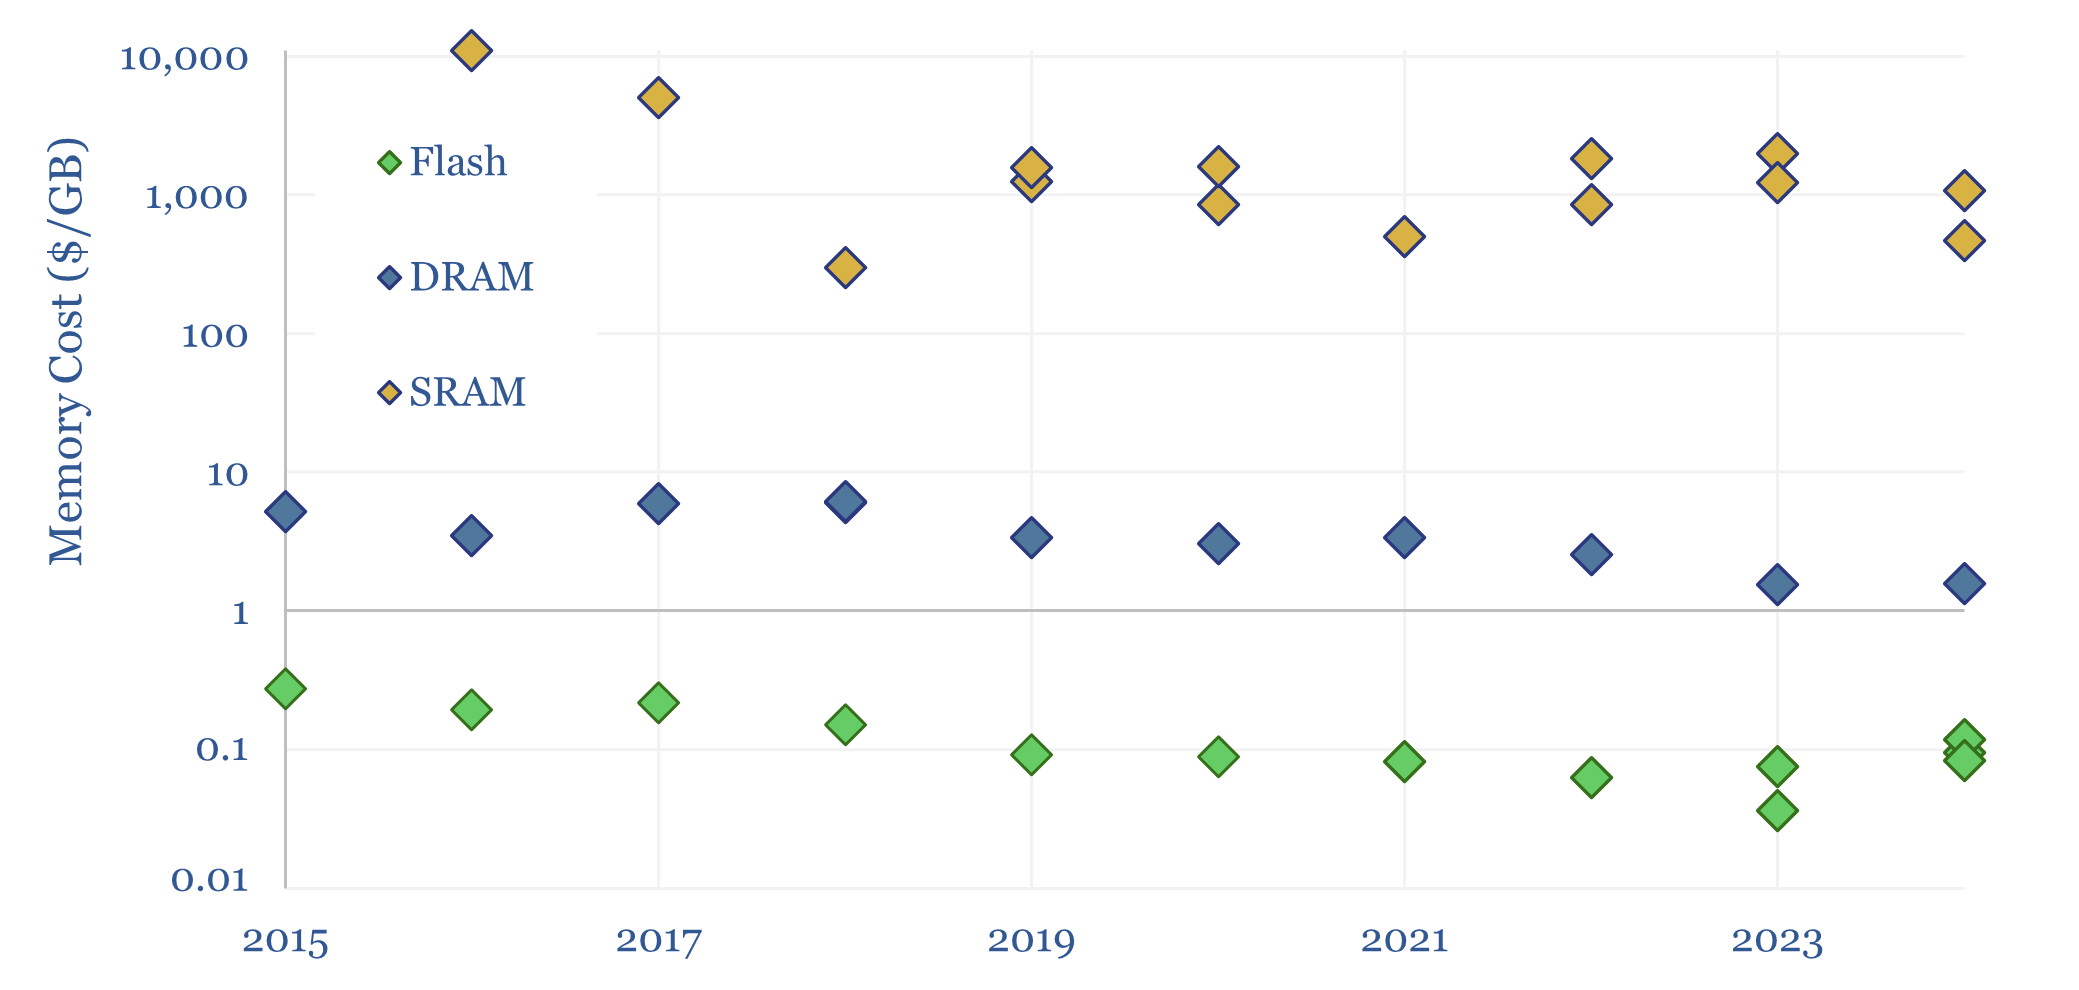
Three types of computer memory dominate modern information processing: Flash, DRAM and SRAM. This 5-page note simply covers each one, how it works, what it costs, advantages, disadvantages, market sizes and leading companies. AI likely boosts all three, but can more SRAM unlock big efficiency gains?
-
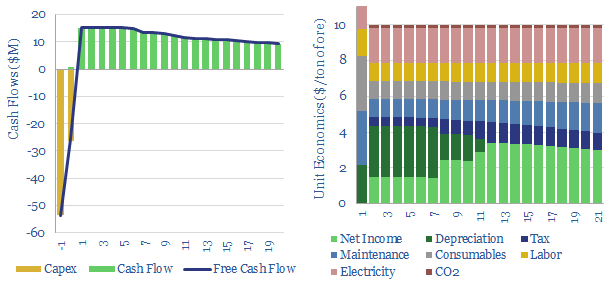
Biogas: the economics?
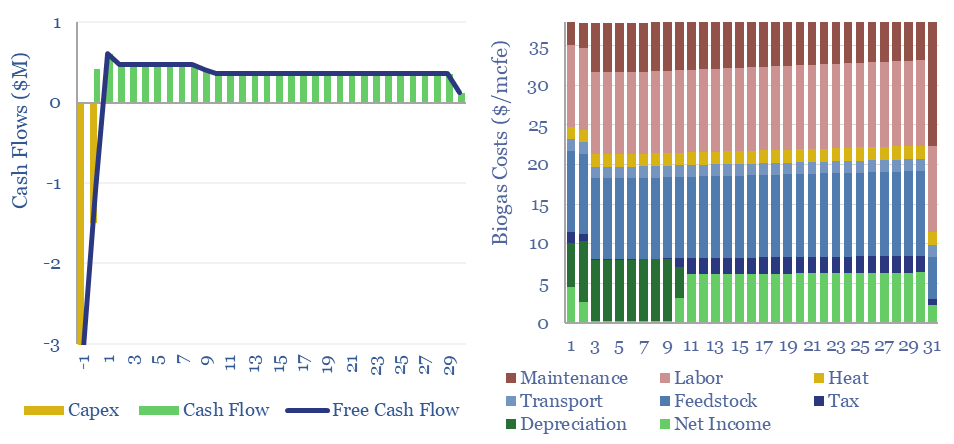
Biogas costs are broken down in this economic model, generating a 10% IRR off $180M/kboed capex, via a mixture of $16/mcfe gas sales, $60/ton waste disposal fees and $50/ton CO2 prices. High gas prices and landfill taxes can make biogas economical in select geographies. Although diseconomies of scale reward smaller projects?
-
US gas transmission: by company and by pipeline?
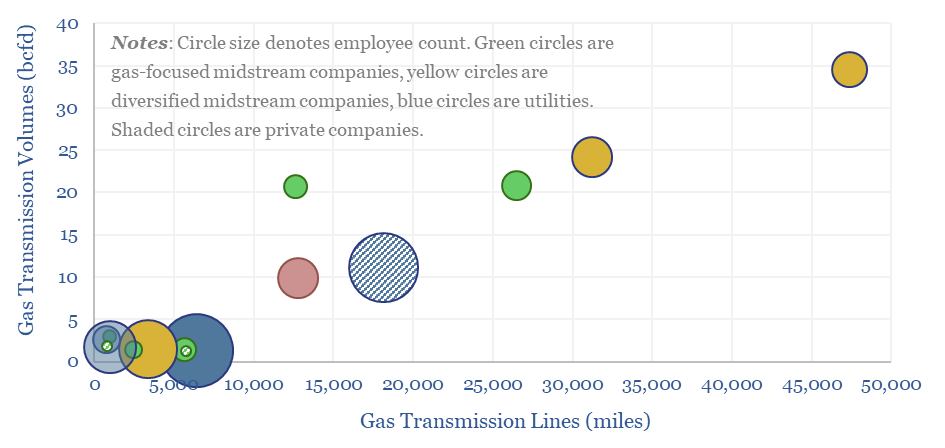
This data-file aggregates granular data into US gas transmission, by company and by pipeline, for 40 major US gas pipelines which transport 45TCF of gas per annum across 185,000 miles; and for 3,200 compressors at 640 related compressor stations.
-
US gas power: generation by facility over time?
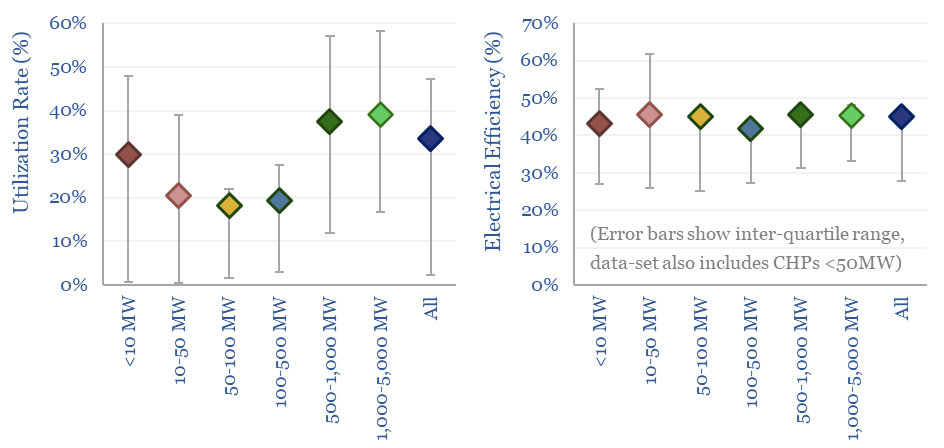
US gas power generation by facility is broken down in this data-file, across 1,850 active gas-power plants, supplying 40% of all US electricity. Descriptive statistics are available in the summary tab, a state-by-state breakdown follows in the PlantsByState tab and underlying data on all 3,000 historical facilities are provided in the AllGasPlants tab.
-
Electric arc furnaces for lower-carbon steel production?
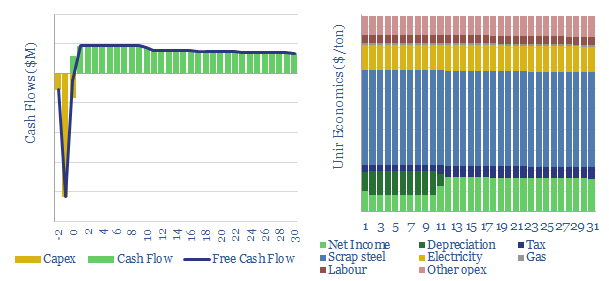
Electric arc furnaces generate enormous amounts of heat to recycle scrap steel, with 85% lower CO2 emissions than primary steel production. Our base case model yields a 15% IRR at $475/ton steel prices and a 10c/kWh power price. However, IRRs could be uplifted 2-6pp by integrating with renewables.
-
Mining: crushing, grinding and comminution costs?
Mining crushing-grinding costs are typically $10/ton of ore, breaking 3-10cm rubble into 30-100 micron powders. Capex averages $20/Tpa and energy cost averages 20kWh/ton.
Content by Category
- Batteries (87)
- Biofuels (42)
- Carbon Intensity (49)
- CCS (63)
- CO2 Removals (9)
- Coal (38)
- Company Diligence (90)
- Data Models (816)
- Decarbonization (159)
- Demand (108)
- Digital (56)
- Downstream (44)
- Economic Model (197)
- Energy Efficiency (75)
- Hydrogen (63)
- Industry Data (273)
- LNG (48)
- Materials (79)
- Metals (71)
- Midstream (43)
- Natural Gas (146)
- Nature (76)
- Nuclear (22)
- Oil (162)
- Patents (38)
- Plastics (44)
- Power Grids (123)
- Renewables (149)
- Screen (112)
- Semiconductors (30)
- Shale (51)
- Solar (67)
- Supply-Demand (45)
- Vehicles (90)
- Wind (43)
- Written Research (345)