Search results for: “volatility volatile”
-
Solar insolation: by latitude, season, date, time and tilt?
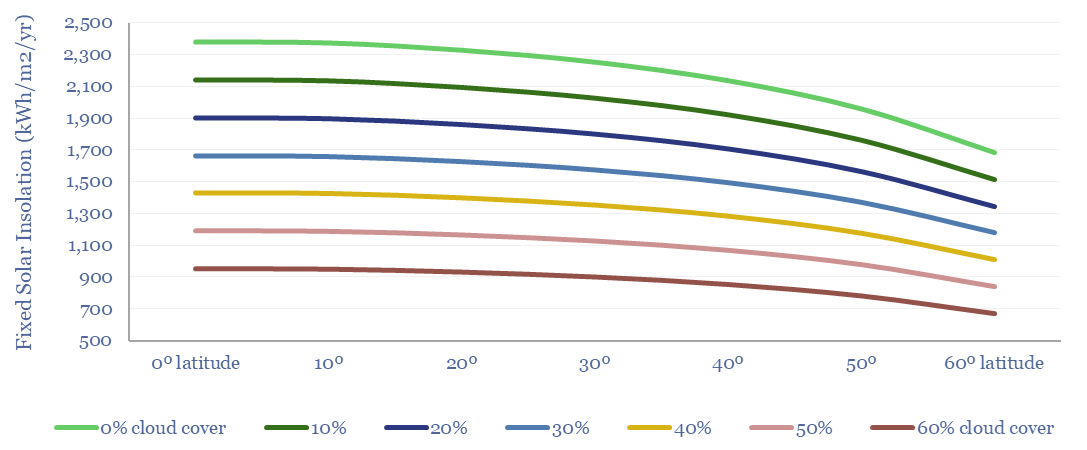
Solar insolation varies from 600-2,500 kWh/m2/year at different locations on Earth, depending on their latitude, altitude, cloudiness, panel tilt and panel azimuth. This means the economics of solar can also vary by a factor of 4x. Seasonality is a key challenge at higher latitudes. Active strategies are emerging for orienting solar modules.
-
Purchasing power: what are generation assets worth?
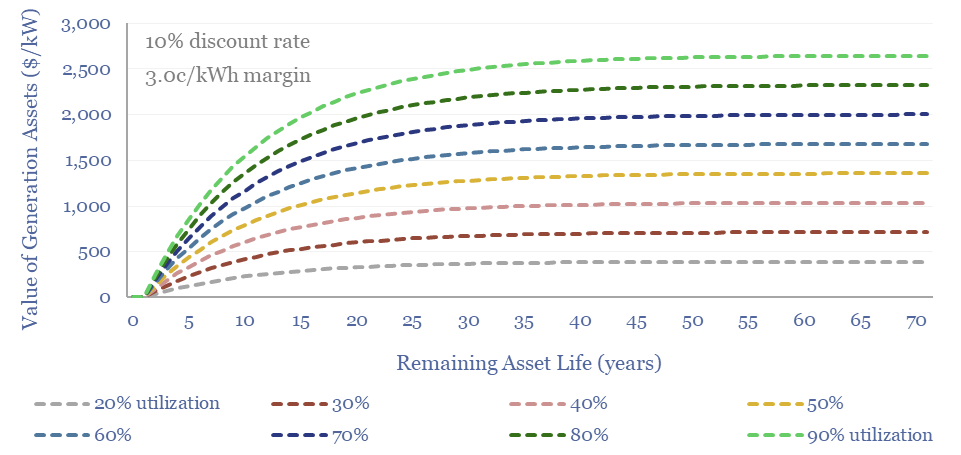
There has never been more controversy over the fair values of power generation assets, which hinge on their remaining life, utilization, flexibility, power prices, rising grid volatility and CO2 credentials. This 16-page guide covers the fair values of generation assets, hidden opportunities and potential pitfalls.
-
Energy transition: key conclusions from 1Q24?
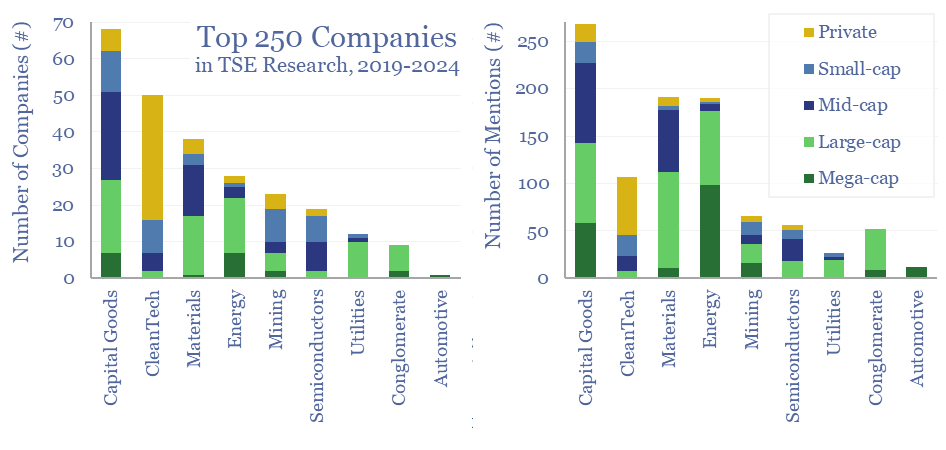
This note summarizes the key conclusions from our energy transition research in 1Q24 and across 1,400 companies in total. Volatility is rising. Power grids are bottlenecked. Hence what stands out in capital goods, clean-tech, solar, gas value chains and materials? And what is most overlooked?
-
Peaker plants: finding the balance?
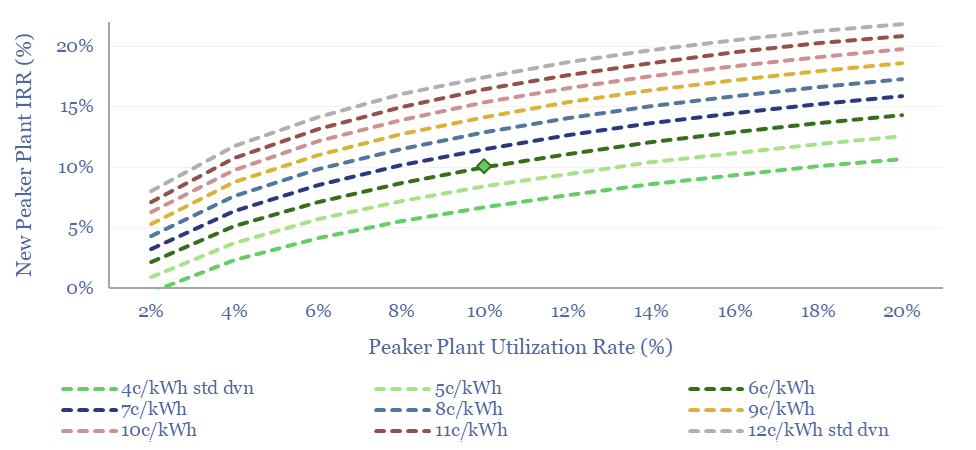
Today’s power grids fire up peaker plants to meet peak demand. But the grid is changing rapidly. Hence this 17-page report outlines the economics of gas peaker plants. Rising volatility will increase earnings and returns by 40-50%, before grid-scale batteries come into the money for peaking?
-
Global gas supply-demand in energy transition?
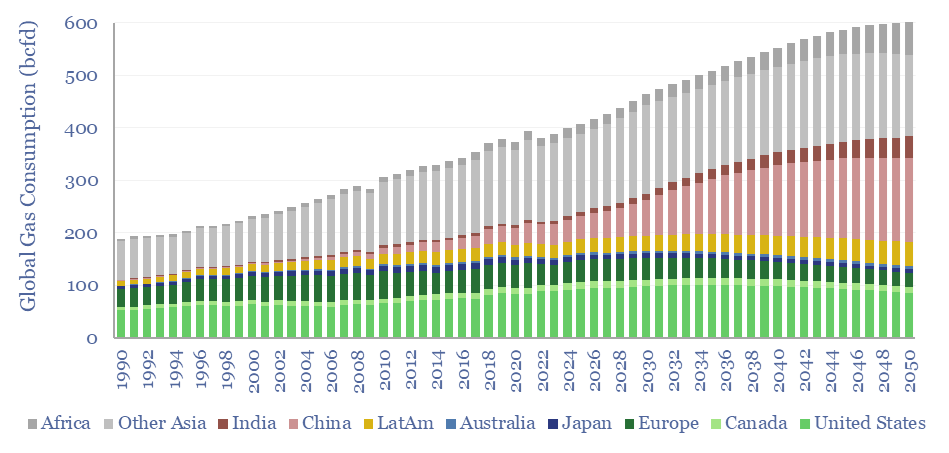
Global gas supply-demand is predicted to rise from 400bcfd in 2023 to 600bcfd by 2050, in our outlook, while achieving net zero would require ramping gas even further to 800bcfd, as a complement to wind, solar, nuclear and other low-carbon energy. This data-file quantifies global gas demand and supply by country.
-
US shale: outlook and forecasts?
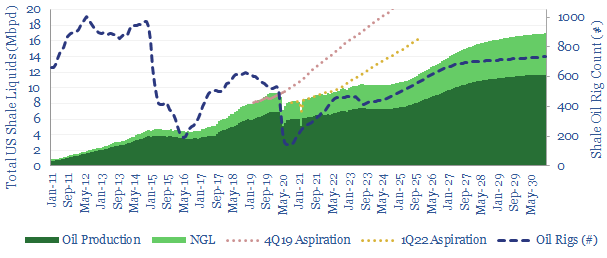
This model sets out our US shale production forecasts by basin. It covers the Permian, Bakken and Eagle Ford, as a function of the rig count, drilling productivity, completion rates, well productivity and type curves. US shale likely adds +1Mbpd/year of production growth from 2023-2030, albeit flatlining in 2024, then re-accelerating on higher oil prices?
-
Gas power: levelized costs of combined cycle gas turbines?
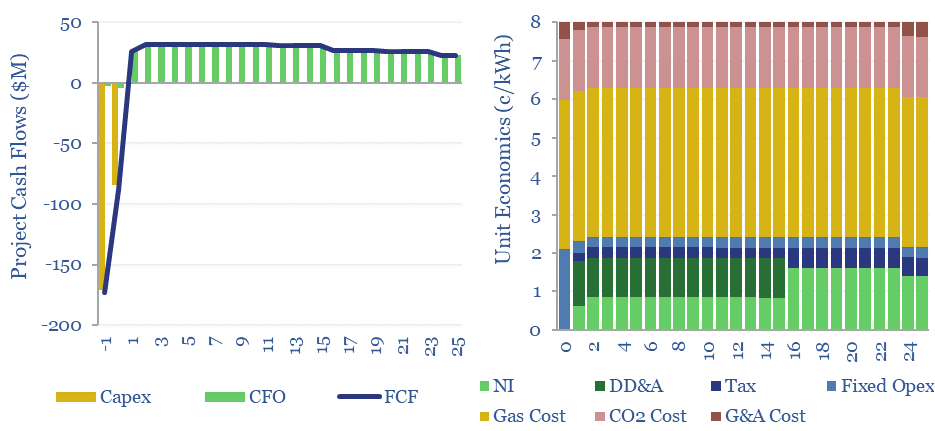
Levelized costs of combined cycle gas turbines are built up in this data-file. Our base case costs of gas-fired power generation are 8c/kWh, at a combined cycle turbine converting 55% of the thermal energy of natural gas into electrical energy, for a total CO2 intensity of 0.35 kg/kWh.
-
Scaling Up Renewables and Batteries
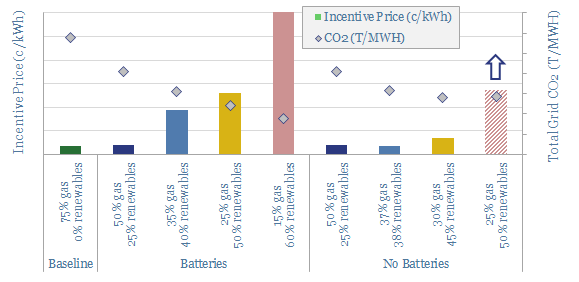
Renewables would cap out at 40-50% of inflexible electricity grids, based on Monte Carlo analysis of wind, solar and batteries. Beyond 50%, new renewables’ curtailment rates surpass 70%, trebling their marginal cost. Batteries also increase incentive prices by 5-25x. Natural gas and demand-shifting are the best backstops.
-
Green hydrogen: the economics?
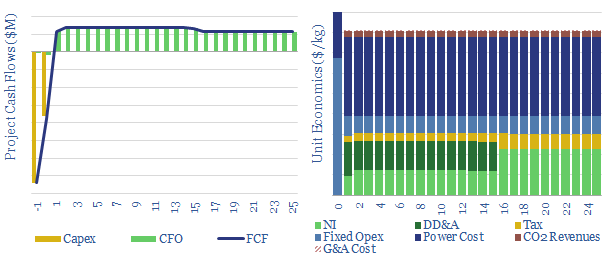
We have modelled the economics of a green hydrogen project, electrolysing water using renewable energy. An H2 price of $8/kg ($60/mcfe) is required to earn a 10% return. Costs data are captured. The most challenging input variable is not capex cost or efficiency, but utilization rate, if the project is to be truly green.
-
Levelized cost of electricity: stress-testing LCOE?
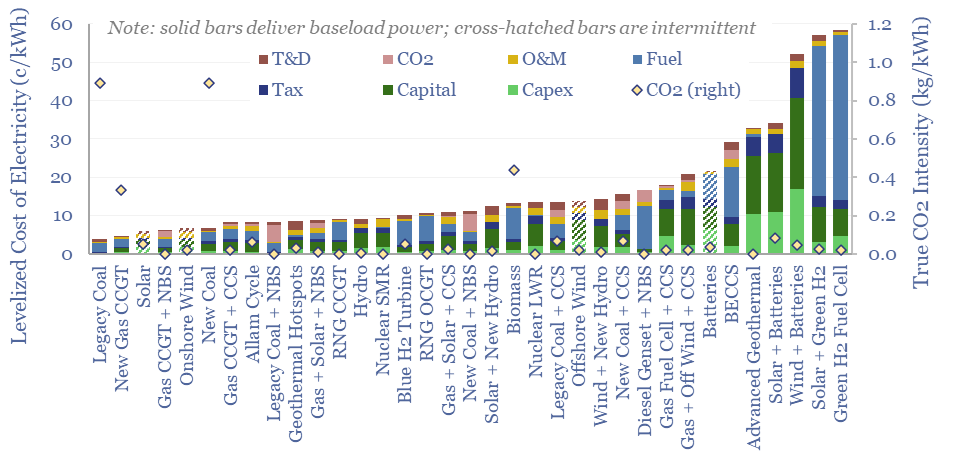
This data-file summarizes the levelized cost of electricity, across 35 different generation sources, covering 20 different data-fields for each source. Costs of generating electricity can vary from 2-200 c/kWh. The is more variability within categories than between them. Numbers can readily be stress-tested in the data-file.
Content by Category
- Batteries (87)
- Biofuels (42)
- Carbon Intensity (49)
- CCS (63)
- CO2 Removals (9)
- Coal (38)
- Company Diligence (90)
- Data Models (816)
- Decarbonization (159)
- Demand (108)
- Digital (56)
- Downstream (44)
- Economic Model (197)
- Energy Efficiency (75)
- Hydrogen (63)
- Industry Data (273)
- LNG (48)
- Materials (79)
- Metals (71)
- Midstream (43)
- Natural Gas (146)
- Nature (76)
- Nuclear (22)
- Oil (162)
- Patents (38)
- Plastics (44)
- Power Grids (123)
- Renewables (149)
- Screen (112)
- Semiconductors (30)
- Shale (51)
- Solar (67)
- Supply-Demand (45)
- Vehicles (90)
- Wind (43)
- Written Research (345)