Search results for: “volatility”
-
Overview of inertia in renewable-heavy grids?
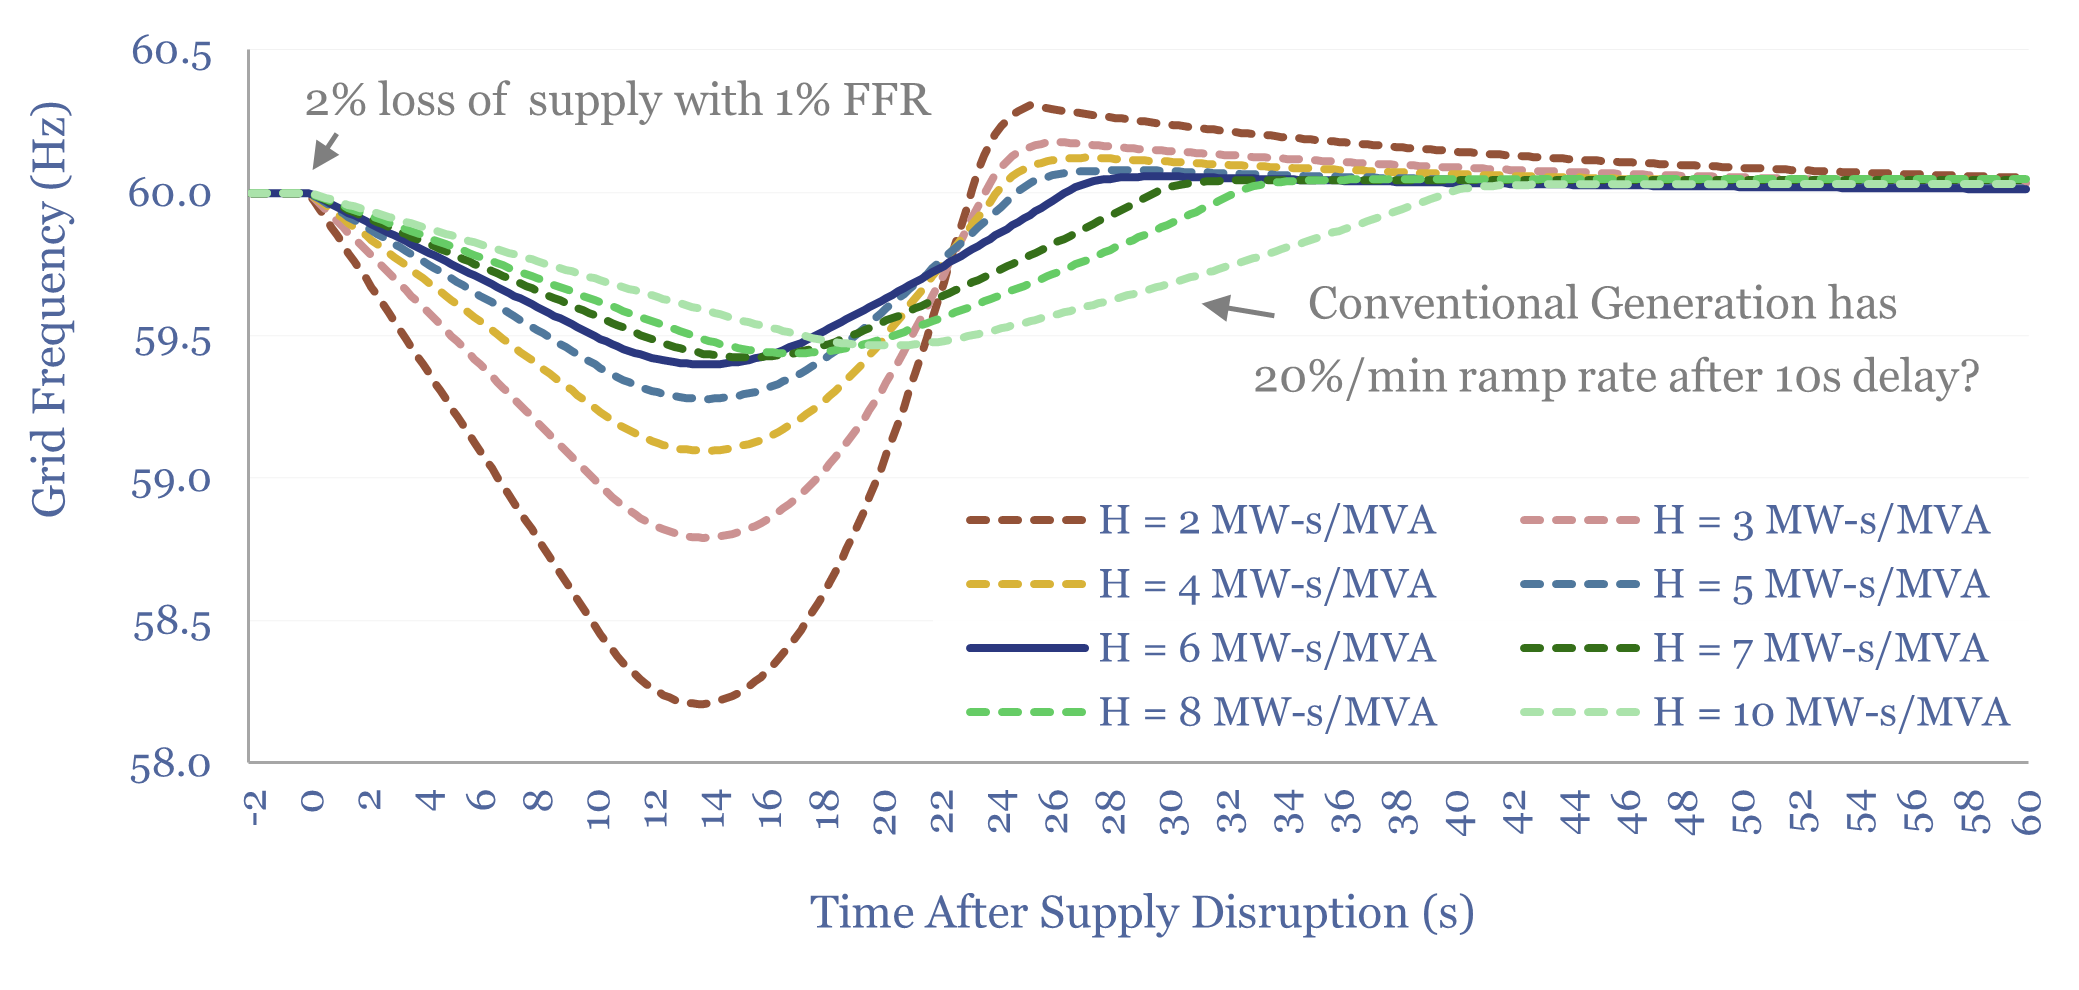
This overview of inertia in renewable-heavy grids tabulates the typical inertia of rotating generators, then models the resultant Rate of Change of Frequency (ROCOF) during supply disruptions. In our base case, a grid with 6 MW-s/MVA of inertia rides through a 2% supply-disruption, buffered by 1% fast frequency response (FFR), via lowering grid frequency from…
-
Gas peaker plants: the economics?
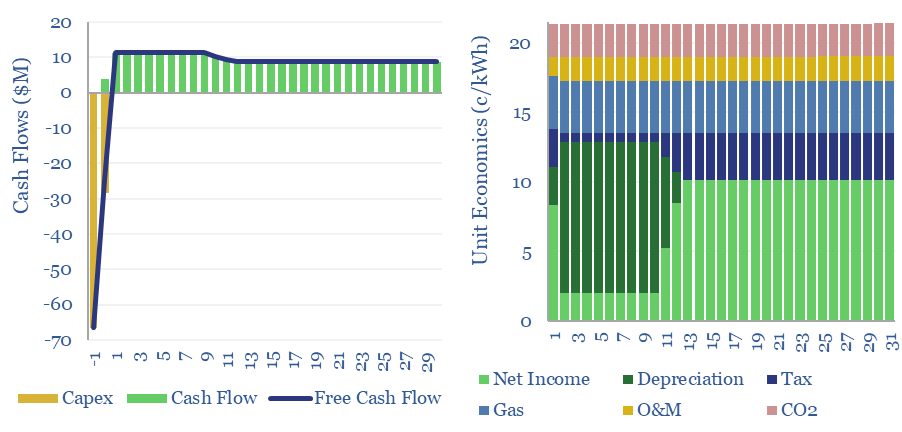
Gas peaker plants run at low utilizations of 2-20%, during times of peak demand in power grids. A typical peaker costing $950/kW and running at 10% utilization has a levelized cost of electricity around 20c/kWh, to generate a 10% IRR with 0.5 kg/kWh of CO2 intensity. This data-file shows the economic sensitivities to volatility and…
-
Demand shifting: electrical flexibility by industry?
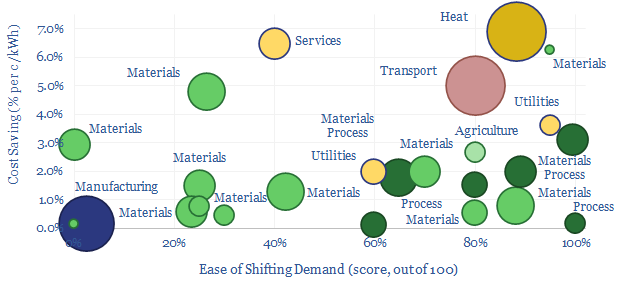
Demand shifting flexes electrical loads in a power grid, to smooth volatility and absorb more renewables. This database scores technical potential and economical potential of different electricity-consuming processes to shift demand, across materials, manufacturing, industrial heat, transportation, utilities, residential HVAC and commercial loads.
-
Load bearing: will solar+gas be cheaper than gas alone?
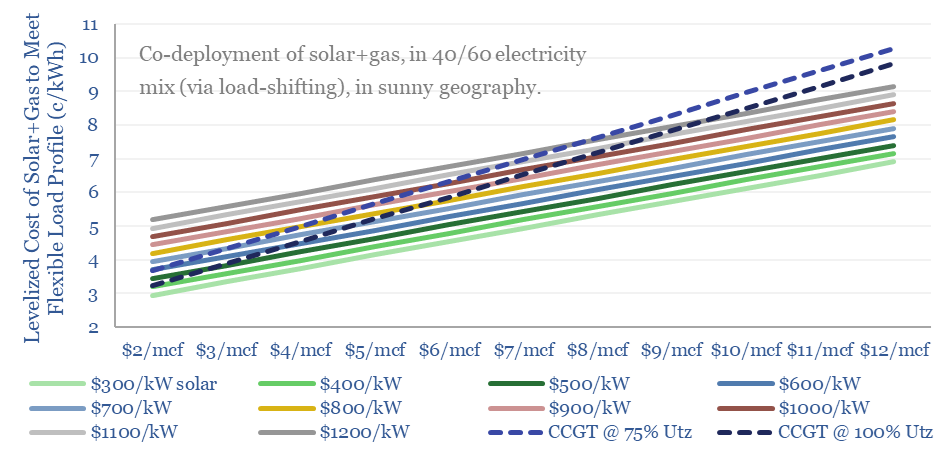
The costs to power a real-world load – e.g., a data center – with solar+gas will very often be more expensive than via a standalone gas CCGT in the US today. But not internationally? Or in the future? This 9-page note shows how solar deflation and load shifting can boost solar to >40% of future…
-
Coal-to-gas switching: what CO2 abatement cost?
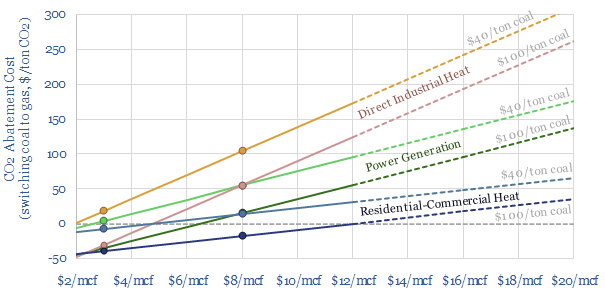
Coal-to-gas switching halves the CO2 emissions per unit of primary energy. This data-file estimates the CO2 abatement costs. Gas is often more expensive than coal. But as a rule of thumb, a $30-60/ton CO2 price makes $6-8/mcf gas competitive with $60-80/ton coal. CO2 abatement costs are materially lower in the US and after reflecting efficiency.…
-
Solar variability: how much does solar energy vary by year?
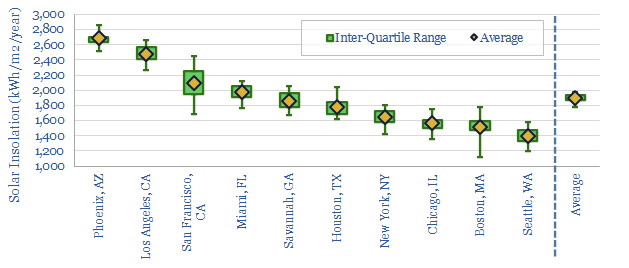
This data-file aggregates the average annual volatility of solar (and wind) resources across ten locations, mainly cities, in the United States. Annual volatility of incoming solar energy reaching ground level tends to vary by +/- 6% per year, is 96% correlated across different locations within that city, and 50-70% correlated with other cities in the…
-
Solar power: the economics?
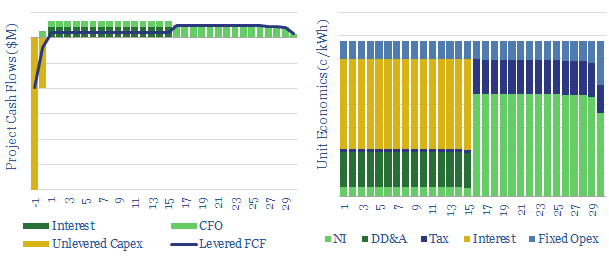
Levelized costs of solar electricity are estimated at 7c/kWh in our base case, but can realistically range from 4-40c/kWh. This data-file is a breakdown of solar costs, as a function of capex, opex, insolation, curtailment and decline rates. Solar can be highly competitive, up to 35-50% of many power grids.
-
Coal power generation: minute-by-minute flexibility?
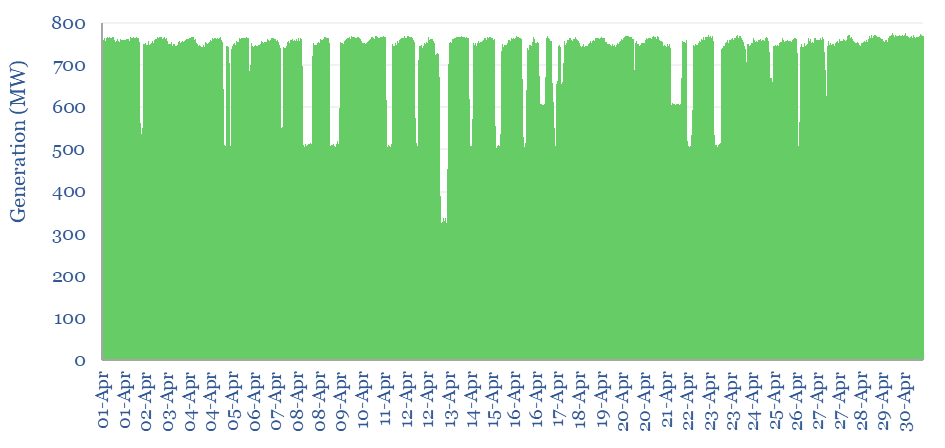
Coal power generation is aggregated in this data-file, at the largest single-unit coal power plant in Australia, across five-minute intervals, for the whole of 2023. The Kogan Creek coal plant produces stable baseload power, with average utilization rate of 85%. But it exhibits lower flexibility to backstop renewables than gas-fired generation.
-
Renewable grids: solar, wind and grid-scale battery sizing?
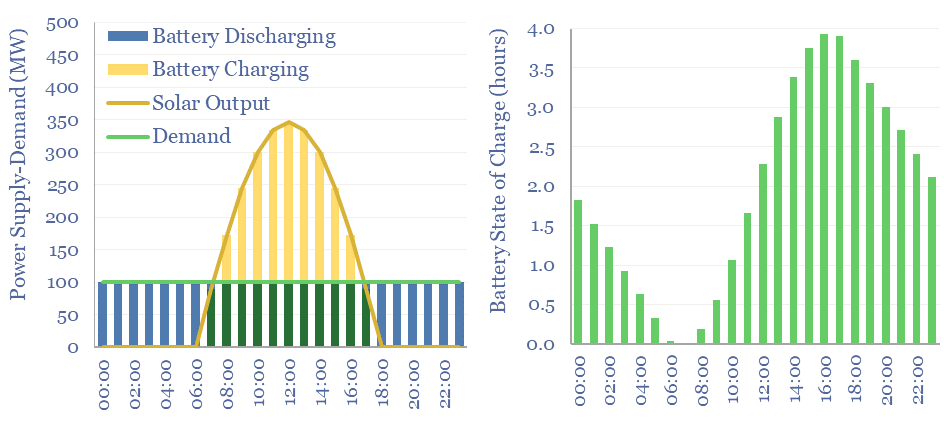
How much wind, solar and/or batteries are required to supply a stable power output, 24-hours per day, 7-days per week, or at even longer durations? This data-file stress-tests different scenarios, with each 1MW of average load requiring at least 3.5MW of solar and 3.5MW of lithium ion batteries, for a total system cost of at…
-
California power generation over time?
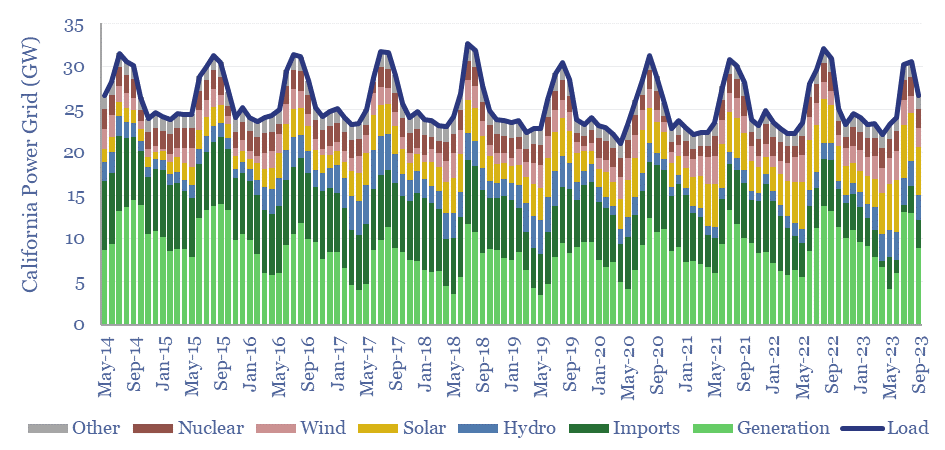
California’s power grid ranges from 26-61GW of demand. Utility scale solar has almost quadrupled in the past decade, rising from 5% to almost 20% of the grid. Yet it has not displaced thermal generation, which rose from 28% to 36% of the grid. We even wonder whether wind and solar are entrenching natural gas generators…
Content by Category
- Batteries (89)
- Biofuels (44)
- Carbon Intensity (49)
- CCS (63)
- CO2 Removals (9)
- Coal (38)
- Company Diligence (95)
- Data Models (840)
- Decarbonization (160)
- Demand (110)
- Digital (60)
- Downstream (44)
- Economic Model (205)
- Energy Efficiency (75)
- Hydrogen (63)
- Industry Data (279)
- LNG (48)
- Materials (82)
- Metals (80)
- Midstream (43)
- Natural Gas (149)
- Nature (76)
- Nuclear (23)
- Oil (164)
- Patents (38)
- Plastics (44)
- Power Grids (130)
- Renewables (149)
- Screen (117)
- Semiconductors (32)
- Shale (51)
- Solar (68)
- Supply-Demand (45)
- Vehicles (90)
- Wind (44)
- Written Research (355)