Biochar: burnt offerings?

Biochar in energy transition

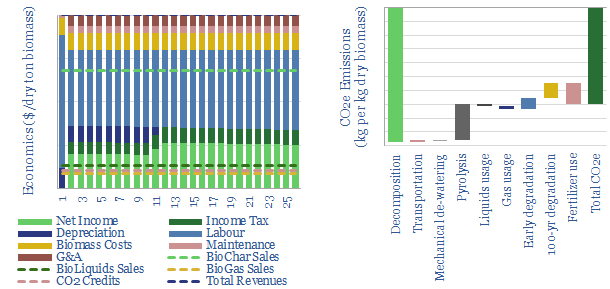
Biochar is a miraculous material, improving soils, enhancing agricultural yields and avoiding 1.4kg of net CO2 emissions per kg of waste biomass (that would otherwise have decomposed). IRRs surpass 20% without CO2 prices or policy support. Hence this 18-page note outlines the opportunity, leading companies and a disruption of biofuels?


Biochar is presented as a miracle material by its proponents, improving water and nutrient retention in soils by 20% and crop yields by at least 10%. We review technical papers in support of biochar on pages 2-3.

Biochar pricing varies broadly today, however we argue biochar can earn its keep at a price in the thousands of dollars per ton, based on its agricultural benefits (pages 4-5).

The production process is described in detail on pages 6-8, reviewing different reactor designs, their resultant product mixes, their benefits and their drawbacks.

Economics are laid out on pages 9-10, outlining how IRRs will most likely surpass 20%, on our numbers. Sensitivity analysis shows upside and downside risks.

Carbon credentials are debated on pages 11-12, using detailed carbon accounting principles. Converting each kg of dry biomass into biochar avoids 1.4kg of CO2 emissions.

We are de-risking over 2GTpa of CO2 sequestration, as the biochar market scales up by 2050. There is upside to 6GTpa, if fully de-risked, as discussed on pages 13-14.

Biofuels would be disrupted? We find much greater CO2 abatement is achieved converting biomass into biochar than converting biomass into biofuels. Hence pages 15-16 discuss an emerging competition for feedstocks.

Leading companies are profiled on pages 17-18, including names that stood out for our screening work.

Additional data-files. The economics of biochar production are modeled here. Companies producing biochar are screened here. The related theme of bio-coke is modeled here.

CO2-EOR: well disposed?

CO2-EOR economics to decarbonize oil

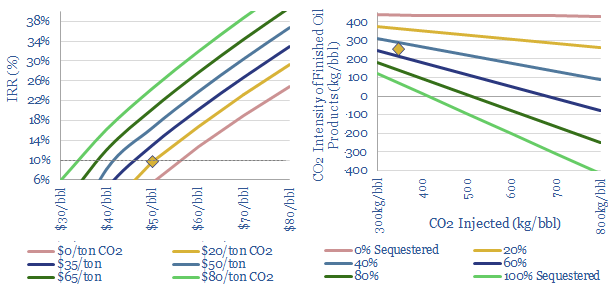
CO2-EOR is the most attractive option for large-scale CO2 disposal. Unlike CCS, which costs over $70/ton, additional oil revenues can cover the costs of sequestration. And the resultant oil is 50% lower carbon than usual, on a par with many biofuels; or in the best cases, carbon-neutral. The technology is fully mature and the ultimate potential exceeds 2GTpa. This 23-page report outlines the opportunity.


The rationale for CO2-EOR is to cover the costs of CO2 disposal by producing incremental oil. Whereas CCS is pure cost. These costs are broken down and discussed on pages 2-5.

An overview of the CO2-EOR industry to-date is presented on pages 6-7, drawing on data-points from technical papers.

Our economic model for CO2-EOR is outlined on pages 8-10, including a full breakdown of capex, opex, and sensitivities to oil prices and CO2 prices. Economics are generally attractive, but will vary case-by-case.

What carbon intensity for CO2-EOR oil? We answer this question on pages 11-12, including a debate on the carbon-accounting and a contrast with 20 other fuels.

The ultimate market size for CO2-EOR exceeds 2GTpa, of which half is in the United States. These numbers are outlined on pages 13-15.

Technical risks are low, as c170 past CO2-EOR projects have already taken place around the industry, but it is still important to track CO2 migration through mature reservoirs and guard against CO2 leakages, as discussed on pages 16-17.

How to source CO2? We find large scale and concentrated exhaust streams are important for economics, as quantified on pages 18-21.

Which companies are exposed to CO2-EOR? We profile two industry leaders on page 22.

What implications for reaching net zero? We have doubled our assessment of CO2-EOR’s potential in this report, helping to reduce the costs in our models of global decarbonization.

Carbon negative construction: the case for mass timber?
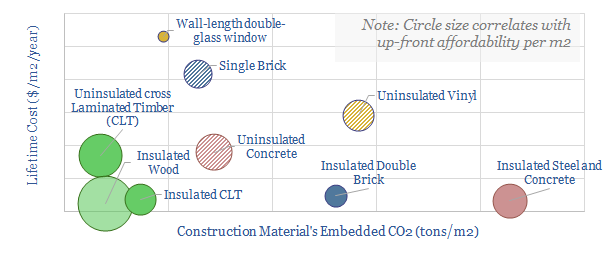
Cross laminated timber costs in carbon negative construction

The construction industry accounts for 10% of global CO2, mainly due to cement and steel. But mass timber could become a dominant new material for the 21st century, lowering emissions 15-80% at no incremental costs. Debatably mass timber is carbon negative if combined with sustainable forestry. This could disrupt global construction. This 17-page note outlines the opportunity and who benefits.


CO2 emissions of the construction industry are disaggregated on pages 2-3. Some options have been proposed to lower CO2 intensity, but most are costly.

Sustainable forestry also needs an outlet, as argued on pages 4-7. Younger forests grow more quickly, whereas mature forests re-release more CO2 back into the atmosphere.

The case for cross-laminated timber (CLT) is outlined on pages 9-11, describing the material, how it is made, its benefits, its drawbacks, and its CO2 credentials.

CLT removes CO2 at no incremental cost, illustrated with specific case studies and cost-breakdowns on pages 12-13.

CLT economics are attractive. We estimate 20% IRRs are achievable for new CLT production facilities on page 14.

Leading companies are described on pages 15-16, including large listed companies, through to private-equity backed firms and growth stage firms.

Our conclusion is that CLT could disrupt concrete and steel in construction, helping to eliminate 1-5GTpa of CO2 emissions by mid-century.

Paulownia tomentosa: the miracle tree?

Empress Tree CO2 uptake

The ‘Empress Tree’ has been highlighted as a miracle solution to climate change, with potential to absorb 10x more CO2 than other tree species; while its strong, light-weight timber is prized as the “aluminium of woods”. This note investigates Empress Tree CO2 uptake. There is clear room to optimise nature based solutions. But there may be risks for the Empress.


Nature based solutions to climate change represent the largest and lowest cost opportunity in the energy transition. Those who follow our research will know we see potential to offset 15-30bn tons of CO2 emissions per year via this route (summary below).

The costs are incredibly low, at $3-10/ton, when reforestation efforts are well structured through reputable tree-planting charities (note below). Hence we argue that restoring nature will push higher-cost energy technologies off the cost curve.

Broadly, our reforestation numbers assume 3bn acres could be re-planted, absorbing 5T of CO2 per acre per year, which is the average across dozens of technical papers for typical deciduous forests in the Northern hemisphere (data-file below).

There are further optimisation opportunities to capture around 10T of CO2 per acre per year using faster-growing tree species, such as poplar, eucalyptus and mangrove. However, some commentators claim that another tree genus, known as Paulownia, can achieve an incredible 103T of CO2 offsets per acre per year.

If 100T/acre/year were possible, it would be a game-changer for the potential of reforestation. It would, in principle, only require 0.2 acres of Paulownia to offset the 20Tpa CO2 emissions of the average American. For comparison, population density in the Lower 48 is around 6 acres per American.

Paulownia: the miracle tree?

What is Paulownia? Paulownia is a tree genus, named after Princess Anna Pavlovna, daughter of Tsar Paul I of Russia (1754-1801). It has at least 6 species, of which Paulownia tomentosa is the fastest-growing “miracle” variety. This species also goes by the names: Empress Tree, Princess Tree and Kiri (Japanese).

Paulownia tomentosa can grow by a remarkable 6 meters in one year and reach 27m in height. It then adds 3-4cm of diameter to its trunk each year. It is shown below towering over the other plants in a garden (here, at about 1.5 years old).

Reasons for remarkable growth rates include that Paulownia is a C4 plant. This photosynthetic pathway produces more leaf sugar, especially in warm conditions. By contrast, most other trees are C3 plants and fix CO2 using the Rubisco enzyme, which is not saturated (creating inefficiency) and not specific (so it also wastes energy fixing oxygen). Paulownia’s leaves are also very large, helping it to absorb more light. It also simply appears to have a faster metabolism than other species. And finally, its wood is 30-40% less dense than other species, allowing it to accumulate a large size quickly.

Other Advantages?

Paulownia’s timber is highly prized and sometimes termed the โ€œaluminium of woodsโ€. It is light, at 300kg/m3 (oak is 540kg/m3) and 30% stronger than pine. It does not warp, crack or twist. It is naturally water and fire resistant. When used in flooring, it is also less slippery and softer than other woods (which is noted as advantageous for those prone to falling over). The wood is also suited to making furniture and musical instruments.

Pollutants are well absorbed by Paulownia’s large leaves, which can be 40-60cm long. Hence one study that crossed are screens examined planting Paulownia in a Northern Italian city, to reduce particulate concentrations toward recommended limits.

Other advantages are ornamental qualities with shade, โ€œwonderful purple scented flowersโ€ (below), which support honey bees, and the ability to restore degraded soils.

A final remarkable feature of Paulownia is that you can cut it down and it will re-grow, up to seven times, rapidly springing back from its stump.

Source: Wikimedia Commons

Costs of CO2 offsets using Paulownia?

Our usual model for reforestation economics is shown below, assuming a typical planting cost of $360/acre. Paulownia may be modestly more expensive to grow. Our reading suggests a broad range of $2-7/tree multiplied by c250 trees per acre in commercial plantations. The largest costs are cuttings and cultivation of saplings. Thereafter, paulownia requires โ€œminimal management and little investmentโ€. Hence if growth rates are 10x faster than traditional trees, all else equal, we would expect CO2 offset costs to be c10x lower, at $2-5/ton (including land acquisition costs at developed world prices).

Examples of Paulownia?

Over 2M hectares of Empress trees are cultivated in China, often being inter-cropped with wheat. But Paulownia cultivation in the Western world is more niche. As some examples: Jimmy Carter famously grows 15 acres of Paulownia trees on his farm in Georgia. As a commercial investment, WorldTree is an Arizona-based company that manages 2,600 acres of Empress Trees and plans to plant 30,000 acres more. It claims to be the largest grower of non-invasive Paulownia in the world. Furthermore, ECO2 is a privately owned Australian company, headquartered in Queensland. It claims to have cultivated a variety of Paulownia tree, which can reach 20m after 3-5 years and sequester 5-10x more CO2 than other trees, or around 2.5T of CO2 per tree. Finally, oil companies are exploring reforestation initiatives. For example, YPF noted in its 2018 sustainability report plans to test-plant 40 species of Empress Trees in 2019.

Problems with Paulownia?

Invasiveness? One of the largest pushbacks on reforestation is that large-scale planting of single forest varieties may impair biodiversity (a chart of all the pushbacks is below, with some irony that environmentalists call for drastic action to avert the perils of climate change, then often say, no, “not that drastic action”). In the US, Paulownia is categorized as an invasive plant. A single plant can produce 20M seeds in a year. In some States, such as Connecticut, sales of the plant are even banned. Paulownia did in fact exist in North America prior the last Ice Age. It was re-introduced from China in 1834, when seeds were accidentally released from dinnerware packaging materials. Whatever intuitions one might have, some factions are going to protest against Western cultivation of Paulownia.

But the greatest question mark over Paulownia’s CO2 offset credentials is in the numbers. Different studies are tabulated below.

Empress Tree CO2 uptake

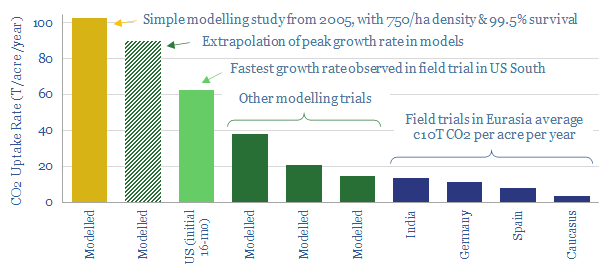
103T of Empress Tree CO2 uptake per acre is the most widely cited number online. But this figure derives from a single study, conducted in 2005. Whose methodology is woefully rough. The study simply assumes a 12’x12′ planting of Paulownia (750/ha, 99.5% survival) and then uses a formula to estimate the CO2 uptake from the trees’ target height and width.

A follow-up study was published in 2019, estimating 38-90T of Empress Tree CO2 uptake per acre per year. But upon review, the upper bound is extrapolating the “maximum growth rate”, which is known to be 2-3x faster than the average growth rate (charts below). The study is also vague on its modelling assumptions. It was funded by a company that commercializes Paulownia plantations. Finally, the study itself notes โ€œadditional research is needed in order to quantify the carbon sequestration rates of Paulownia trees under the specific management regime employed by World Treeโ€™s Eco-Tree Program, by continuing to collect DBH values over the 10 to 12 year harvest cycle.โ€

Empress Tree CO2 uptake

Achieving monster growth rates will vary with growing conditions. Ideal conditions are warmer climates (the tolerable range is -24 to 45C), flattish, well-drained soil with pH 5-9, <25% clay, <1% salinity, <2,000m altitude, >800mm rainfall and <28kmph wind. But past studies planting the Empress Tree in Eurasia have ranged from 3-15 tons of CO2 per acre per year, which is not so remarkable versus other tree varieties.

Diseases. Finally, dense clusters of trees may fall short of growth targets due to disease. Paulownia, in particular, is susceptible to an affliction known as ‘Witches Broom’, which causes the tips of infected branches to die, leading to a cluster of dead branches. The wood is of poor quality and the growth rate of the plant diminished.

We conclude that there is great potential for nature based solutions, especially for their optimisation to boost CO2 uptake rates. Paulownia may be among the options. However, more data may be needed in the West before it can be heralded as a miracle plant.

Our key points on Empress Tree CO2 uptake are highlighted in the research note sent out to our distribution list.

Greenhouse gas: use CO2 in agriculture?

Using CO2 in agriculture and greenhouses

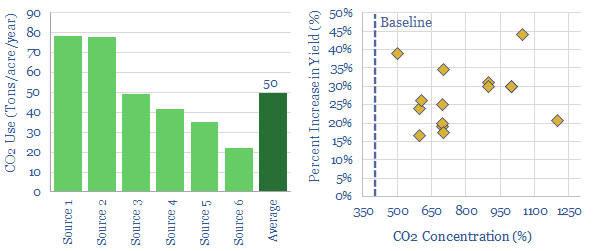
Enhancing the concentration of CO2 in greenhouses can improve agricultural yields by c30%. It costs $4-60/ton to supply this CO2, while $100-500/ton of value is unlocked. Shell and ABF have already under-taken projects using CO2 in agriculture and greenhouses, while industrial gas and monitoring companies can also benefit. But the challenge is scale. Around 50Tpa of CO2 is supplied to each acre of greenhouses. Only c10% is sequestered. So the total CO2 sequestration opportunity may be limited to around 50MTpa globally.

This 8-page note explains the opportunity, progress to date and our conclusions.

Carbon offsets: ocean iron fertilization?

Carbon offsets through ocean iron fertilization

Nature based solutions to climate change could extend beyond the world’s land (37bn acres) and into the world’s oceans (85 bn acres). This short article explores one option, ocean iron fertilization, based on technical papers. While the best studies indicate a vast opportunity, uncertainty remains high: on CO2 absorption, sequestration, scale, cost and side-effects. Unhelpfully, research has stalled due to legal opposition.


Nature based solutions to climate change are among the largest and lowest cost opportunities to achieve “net zero” and limit atmospheric CO2 to 450ppm, as summarized here. But so far, all of our research has been limited to land based approaches.

The ocean is much larger, covering 85bn acres, compared with 37bn acres of land. Furthermore, compared to the c900bn tons of carbon in the atmosphere, there is c38,000 bn tons of carbon stored in the oceans (chart below). Of this, c1,000bn tons is near the surface and 37,000 bn tons is in deeper waters. The surface and the deep waters exchange c100 bn tons of carbon per year (in both directions), through the “ocean biological pump”, which is c8x higher than total manmade CO2 emissions of c12bn tons of carbon per annum. These numbers are largely derived from the IPCC and our own models.

A vast opportunity to mitigate atmospheric CO2 in oceans is suggested by the figures above. The mechanism would need to increase the primary productivity of oceans (i.e., the amount of CO2 taken up by photosynthetic organisms) and the sinking of that fixed organic material into deep oceans, where it would be remain for around c1,000 years.

Below we will describe the process of ocean iron fertilization, which has been explored to sequester CO2 in the intermediate and deep ocean. First, we will introduce some terms and definitions.

An Ocean In Between the Waves

The mixed layer (ML) captures the surface of the ocean. It is named because this surface layer of water is effectively mixed together by turbulence (e.g., waves) so that its composition is relatively homogenous. The depth of the mixed layer ranges from around 20-80 meters. It tends to be larger in the winter than the summer. This is also the layer of the ocean penetrated by light and capable of supporting photosynthesis.

Phytoplankton in the mixed layer are responsible for 40% of the world’s photosynthesis and oxygen production. They are single celled microorganisms that drift through the water. They comprise micro-algae and cyanobacteria. They make up 1-2% of global biomass. Under optimal conditions, algae can fix an enormous 50T of CO2 per acre per year, which is 10x higher than typical forests (data file here).

However, typical conditions are not optimal conditions. Total primary productivity of marine organisms is around 100 bn tons per year. This implies CO2 is fixed at around 4T/acre/year, on a gross basis, not including the CO2 that is respired back again by other organisms.

Iron is an essential limiting factor for the uptake of macronutrients in phytoplankton. Typically, with iron concentrations below 0.2nM, phytoplankton cannot absorb macronutrients (especially nitrates) for photosynthesis.

The major source for ocean iron is dust inputs to the ocean from land. Indeed, one theory on the cause of the last Ice Age is a vast uptick in desert dusts or volcanic ash blowing into the ocean, enhancing the productivity of phytoplankton, raising the CO2 dissolved in the oceans, and lowering CO2 in the atmosphere (which was measured at 180ppm at the last glacial maximum, 20,000 years ago, compared to 280ppm in pre-industrial times).

The Martin hypothesis suggests, therefore, that Ocean Iron Fertilization (OIF) could increase oceanic carbon, sequestering CO2 in intermediate- and deep-ocean layers for storage over c1,000-years. As Martin famously (hyperbolically) stated it, “give me half a tanker of iron and I will give you another Ice Age”.

High nutrient low-chlorophyll concentrations (HNLC) indicate the areas where OIF is most likely to be effective. HNLC suggests primary productivity is below potential levels, due to a shortage of iron. HNLC regions include the North Pacific, Equatorial Pacific and Southern Ocean.

Ocean Iron Fertilization: Productivity Increases

6 natural and 13 artificial OIF experiments have been performed since 1990 into ocean iron fertilization, denoted as nOIF and aOIF respectively.

All the aOIF experiments were conducted by releasing commercial iron sulphate dissolved in acidified seawater into the propeller wash of a moving ship, over initial areas from 25-300 sq km. By the end of the experiments fertilized areas have spread as far as 2,400 sq km (as evidenced by sulfur hexafluoride tracers). The iron is rapidly dispersed and taken up, dropping from 3.6nM to 0.25nM in 4-days, and often refertilized.

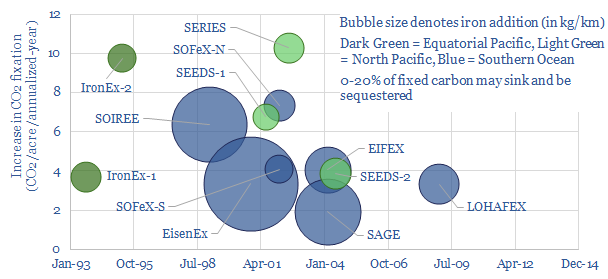
Primary production is significantly enhanced, with potential 100,000:1 ratios of carbon fixation to iron additions. Maximum phytoplankton growth occurs in response to 1.0-2.0nM. For example, in one experiment, denoted as IronEx-2, surface chlorophyll increased 27-fold, peaking at 4 mg/m3 after 7-days, increasing primary productivity by 1.8gC/m2/day. On an annualized basis, this is equivalent to around 10 tons of CO2e per acre per year.

Other studies are shown below. CO2 absorption has been highly variable and does not correlate with the amount of iron that is added. This indicates a complex biophysical system, which requires a deeper understanding.

It’s only a Carbon Sink if the Carbon Sinks.

The largest controversy around the effectiveness of aOIF is whether the carbon will sink into the intermediate and deep oceans. High carbon export has been observed in natural OIF in the Southern Ocean near the Kerguelen Plateau and Crozet Islands, so we know that the process can sequester CO2.

But of the 13 artificial OIF experiments, only one (EIFEX) has conclusively shown additional carbon fixation sinking into the deep ocean. The study saw carbon export down to 3,000m, as phytoplankton blooms aggregated and sank. But others have been less clear cut.

The skeptics argue that across the broader ocean, only 15-20% of CO2 fixed by photosynthesis sinks into the intermediate ocean and just c1-2% sinks into the deep ocean. The remainder is grazed by zooplankton or bacteria, so the fixed carbon is metabolized and respired back into the atmosphere. While CO2 sinking can be higher in nOIF, this is a continuous and slow process, based on the upwelling of iron-rich subsurface waters. Conversely, aOIF will inherently be episodic, with massive short-term iron additions, and thus perhaps struggle to be as effective.

The proponents argue back that past studies have failed to measure carbon sinkage due to limitations in their experimental design. The one clear success, at EIFEX, was a a 39-day study, while others may not have been sufficiently lengthy. In other studies, there were simply no measurements in the deep ocean or outside the fertilized patch for comparison (e.g., IronEx-2). In other studies, the measurement methods over a decade ago may not have been sufficiently — based on tracers (Thorium-234) or physical traps that are meant to collect organic matter, which are known to be disrupted by currents.

Diatom blooms could also enhance future sinkage. Diatoms are a group of unicellular micro-algae that make up nearly half of the organic material in the ocean, forming in colonies that tend to aggregate and sink more readily than other phytoplankton types. Primary productivity has doubled in past aOIF studies where diatoms dominated. The prevalence of diatoms in phytoplankton blooms can be enhanced in areas rich in silicates.

Future experiments can also test the process more effectively, identifying the right conditions for diatoms to dominate the blooms, aggregate and sink; which in tun hinges on abundant silicates and low grazing pressure from mesozooplankton. It is suggested to conduct studies in ocean eddies, which naturally isolate 25-250km diameter areas for 10-100 days. More precise measurement is also possible using satellite data; and unmanned aquatic vehicles equipped with transmissometers, which measure the impedance of light by materials such as sinking organic matter (our screen below finds a rich improvement in autonomy and precision of concepts for the oil and gas industry).

Unintended climate consequences and feedback loops?

The other criticism of OIF is that interfering with nature ecosystems can have unintended consequences, both for biodiversity and for climate.

N2O is a complication. It is a 250x more potent greenhouse gas than CO2. The ocean is already a significant source of N2O, from bacterial mineralization. N2O increased by 8% at 30-50m during on aOIF trial, named SERIES. Models suggest excess N2O after 6-weeks could offset 6-12% of the CO2 fixation benefit. Conversely, other studies suggest OIF acts as a sink for N2O, as it also sinks alongside aggregates.

Dimethyl Sulfide (DMS) is another by-product of aOIF, from the enzymatic cleavage of materials in planktons. DMSs may be a precursor of sulfate aerosols that cause cloud formation. This would counteract global warming. Fertilizing 2% of the Southern Ocean could increase DMS c20% and produce a 2C decrease in air temperatures over the area, one study has estimated. Others disagree and do not find increases in DMS from aOIF.

A commercial hurdle: commercial aOIF is currently illegal

The current legal framework actually prohibits OIF in international waters because of a perceived threat of environment damage by profit-motivated enterprises. Specifically, regulations from 2008 and 2013 categorize OIF as marine geo-engineering and thus it is not allowed at large scale (>300 sq km) or commercially.

This seems unhelpful for unlocking a potentially material solution to climate change. Companies such as GreenSea Venture and Climos, which were set up to harness the opportunity appear to have dissolved. As one recent technical paper stated, โ€œno other marine scientific institutions are willing to take up the challenge of carrying out new experiments due to the fear of negative publicityโ€.

Others have illegally explored OIF, flouting regulations. For instance, in 2012, Haida Salmon Restoration dumped 100 tons of iron sulphate into international waters off Haida Gwai, British Columbia, in an attempt to raise salmon populations.

Conclusion: large potential, large uncertainty and likely stalled

The costs of OIF are highly uncertain and estimates have ranged from $8/ton of CO2 to $400/ton of CO2. It is currently not clear how a commercial aOIF project would need to be designed in order to calculate precise costs.

Total CO2 uptake potential from ocean iron fertilization is also vastly uncertain and has been estimated between 100M and 5bn tons of CO2 per year globally. The upper end of the range could be conceived as c0.5T of CO2-equivalents sinking per acre per year across a vast c10bn acres of ocean. But again, this is not possible on today’s understanding.

The technique is likely limited to oceans that are deficient in iron but rich enouch in other nutrients (e.g., the North Pacific, Equatorial Pacific and Southern Ocean). Moreover, blooms are limited to c2-months over summer, where nutrients are welling up from subsurface waters, light is available but grazing pressure from zooplankton remains light.

Uncertainty is very high and for now the technique is stalled due to stifling regulation and low research activity. Hence for now, we reflect OIF on our CO2 cost curve, but we have taken the more conservative ranges above as inputs.

Sources:

Yoon, J-E., Yoo, K-C., MacDonald, A., et al (2018). Reviews and syntheses: Ocean iron fertilization experiments โ€“ past, present, and future looking to a future Korean Iron Fertilization Experiment in the Southern Ocean (KIFES) project. Biogeosciences, 15.

Ciais, P., C. Sabine, G. Bala, L. Bopp, V. Brovkin, J. Canadell, A. Chhabra, R. DeFries, J. Galloway, M. Heimann, C. Jones, C. Le Quรฉrรฉ, R.B. Myneni, S. Piao & P. Thornton, (2013). Carbon and Other Biogeochemical Cycles. In: Climate Change 2013: The Physical Science Basis. Contribution of Working Group I to the Fifth Assessment Report of the Intergovernmental Panel on Climate Change. Cambridge University Press, Cambridge, United Kingdom and New York, NY, USA.

Report to Congress (2010). The Potential of Ocean Fertilization for Climate Change Mitigation.

Can carbon-neutral fuels re-shape the oil industry?

CO2 neutral fuels with carbon offsets

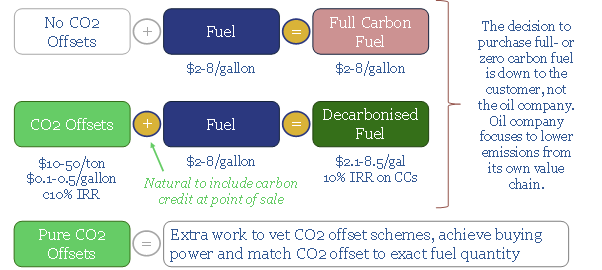
Fuel retailers have a game-changing opportunity seeding new forests, outlined in our 26-page note, then commercializing CO2 neutral fuels with carbon offsets.

Nature based solutions could offset c15bn tons of CO2 per annum, enough to accommodate 85Mbpd of oil and 400TCF of annual gas use in a fully decarbonized energy system. The cost is competitive, well below c$50/ton. It is natural to sell carbon credits alongside fuels and earn a margin on both. Hence, we calculate 15-25% uplifts in the value of fuel retail stations, allaying fears over CO2.


The advantages of forestry projects are articulated on pages 2-7, explaining why fuel-retailers may be best placed to commercialize genuine carbon credits.

Current costs of carbon credits are assessed on pages 8-10, adjusting for the drawback that some of these carbon credits are not “real” CO2-offsets.

The economics of future forest projects to capture CO2 are laid out on 11-14, including opportunities to deflate costs using new business models and digital technologies. We find c10% unlevered IRRs well below $50/ton CO2 costs.

What model should fuel-retailers use, to collect CO2 credits at the point of fuel-sale? We lay out three options on pages 15-18. Two uplift NPVs 15-25%. One could double or treble valuations, but requires more risk, and trust.

The ultimate scalability of forest projects is assessed on pages 19-25, calculating the total acreage, total CO2 absorption and total fossil fuels that can thus be preserved in the mix. Next-generation bioscience technologies provide upside.

What is crucial is to do this right. Cutting corners and flogging low-quality offsets will be a trust-destroying disaster. Hence it is important to screen for high-quality nature-based CO2 removals.

A summary of different companies forest/retail initiatives so far is outlined on page 26.

Our 3 key points on how CO2 neutral fuels with carbon offsets could reshape the oil industry are also highlighted in the short article sent out to our distribution list.

What oil price is best for energy transition?

best oil price for energy transition

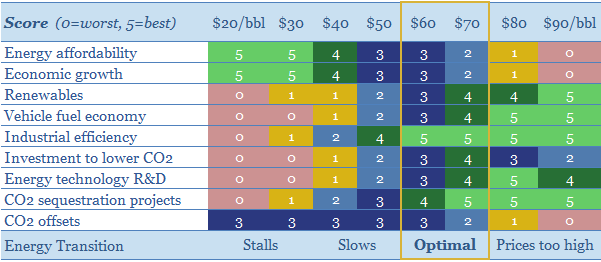
It is possible to decarbonize all of global energy by 2050. But $30/bbl oil prices would stall this energy transition, killing the relative economics of electric vehicles, renewables, industrial efficiency, flaring reductions, CO2 sequestration and new energy R&D. This 15-page note looks line by line through our models of oil industry decarbonization. We find stable, $60/bbl oil is the best oil price for energy transition.


Our roadmap for the energy transition is outlined on pages 2-4, obviating 45Mbpd of long-term oil demand by 2050, looking across each component of the oil market.

Vehicle fuel economy stalls when oil prices are below $30/bbl, amplifying purchases of inefficient trucks and making EV purchases deeply uneconomical (pages 5-6).

Industrial efficiency stalls when oil prices are below $30/bbl, as oil outcompetes renewables and more efficient heating technologies (page 7).

Cleaning up oil and gas is harder at low oil prices, cutting funding for flaring reduction, methane mitigation, digitization initiatives and power from shore (pages 8-9).

New energy technologies are developed more slowly when fossil fuel prices are depressed, based on R&D budgets, patent filings and venturing data (pages 10-11).

CO2 sequestration is one of the largest challenges in our energy transition models. CO2-EOR is promising, but the economics do not work below $40/bbl oil prices (pages 12-14).

Our conclusion is that policymakers should exclude high-carbon barrels from the oil market to avoid persistent, depressed oil prices, and stabilize oil at the ‘best oil price for energy transition’ (as outlined on page 15).

Qnergy: reliable remote power to mitigate methane?

remote power to mitigate methane

This short note profiles Qnergy, the leading manufacturer of Stirling-design engines, which generate 1-10 kW of power, for remote areas, where a grid connection is not available. The units are particularly economical for mitigating methane emissions, with a potential abatement cost of $20/ton of CO2-equivalents avoided.


750,000 bleeding pneumatic devices around the oil and gas industry are the largest single source of methane leaks, with each medium-bleed device leaking an average of 1.5T of methane per year, comprising 35% of the oil and gas industryโ€™s total emissions (chart below, data here).

We have screened the US onshore space, operator-by-operator, acreage position by position, to see who most urgently needs to replace bleeding pneumatics (chart below, data here, note here). But how will they be replaced?

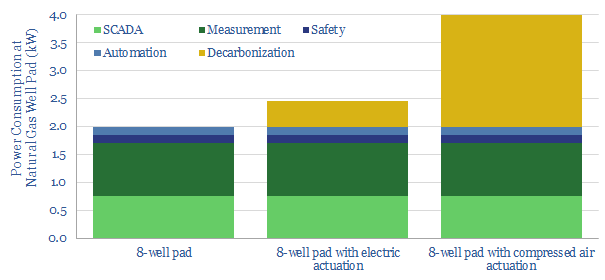
The challenge is power. An 8-well pad will typically require 2kW of electricity, which is low because the pneumatic pressure of natural gas is used in control and actuation of valves. The power demands rise to 4kW if compressed air is used in lieu of methane. Compressed air is reliable, easy to retrofit and does not cause warming when it bleeds into the atmosphere. But a compressor is needed, and the compressor needs to be powered (below).

Qnergyโ€™s Powergen product uses a Stirling engine to generate electricity from heat. It is fuel agnostic and can run on waste heat or in-basin gas.

The PowerGen product was launched in 2017 and its adoption has been growing at a 300% CAGR. The company now also manufactures and sells compressed air pneumatic devices, which will be powered by its Stirling engines. The 5,650 series generates 5.7kW of power from 1.4mcfd of gas inputs (implying c30% thermal efficiency).

NASA has accredited the design as the most reliable ever invented for a heat engine. One of the first units has now run for 24,000 hours without requiring maintenance (equivalent to driving a car to the moon and back 2x). Design life is estimated at over 60,000 hours (7-years). The engine runs between -40C in Alaska and 60C desert installations. Each unit is also remotely monitored, with live support, for preventative maintenance and to detect issues.

Total cost of ownership for Stirlingโ€™s Powergen is cited as the lowest cost power solution to replace bleeding pneumatic devices: costing $100k for Qnergy unit, $150k for a microturbine, $320k for a combination of renewable power and fuel cells, and c$380k for a thermo-electric alternative.

Emissions reductions from each Qnergy Powergen unit saves 325T of CO2e-emissions per annum, while powering each unit will emit 25T of CO2e, for a net saving of 300T/CO2e. At a total cost of $100k, this implies a CO2 abatement cost of $20/ton over a c15-year life of a Qnergy Powergen unit.

For our published screen of companies in methane mitigation, please see our data-file here.

For Qnergy’s latest presentation, see the video below, and please let us know if we can helpfully introduce you to the team at Qnergy.

Ten Themes for Energy in the 2020s

We presented our ‘Top Ten Themes for Energy in the 2020s’ to an audience at Yale SOM, in February-2020. The audio recording is available below. The slides are available to TSE clients, in order to follow along with the presentation.


Please sign up to our distribution list, to receive our best ideas going forwards…

Copyright: Thunder Said Energy, 2019-2025.