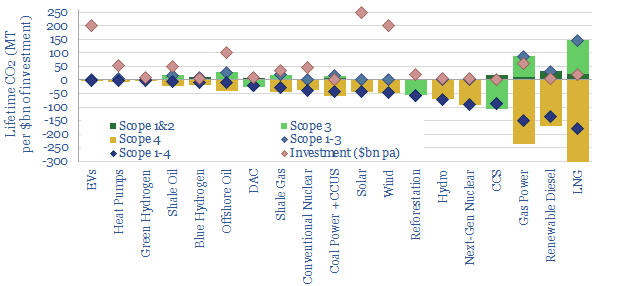
Scope 4 CO2 emissions reflect the CO2 avoided by an activity. This 11-page note argues the metric warrants more attention. It yields an ‘all of the above’ approach to energy transition, shows where each investment dollar achieves most decarbonization and maximizes the impact of renewables.
Scope 1-3 CO2 emissions are now familiar to most decision-makers. Scope 1 captures the CO2 emitted directly in creating a product. Scope 2 adds the CO2 emitted in generating electricity used to create the product. And Scope 3 adds the CO2 emitted in using the product, for example, by combusting it. A summary is presented by fuel and by material on pages 2-3, with the implication that ‘everything is bad, only some things are less bad than others’.
Scope 4 CO2 is intended as an antidote to the depressed conclusion that ‘everything is bad’. It considers the CO2 avoided by an activity. Working from home avoids the CO2 of a commute. Building a wind farm may displace CO2-intensive coal. So too might developing a gas field. Thus the purpose of this note is to construct Scope 1-4 CO2 calculations for 20 different energy technologies, fairly, objectively, and then draw conclusions. The numbers are remarkable (page 4).
‘All of the above’. Every single option in our chart above has net negative Scope 1-4 CO2 emissions. The more investment that flows in to all of these categories, the faster the world will decarbonize. Our overall roadmap to net zero needs to treble global energy capex to over $3trn pa (pages 4-8).
Project developers and investors should consider Scope 4 CO2. Many categories with deeply negative Scope 1-4 CO2 emissions — sometimes achieving 3x more net CO2 abatement per $1bn of investment than wind, solar and EVs — have been unsuccessful in attractive capital. It may therefore be appealing for project-developers to present Scope 1-4 CO2 benefits on a clear and transparent basis. It may also be appealing for investors to communicate the Scope 1-4 CO2 of their portfolios to their own stakeholders (page 9).
Maximizing decarbonization. Scope 4 CO2 emissions depend on counterfactuals. What is an activity displacing? This matters across the board and can also promote faster decarbonization. For example, a new wind project that displaces nuclear achieves no net decarbonization, whereas an inter-connector that allows that same wind project to displace coal-power avoids 1.2 kg/kWh of CO2 (page 10).
Conceptual limitations of Scope 4 CO2 are discussed on page 11. However, we conclude it is an increasingly important metric for decision makers in the energy transition, to ensure adequate energy supplies are developed, while also decarbonizing as fast as possible.
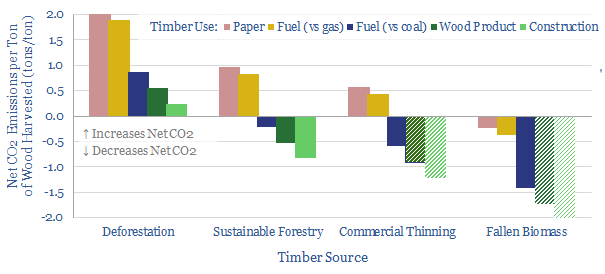
The carbon credentials of wood are not black-and-white. They depend on context. So this 13-page note, focusing on wood use CO2 impacts, draws out the numbers and five key conclusions. They highlight climate negatives for deforestation, climate positives for using waste wood and wood materials (with some debate around paper), and very strong climate positives for natural gas.
The CO2 accumulation profile of a forest is set out on pages 2-3. For example, a mature forest absorbs 90% less net CO2 each year than a young forest. This is our baseline for assessing carbon counterfactuals, and numbers can be flexed in our underlying data-file.
Deforestation has net climate negatives across the board. It even emits 35% less CO2 to burn coal (i.e., forests that have been dead for 100M years) than to cut down and burn living forests (page 4).
Conversely, gathering waste wood that has fallen to the forest floor and would otherwise decompose is ‘climate positive’ across every category that we assessed, with other hidden climate benefits (page 5).
Wood materials are the best use of wood, as each ton of sustainably harvested timber avoids 0.5 – 1.2 tons of net CO2 versus using other industrial materials. The note explores how wood product and chemicals companies might benefit from this theme, although paper is an exception and much more debatable (page 6-8).
Wood fuels are still used remarkably widely. But the carbon in lignin and cellulose is already part oxidized, so there is less energy “left to release” as it is converted to CO2. Whereas natural gas derives c54% of its energy release from hydrogen atoms converting to innocuous water vapor. This means each MTpa of LNG can displace an astonishing 10MTpa of CO2 where it prevents the burning of wood from deforestation (pages 9-11).
Biomass power can make sense in some contexts, but only when the wood is sustainably sourced, clearly substitutes coal and helps diversify energy sources/security (page 12).
Our key conclusions and implications for decision-makers are provided on page 13.
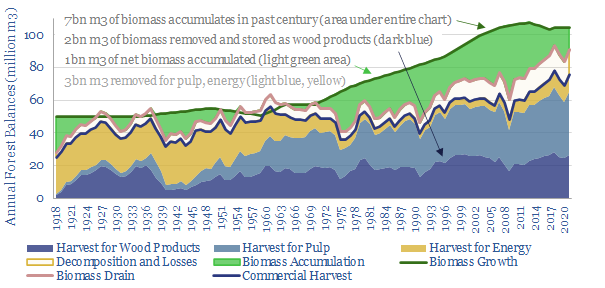
Can forestry remove CO2 from the atmosphere at multi-GTpa scale? This 19-page note about Finland forests CO2 removals is a case study , where detailed data goes back a century. 70% of the country is forest. It is managed sustainably, equitably, economically. And forests have sequestered 2GT of CO2 in the past century, offsetting two-thirds of the country’s fossil emissions.
Nature-based carbon removals underpin 25% of all the decarbonization in our roadmap to net zero. The key debate is whether they can scale to this level, measurably, reliably, as covered on pages 2-3.
Finland makes for an excellent case study. An overview of the country, its forests and its forest-centric culture is set out on pages 4-6.
The structure of Finnish forestry is broken down on pages 7-10. Our data are aggregated from Natural Resources Institute Finland, and offer the best, most comprehensive breakdown we have ever encountered on the costs of forest management (across 20 line items), harvesting practices and realized pricing for different categories of wood.
Carbon credentials are calculated on pages 11-12, explaining the maths above: 2GT of CO2 sequestered in the past century, versus 3GT of nationwide fossil emissions.
Productivity data are also excellent, improving at 1% per year over the past century, with biomass yields per hectare almost doubling since the first half of the 20th century. This is mainly through improved forestry practices (pages 13-16).
Conclusions of Finland forests CO2 removals are spelled out on pages 17-19. 110 countries, with 5bn acres of land, have a 1-5x better environment for growing forests than icy Finland. For Brazil, for example, to get repeatedly ‘trounced’ by Finland should be as surprising in forestry as it would be in soccer.
To read more of our outlook on Finland’s forestry product business that aspires to be a leading provider of renewable products, please see our article here.
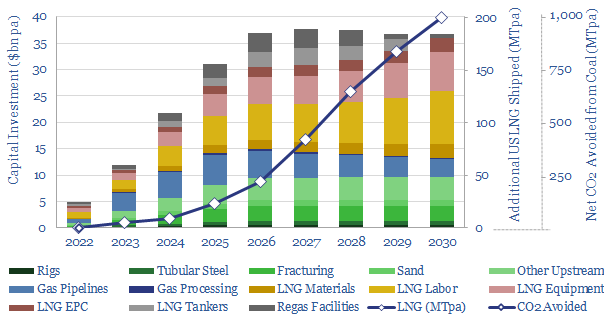
Perceptions in the energy transition are likely to change in 2022, amidst energy shortages, inflation and geopolitical discord. The biggest change will be a re-prioritization of US LNG. At a $7.5/mcf delivered price, there is 200MTpa of upside by 2030, which could also abate 1GTpa of global CO2. This 15-page note outlines our reasoning and conclusions.
Pragmatic solutions are increasingly needed in the energy transition, in order to avoid painful energy shortages, double-digit inflation and geopolitical discord. We review each of these challenges on pages (2-6), concluding that a 50-60% decarbonization solution (i.e., LNG) is increasingly going to seem better than no solution.
Meanwhile, on the other side of the Atlantic Ocean, there is an industry with the capability to supply 200MTpa of incremental gas to Europe (26bcfd), flexibly, for a competitive price point of $7.5/mcf, ramping up in the late-2020s. We outline the economics on pages 7-8.
The CO2 credentials are for 50-60% lower CO2 per unit of delivered energy versus coal. Each MTpa of LNG avoids around 5MTpa of net CO2 emissions. And we expect most of the LNG will be ‘Clear LNG’ with no embedded Scope 1&2 emissions (page 9).
The challenges and bottlenecks for achieving this US LNG ramp are addressed on page 10-14, again integrating across our models. The capex, materials, labor and land bottlenecks are all at least 95% less demanding than an equivalent energy ramp from ‘renewables only’.
Our conclusions are spelled out on page 15, ending with a discussion of ‘who benefits’ from the theme.
Further research. Our outlook on 300 offtake contracts across the global LNG industry is linked here.
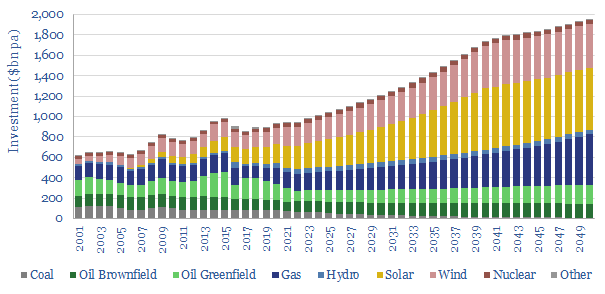
Global energy investment in 2020-21 has been running 10% below the level needed on our roadmap to net zero. Under-investment is steepest for solar, wind and gas. Under-appreciated is that each $1 dis-invested from fossil fuels must be replaced with $25 in renewables, to add the same new energy supplies. Future energy capex requirements are staggering. These are the conclusion in our 14-page note.
This 14-page note compares annual energy investment in different upstream energy sources with the amounts that would be required on our roadmap to net zero. The methodology is explained on page 2.
Current investment levels in each energy source are described on pages 3-5, reviewing the trajectory for each major category: oil, gas, coal, wind and solar. A stark contrast is found in capex per MWH of new added energy supplies.
We have constructed 120 different models, in order to stress-test the capex costs per MWH of new added energy supplies, across different resource types. Conclusions and comparisons from our modelling are presented on pages 6-8.
How much would the world need to be investing, on our roadmap to net zero, or indeed on the IEA’s roadmap to net zero? We develop our numbers, category by category, on pages 9-12, to identify where the gaps are greatest.
Conclusions and controversies are laid out on pages 13-14. Disinvestment from oil and gas will tend to exacerbate future energy shortages. To avoid this, it would be ideal to replace each dis-invested $1 of oil and gas investment with around $25 of new renewables investment.
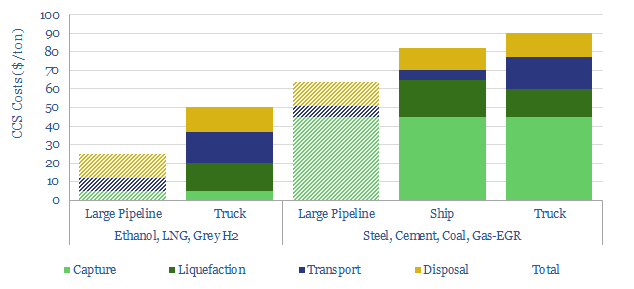
CO2 has unusual physical properties, which make small-scale liquefaction and transport much more viable than we had expected. The energy burden is 70% less than other industrial gases. Total CCS costs are $50-90/ton for leading examples. This 15-page note outlines the opportunity.
Liquefying CO2 may allow smaller industrial facilities to capture and transport their CO2 to disposal sites, where permitting a pipeline is not feasible or economical. This expands the opportunity for CCS. Early proposals to do this are explored on pages 2-4.
The physics are helpful and are explained on pages 6-8. CO2’s unusual triple point means that the energy costs of CO2 liquefaction are around two-thirds lower than the heavy-duty cryogenics that are already used to liquefy almost 1GTpa of industrial gases globally.
The economics of CO2 liquefaction and transportation are laid out on pages 9-12. We have modeled a separate liquefaction plant, a convoy of CO2-carrying trucks, and larger liquid CO2-carrying ships. Including capex, energy and CO2 costs.
The main operational hurdles are described on page 13. We have reflected additional safety measures and staff training costs in our models as a consequence.
Who benefits? The opportunity is summarized on pages 14-15. The most ambitious project to-date will see Aemetis capture around 2MTpa of CO2 for disposal in California’s Central Valley, where the LCFS could yield $250/ton revenues.
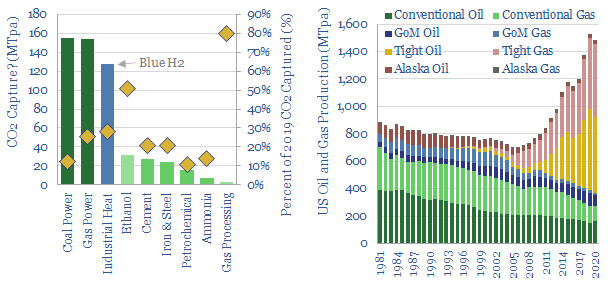
This 13-page note aims to quantify the upside case for CCS in the United States, using economics, top-down and bottom-up calculations. Our conclusion is that a clear, $100/ton incentive could help CCS scale by c25x, accelerating over 500MTpa of projects in the next decade, which could prevent almost 10% of the US’s current CO2 emissions. Our numbers include blue hydrogen and next-gen CCS.
Current CCS incentives are not sufficient for hard-to-abate sectors in the US, within the <$50/ton confines of the 45Q tax credit (page 2).
Although CCS technology is mature, c$100/ton incentives are needed to kick-start the industry. The economics are built-up on pages 3-7.
Top-down market-sizing is based on the oil and gas industry, which has extracted 900MTpa of hydrocarbons from sub-surface reservoirs, on average in the past 40-years. We discuss possible future CCS volumes relative to this baseline on page 8.
Bottom-up market sizing looks industry-by-industry, to break down possible capture volumes. We discuss each industry in turn – coal power, gas power, ethanol, steel, cement, et al., – on pages 9-12.
Blue hydrogen remains particularly exciting, for the decarbonization of smaller industrial facilities that may need to share infrastructure (page 13).
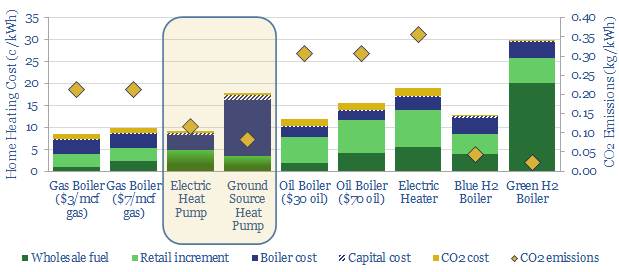
Some policymakers now aspire to ban gas boilers and ramp heat pumps 10x by 2050. In theory, the heat pump technology is superior. But in practice, there are ten challenges. Outright gas boiler bans could become a political disaster. The most likely outcome is a 0-2% pullback in European gas by 2030. We have also screened leading heat pump manufacturers in this 18-page note.
The opportunity for heat pumps in the energy transition is laid out on pages 2-3, as the IEA now advises that “bans on new fossil fuel boilers need to start being introduced globally in 2025, driving up sales of electric heat pumps”.
But are they ready for prime time? We have reviewed technical specifications, costs and consumer feedback on pages 4-13. The work suggests large heat pumps may not feasibly substitute for gas boilers in every context. There are ten crucial challenges for the industry to overcome.
Gas market impacts are quantified on pages 14-17. Our base case is that trebling heat pump capacity in Europe by 2030 will erode 2% of total gas demand. But rebound effects and under-performance could cut the net benefits to nil.
The best placed companies are explored in our detailed screening work (which we have used to select a heat pump provider for our own GSHP project in Europe). One company stands out in particular, having built-up an industry leading portfolio through acquisitions.
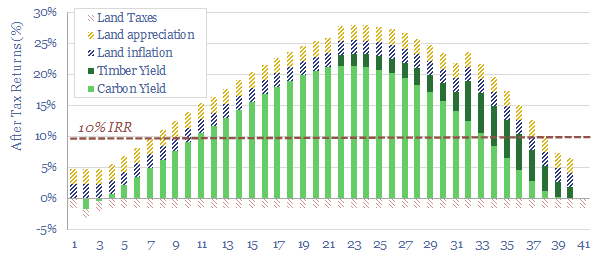
This 12-page note sets out an early-stage ambition for Thunder Said Energy to reforest former farmland in Estonia, producing high-quality CO2 credits in a biodiverse forest. The primary purpose would be to stress-test nature-based carbon removals in our roadmap to reforestation and net zero, and understand the bottlenecks. IRRs can also surpass 10% at $35-50/ton CO2.
The correct way to structure a reforestation project is one of the most important questions in the energy transition, but few seem to have cracked the code. This is our conclusion from hundreds of models and discussions, which are summarized on pages 2-4.
Our own interests in undertaking a reforestation project are set out on 5-8, combining personal circumstances, economics and an aspiration to understand the roadmap to reforestation and process in more detail.
What will a high-quality project need to look like? Our expectations and goals are set out on pages 9-12. As transparently as possible. This is a structured list of questions, and our initial hypotheses, to be addressed in future research.
CO2 prices and CO2 abatement costs are very different numbers. CO2 prices are incurred by emitters. But abatement costs depend on how much CO2 is reduced. These abatement costs can actually be astronomical if CO2 does not fall by very much. Hence we argue CO2 prices are only effective if nature-based offsets are incorporated.
Economy-wide CO2 prices have been suggested as an effective policy tool to drive decarbonization. For example, our research has shown that a CO2 price could create a level playing to allow a broad range of energy technologies to decarbonize the entire US economy. (note below).
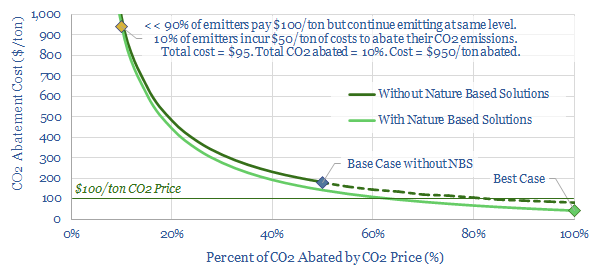
But something is missing from this analysis: what is the relationship between CO2 prices and CO2 abatement costs? The chart below aims to answer this question.
Short-run abatement costs from a CO2 price are astronomically high. To see this, consider the yellow dot in the chart above. Let us assume that a $100/ton CO2 price is imposed on all emitters in an economy. As a result, 10% of those emitters spend c$50/ton to eliminate their CO2 (total cost = $5 per ton of total ex-ante emissions). However, the remaining 90% of emitters continue emitting as before, and simply bear the costs of the $100/ton CO2 price, or pass it on to their customers (total cost = $90 per ton of total ex-ante emissions). Now, to calculate the CO2 abatement cost, we must add these costs together ($90 + $5 = $95/ton of ex-ante emissions) and then we must divide this total by the percent of CO2 that has been abated (10%). The result is a $950/ton abatement cost.
Can this be right? It might seem like a paradox, that the CO2 abatement cost associated with a $100/ton CO2 price could be $950/ton. The reason is that CO2 prices and CO2 abatement costs are very different things. As shown on the chart above, the CO2 abatement cost depends on how much CO2 is actually abated. If a CO2 price is imposed, and no one actually abates their CO2, then you have simply imposed a consumption tax.
Is this risk realistic? Different studies show that the price-elasticity of energy demand is relatively low. One good meta-study finds an average price-elasticity of 13% (here). In other words, a 100% increase in energy prices would likely only reduce energy demand by 13%. Using our data-file below, we estimate that a $100/ton CO2 price, if imposed overnight, would increase retail energy prices by around 35%, which in turn would most likely reduce energy demand (and with it CO2) by around 5%. So if anything, our suggestion of a $950/ton CO2 abatement cost from a $100/ton CO2 price is 2x too low.
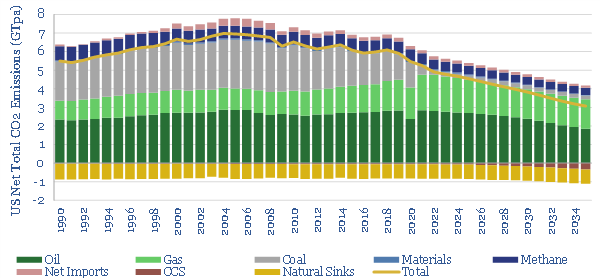
The objective of a CO2 price, however, is to incentivize deep changes across an economy, in order to reduce emissions. We studied one such scenario for the US last year (link here). This work found that by 2035, a CO2 price gradually rising to above $100/ton could eliminate around half of all US CO2 emissions (chart below). Here, the CO2 abatement cost comes out at c$180/ton. 50% of emitters continue emitting, and pay $100/ton of CO2 prices ($50). The other 50% of emitters incur an average of $80/ton of CO2 abatement costs to eliminate their CO2 ($40). The total cost is $90. This translates into a CO2 cost of $180/ton, because c50% of emissions are abated on this model.
One problem of this model is that many of the technologies that need to be incentivized have a much higher incentive price than $100/ton. As an illustration, some of the direct subsidies currently offered to different transition technologies are shown below, translated into $/ton terms. A $100/ton CO2 price clearly does not incentivize a technology costing $200-700/ton. So complex additional subsidies would also be needed.
A much more effective iteration of the model allows nature-based solutions into the solution set. Specifically, companies that sponsor reliable nature-based offset projects can use the CO2 abatement from these projects as a credit against CO2 price payments. First, allowing these nature-based offsets is the only way that many industries can realistically get to ‘zero’ CO2. Second, the costs are much lower, and our roadmap to net zero finds that the entire global economy could be decarbonized for an average cost of $40/ton, if 25% of the heavy-lifting is done via nature-based methods (note here).
What is interesting about this scenario, returning to the chart below, is that the average CO2 abatement cost in our ‘best case’ comes in at $40/ton. This is to say, 0% of emitters continue emitting and paying the $100/ton CO2 price (why would you, if you could source nature-based carbon offsets for a much lower price, of $3-50/ton). 100% of erstwhile emitters pay an average abatement cost of $40/ton. And this offsets 100% of emissions, hence the total CO2 abatement cost also comes in at $40/ton.
Note the abatement cost is lower than the CO2 price, in this scenario. This also seems counter-intuitive at first glance. It is a function of two variables: the abatement cost is lower than the CO2 price, and a very high portion of CO2 is being abated. As another example, imagine the government declares a $1,000 fine for anyone caught wearing a yellow T-shirt tomorrow. As a result, no-one wears a yellow T-shirt. The total cost of this policy is therefore zero.
Achieving a low cost transition matters, as our recent work finds that inflation could de-rail high-cost transition pathways (note below). We conclude that CO2 prices can be very powerful. But to be cost-effective, they must genuinely drive decarbonization, rather than simply taxing continued emissions. This is best achieved by integrating nature-based carbon offsets into CO2 pricing frameworks, in our view.
This website uses necessary cookies. Our cookies are simply to improve your experience. We do not undertake any advertising or targeting via our cookies. By clicking 'accept' or continuing to use the website, you consent to our use of cookies.AcceptRead More
Privacy & Cookies Policy
Privacy Overview
This website uses cookies to improve your experience while you navigate through the website. Out of these, the cookies that are categorized as necessary are stored on your browser as they are essential for the working of basic functionalities of the website. We also use third-party cookies that help us analyze and understand how you use this website. These cookies will be stored in your browser only with your consent. You also have the option to opt-out of these cookies. But opting out of some of these cookies may affect your browsing experience.
Necessary cookies are absolutely essential for the website to function properly. This category only includes cookies that ensures basic functionalities and security features of the website. These cookies do not store any personal information.
Any cookies that may not be particularly necessary for the website to function and is used specifically to collect user personal data via analytics, ads, other embedded contents are termed as non-necessary cookies. It is mandatory to procure user consent prior to running these cookies on your website.