Border taxes: a carbon curtain has descended?

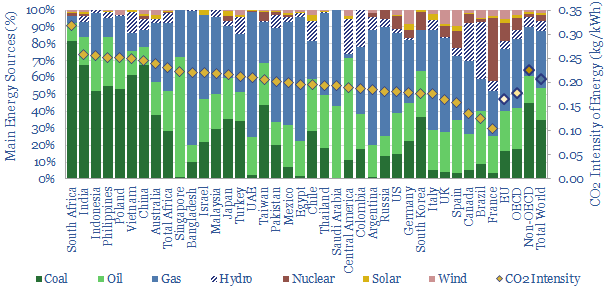
World CO2 Intensity

As Europe advances its decarbonization agenda, a โ€˜border adjustment mechanismโ€™ has now been proposed to mitigate carbon leakage. Its initial formulation is modest. But it will snowball. And ultimately divide the global economy in two. Hence this 15-page report lays out our top five predictions for CO2 border taxes to reshape energy markets and the world.


In 1946, Winston Churchill made his famous ‘Iron Curtain’ speech, prophesizing decades of tensions between different economic systems in the West and elsewhere. The concept of a carbon curtain is similar, and is laid out on pages 2-4 of our report.

These wheels are now firmly in motion, as Europe has proposed a carbon border adjustment mechanism, in order to stem carbon leakage, as it tightens its environmental policies. For those who prefer not to read the Commission’s entire 291-page leviathan, we have summarized the key features on pages 5-6.

Expansion is inevitable. Page 7 argues for domino effects, where CBAM will be emulated by other Western economies; and then broadened, first into the manufacturing sector, then universally.

There will be five investable consequences of these escalating border taxes, which we spell out on pages 8-15. They could be extremely constructive for the gas/LNG industry, pre-existing renewables assets, and some lower carbon economies. But we also see major losers in the coal industry, higher-carbon countries and victims of inflation.

LNG in the energy transition: rewriting history?

Outlook for LNG in the energy transition

A vast new up-cycle for LNG is in the offing, to meet energy transition goals, by displacing coal and improving industrial efficiency. 2024-25 LNG markets could by 100MTpa under-supplied, taking prices above $9/mcf. But at the same time, emerging technologies are re-shaping the industry, so well-run greenfield projects may resist the cost over-runs that marred the last cycle. This 18-page note outlines who might benefit and how.


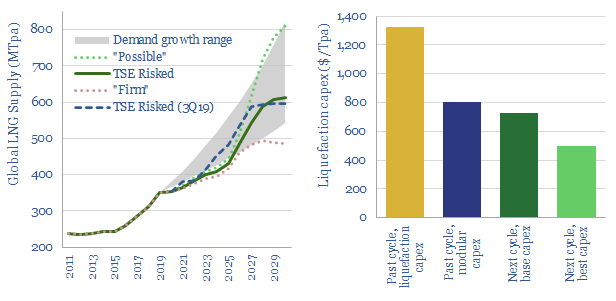
Global LNG supplies need to rise at an 8% CAGR to meet the energy transition objectives in our decarbonization roadmaps for China, Europe and broader industrial heat, as spelled out on pages 2-4.

But global LNG supplies are currently only set to rise at half of this rate, leaving a potential supply gap of 100MTpa by mid-decade, exacerbated by delays and deferrals amidst COVID (page 5).

Marginal costs for the LNG industry are disaggregated on pages 6-8, based on a detailed breakdown of capex costs, including upside-downside analysis of project characteristics.

Can future projects resist re-inflation if the industry undergoes a vast new up-cycle, as foreseen in our models? We present our reasons for optimism on pages 9-14, outlining evidence from 40 recent patents, plus the best new technologies from technical papers. This shows what the most resilient and lowest-risk projects will look like.

Beneficiaries in the LNG supply chain are described on pages 15-16, including next-generational modularization technologies, drone technologies to de-risk construction and the use of additive manufacturing for hard-to-manufacture components.

Beneficiaries among new LNG projects are described on pages 17-18, profiling examples and opportunities.

Prevailing wind: new opportunities in grid volatility?

UK wind power

UK wind power has almost trebled since 2016. But its output is volatile, now varying between 0-50% of the total grid. Hence this 14-page note assesses the volatility, using granular, hour-by-hour data from 2020. EV charging and smart energy systems screen as the best new opportunities. Gas-fired backups also remain crucial to ensure grid stability. The outlook for grid-scale batteries has actually worsened. Finally, downside risks are quantified for future realized wind power prices.


This rise of renewables in the UK power grid is profiled on page 2, showing how wind has displaced coal and gas to-date.

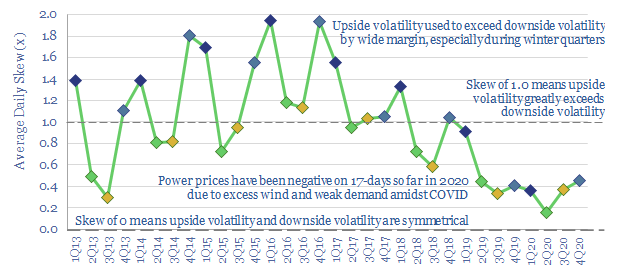
But wind is volatile, as is shown on page 3, thus the hourly volatility within the UK grid is 2.5x higher than in 2016.

Power prices have debatably increased due to the scale-up of wind, as shown on page 4.

But price volatility measures are mixed, as presented on pages 5-6. We conclude that the latest data actually challenge the case for grid-scale batteries and green hydrogen.

Downside volatility has increased most, as is quantified on pages 7-8, finding a vast acceleration in negative power pricing, particularly in 2020.

The best opportunities are therefore in absorbing excess wind power. EV charging and smart energy systems are shown to be best-placed to benefit, on pages 9-10.

Upside volatility in power prices has not increased yet, but it will do, if gas plants shutter. The challenge is presented on pages 11-13, including comparisons with Californian solar.

Future power prices realized by wind assets are also likely to be lower than the average power prices across the UK grid, as is quantified on page 14. This may be a risk for unsubsidized wind projects, or when contracts for difference have expired.

Deep blue: cracking the code of carbon capture?

blue hydrogen carbon capture

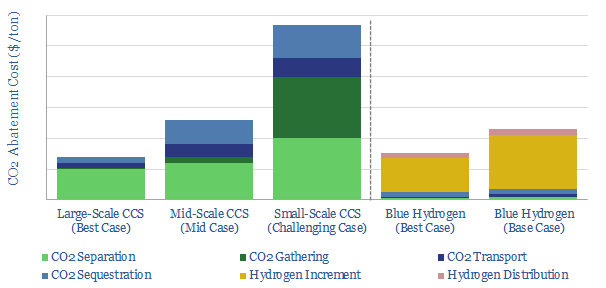
Carbon capture is cursed by colossal costs at small scale. But blue hydrogen may be its saviour. Crucial economies of scale are guaranteed by deploying both technologies together. The combination is a dream scenario for gas producers. This 22-page note outlines the opportunity and costs.


The mechanics of carbon capture and storage projects are explained on pages 2-4, assessing the costs of CO2 capture, CO2 transport and CO2 disposal in turn.

However CCS faces challenges, which are outlined on pages 4-5. In particular, CO2 has three ‘curses’ at small scale, which dramatically inflate the costs.

We quantify the three curses’ impacts. They are diffuse CO2 concentrations (pages 6-8), high fixed costs for pipelines and disposal facilities (pages 8-10) and difficulties gathering CO2 from dispersed turbines and boilers (pages 10-11).

The rationale for blue hydrogen is to overcome these challenges with CCS, as explained on page 12.

Different blue hydrogen reactor designs are discussed, and their economics are modelled on pages 13-15. Autothermal reforming should take precedence over steam methane reforming as part of the energy transition.

Midstream challenges remain. But we find they are less challenging for blue hydrogen than for green hydrogen on page 16.

A scale-up of blue hydrogen is a dream scenario for the gas industry. The three benefits are superior volumes, pricing power and acceptance in the energy transition, as explained on pages 17-19.

Leading projects are profiled on page 20, which aim to combine blue hydrogen with CCS.

Leading companies in auto-thermal reforming (ATR) are profiled on page 21, based on reviewing technical papers and over 750 patents.

Aker Carbon Capture’s technology is profiled on page 22. Patents reveal a technical breakthrough, but it will only benefit indirectly from our blue hydrogen theme.

Hydrogen: lost in transportation?

Costs of hydrogen transportation

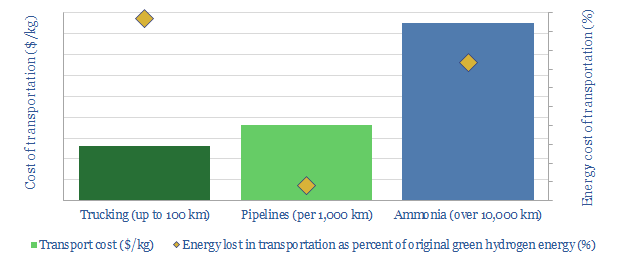
Transporting hydrogen will be more challenging than for any other commodity ever commercialised in the history of global energy. This 19-page note reviews the costs and complexities of cryogenic trucks, hydrogen pipelines and chemical hydrogen carriers (e.g., ammonia). Midstream costs will be 2-10x higher than comparable gas value chains, while up to 50% of hydrogenโ€™s embedded energy may be lost in transportation.


We have assessed the costs of green hydrogen value chains in our prior research, focusing on power and trucking. The costs are re-capped on pages 2-3. But our calculations assume all hydrogen is generated near its point of sale. This note assesses the additional costs and complexities of hydrogen transport.

Hydrogen is inherently more complex to transport than natural gas, due to immutable physical and chemical differences, which are spelled out on pages 4-5.

Cryogenic trucks are assessed on pages 6-7. Liquefying hydrogen at -253C and the associated boil-off may consume c50% as much energy as is in the delivered hydrogen.

New hydrogen pipelines are assessed on pages 8-12, including a deep-dive into the fluid mechanics. Costs will inherently be 2-10x higher than for natural gas.

Blending hydrogen into pre-existing gas pipelines is assessed on pages 13-14. This option introduces unfathomable complexity for a mere 3-6% CO2 reduction.

Chemical carriers such as ammonia are assessed on pages 15-17. We model the value chain end-to-end, which makes for interesting conclusions on Air Products’s recently sanctioned $7bn hydrogen-ammonia project in Saudi Arabia.

The impact on hydrogen costs is quantified on pages 18-19. We conclude hydrogen transport would increase our power and trucking costs by c10-25%.

The future of offshore: fully subsea?

Fully Subsea Solutions

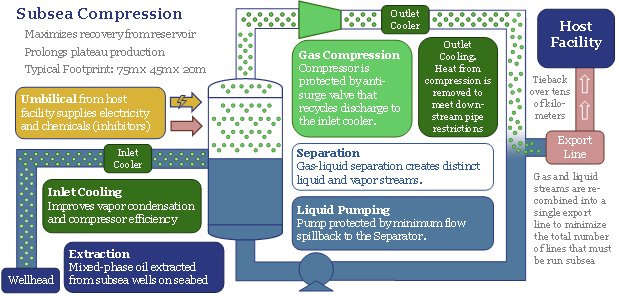
Offshore developments will change dramatically in the 2020s, eliminating new production platforms in favour of fully subsea solutions. The opportunity can increase a typical projectโ€™s NPV by 50%, reduce its breakeven by one-third and effectively eliminate upstream CO2 emissions. We have reviewed 1,850 patents to find the best-placed operators and service providers, versus others that will be disrupted. Overall, the theme supports the ascent of low-carbon natural gas, which should treble in the energy mix by 2050. This 22-page note presents the opportunity.


The offshore oil and gas industry’s progress towards ‘fully subsea’ developments, without any platforms or surface infrastructure being necessary, is reviewed in detail in pages 2-5, covering key projects and milestones from 1985-2000.

30% economic savings in both capex and opex are quantified line-by-line, across c50 cost lines, in pages 6-9.

1.5x NPV uplifts and 4pp IRR uplifts are quantified by modelling a representative fully greenfield gas-condensate project on pages 11-12.

CO2 emissions can be virtually eliminated by a fully subsea development solution. Pages 12-13 add up the impacts of higher efficiency, power from shore, fewer materials and the elimination of PSV/helicopter trips.

The key engineering challenges for fully subsea systems, which remain to be resolved, are summarized on page 14.

Who benefits from the trend toward fully subsea systems, is described from page 15 onwards after reviewing 1,850 patents around the industry. This includes both the leading service companies and operators (primarily Equinor, but also TOTAL, Shell).

The leaders in subsea compression technology are assessed on pages 16-17.

The leaders in subsea power systems are described on pages 18-19.

The leaders in next-generation subsea robotics are assessed on pages 20-21.

Others are disrupted, as is described in detail in page 22.

Covered service companies in the report include ABB, Aker, Eelume, GE, Kraken, Oceaneering, OneSubsea, Saipem, Siemens, Technip-FMC, Wood Group, the PSV and helicopter sector, and c20 early stage companies in next-generating subsea robotics.

Ten Themes for Energy in the 2020s

We presented our ‘Top Ten Themes for Energy in the 2020s’ to an audience at Yale SOM, in February-2020. The audio recording is available below. The slides are available to TSE clients, in order to follow along with the presentation.


Please sign up to our distribution list, to receive our best ideas going forwards…

Decarbonized power: how much wind and solar fit the optimal grid?

when will wind and solar peak?

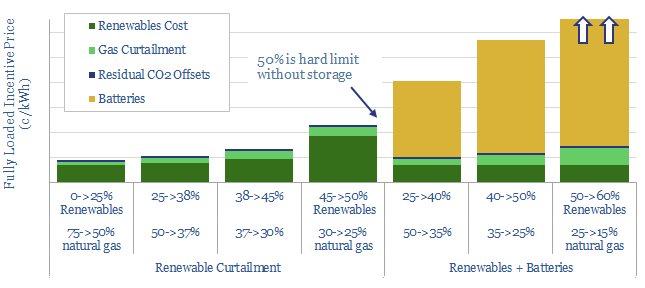
What should future power grids look like? Our 24-page note optimizes cost, resiliency and CO2, using a Monte Carlo model. Renewables should not surpass 45-50%. By this point, over 70% of new wind and solar will fail to dispatch, while incentive prices will have trebled. Batteries help little. They raise power prices by a further 2-5x to accommodate just 3-15% more renewables. The lowest-cost, zero-carbon power grid, we find, comprises c25% renewables, c25% nuclear and c50% decarbonized gas, with an incentive price of 9c/kWh.


Pages 2-4 illustrate the volatility of wind and solar generation at today’s grid penetration, providing rules of thumb around intermittency.

Pages 5-6 illustrate the strange consequences once renewables surpass 25% of the grid, including curtailment, negative power pricing and financing difficulties.

Pages 7-9 quantify and explain how much curtailment will take place in a typical grid as renewables scale from 25% to 40%, 50% and 60% of gross generation, using a Monte Carlo approach. The model shows when and why curtailment is occurring.

Pages 10-20 quantify and explain the costs of batteries, to backstop renewables as they scale from 25%, to 40%, 50% and 60% of the grid, while avoiding curtailment. Real world conditions are not conducive to competitive battery economics.

Pages 21-23 quantify the residual reliance on natural gas. Amazingly, even our most aggressive battery scenarios only permit 10% of gas-power capacity to be shuttered. Low-utilization gas is costly. High-utilization gas is less costly. And the economics of decarbonized gas are superior to any renewables plus batteries combination.

Page 24 concludes that natural gas will emerge as the ‘best battery’ to backstop renewables, estimating the most likely shares in an optimal power mix.

Electric Vehicles Increase Fossil Fuel Demand?

EVs increase fossil fuel demand

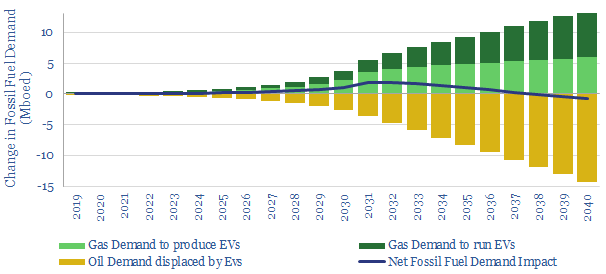
It is widely believed that electric vehicles will destroy fossil fuel demand. We find EVs will increase fossil fuel demand by 0.7Mboed from 2020-35.  EVs only start lowering net fossil fuel demand from 2037 onwards. The reason is that 3.7x more energy is consumed to manufacture each EV than the net road fuel it displaces each year; while the manufacturing of EVs is seen growing exponentially. The finding is a strong positive for natural gas, as outline in our new 13-page note.


Pages 2-3 outline our oil demand forecasts out to 2050, reflecting the rise of electric vehicles and six other game-changing technologies.

Pages 4-5 lay out the energy costs manufacturing EVs, based on new, granular details from the recent technical literature.

Pages 6-9 model the exponential rise of electric vehicles, and how rapidly increasing manufacturing energy could outweigh slowly increasing fuel savings.

Pages 10-13 consider pushbacks to our thesis that EVs increase fossil fuel demand, including the use of renewable technology, battery innovations or vehicle autonomy.

MCFCs: what if carbon capture generated electricity?

Molten Carbonate Fuel Cells

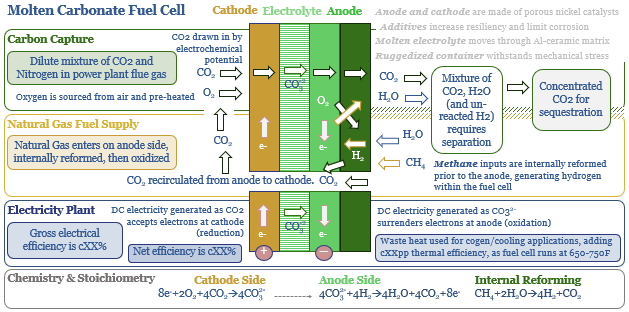
Molten carbonate fuel cells (MCFCs) could be a game-changer for CCS and fossil fuels. They are electrochemical reactors with the unique capability to capture CO2 from the exhaust pipes of combustion facilities; while at the same time, efficiently generating electricity from natural gas. The first pilot plant was due to be tested in 1Q20, by ExxonMobil and FuelCell Energy, but was deferred. Economics range from passable to phenomenal. The opportunity is outlined in our 27-page report.


Pages 2-4 outline the market opportunity for more efficient carbon separation technologies, which can be retrofitted to 4TW of pre-existing power plants, without adding $50/T of cost and 15-30% of energy penalties per traditional CCS.

Pages 5-13 outline how MCFCs work, including their operation, development history, how recent patents promise to overcome reliability problems, and their emergent adaptation to carbon capture.

Pages 14-18 assess the economics, both in absolute terms, and by comparison to new gas plants and hydrogen fuel cells. CCS-MCFC economics range from passable to phenomenal, at recent power prices.

Pages 19-23 suggest who might benefit. Fuel Cell Energy has received $60M investment from ExxonMobil, hence both companies’ prospects are explored.

Appendix I is an overview of incumbent CCS technologies, and their limitations.

Appendix II is an overview of six different fuel cell types, comparing and contrasting MCFCs.

Copyright: Thunder Said Energy, 2019-2024.