Scope 4 CO2 emissions reflect the CO2 avoided by an activity. This 11-page note argues the metric warrants more attention. It yields an ‘all of the above’ approach to energy transition, shows where each investment dollar achieves most decarbonization and maximizes the impact of renewables.
Scope 1-3 CO2 emissions are now familiar to most decision-makers. Scope 1 captures the CO2 emitted directly in creating a product. Scope 2 adds the CO2 emitted in generating electricity used to create the product. And Scope 3 adds the CO2 emitted in using the product, for example, by combusting it. A summary is presented by fuel and by material on pages 2-3, with the implication that ‘everything is bad, only some things are less bad than others’.
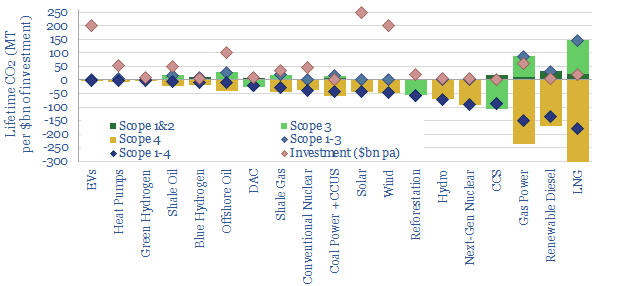
Scope 4 CO2 is intended as an antidote to the depressed conclusion that ‘everything is bad’. It considers the CO2 avoided by an activity. Working from home avoids the CO2 of a commute. Building a wind farm may displace CO2-intensive coal. So too might developing a gas field. Thus the purpose of this note is to construct Scope 1-4 CO2 calculations for 20 different energy technologies, fairly, objectively, and then draw conclusions. The numbers are remarkable (page 4).
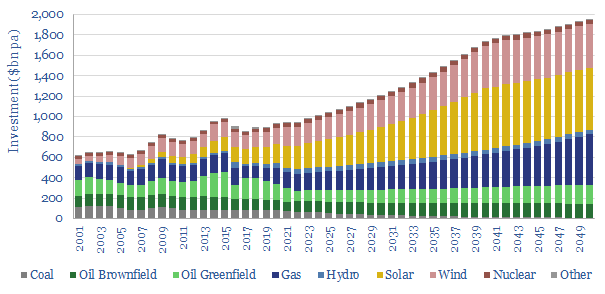
‘All of the above’. Every single option in our chart above has net negative Scope 1-4 CO2 emissions. The more investment that flows in to all of these categories, the faster the world will decarbonize. Our overall roadmap to net zero needs to treble global energy capex to over $3trn pa (pages 4-8).
Project developers and investors should consider Scope 4 CO2. Many categories with deeply negative Scope 1-4 CO2 emissions — sometimes achieving 3x more net CO2 abatement per $1bn of investment than wind, solar and EVs — have been unsuccessful in attractive capital. It may therefore be appealing for project-developers to present Scope 1-4 CO2 benefits on a clear and transparent basis. It may also be appealing for investors to communicate the Scope 1-4 CO2 of their portfolios to their own stakeholders (page 9).
Maximizing decarbonization. Scope 4 CO2 emissions depend on counterfactuals. What is an activity displacing? This matters across the board and can also promote faster decarbonization. For example, a new wind project that displaces nuclear achieves no net decarbonization, whereas an inter-connector that allows that same wind project to displace coal-power avoids 1.2 kg/kWh of CO2 (page 10).
Conceptual limitations of Scope 4 CO2 are discussed on page 11. However, we conclude it is an increasingly important metric for decision makers in the energy transition, to ensure adequate energy supplies are developed, while also decarbonizing as fast as possible.
Dispersion in global gas prices has hit new highs in 2022. Hence this 17-page note evaluates two possible solutions. Building more LNG plants achieves 15-20% IRRs. But displacing industrial gas demand in Europe, then re-locating it in gas-rich countries can achieve 20-40% IRRs, lower net CO2 and lower risk? Both solutions should step up. What implications?
Global gas price dispersion is hitting new highs, with the best geographies remaining consistently below $2.5/mcf, but many others spiking to peak prices in 2022. Theories of gas price dispersion are laid out on pages 2-3, while we present data and conclusions on 20 different countries’ gas prices on pages 4-6.
Will it accelerate renewables? An interesting observation is that the countries with spiking gas prices are already deploying renewables ‘as fast as feasible’. Whereas it is often the countries with very low gas prices that have very low renewables deployment (page 7).
Will it accelerate LNG? In theory yes. Our expectations for future gas prices should unlock 15-20% IRRs at new LNG projects, and our growth forecasts are on page 8.
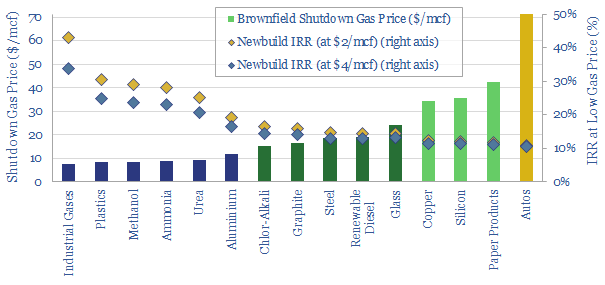
Will it accelerate industrial re-location, away from geographies with high-priced gas, and towards geographies with low-cost gas. This is the main focus of the note. And we think greenfield industrial facilities can earn 20-40% future IRRs if they are sited in geographies with low-priced gas. By contrast, we have constructed a ‘shutdown curve’ showing what gas prices are needed to free up 13bcfd of industrial gas demand in Europe. Our modelling framework is explained on pages 10-12.
There are further economic and ESG advantages to re-locating industry to gas-rich countries, compared with exporting their gas. They are quantified on pages 13-14.
Who benefits? We outline examples of leading companies in gas-rich countries on pages 15-16. This includes both emerging world producers, US E&Ps and US industrial companies that have featured in our research to-date.
Finally, for the renewables and LNG industries, we would highlight that this analysis is not an either-or. We will need all solutions to alleviate energy shortages. Yet displacing industrial gas demand in Europe may mute the kind of runaway cost-inflation that de-railed the LNG industry in the 2010s, and threatens the renewables industry in the 2020s (page 17).
Spot markets have delivered more and more ‘commodities on demand’ over the past half-century. But is this model fit for the energy transition? Many markets are now desperately short, causing explosive price rises. And sufficient volumes may still not be available at any price. So this 13-page note on energy commodities considers a renaissance for long-term contracts and who might benefit?
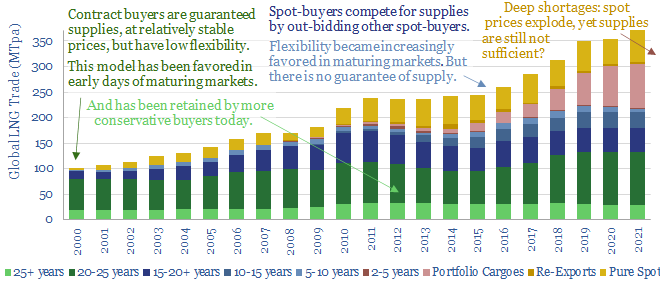
Liquid spot markets have long been seen as the apotheosis of commodities. Over time, small and immature markets are supposed to graduate towards ever-greater liquidity. Ultimately, the entire market is to be bought and sold at the prevailing prices on some highly liquid exchange, where any seller in the market can reach any buyer in the market, and vice versa. It is a kind of “commodities on demand” model. The history and evolution of this model is laid out on pages 2-3. But 2022 is showing its limitations.
Challenge #1 for liquid spot markets is that prices can explode in a shortage. We review energy costs, price elasticity factors, and their consequences on pages 4-6.
Challenge #2 for liquid spot markets is that even after prices explode, sufficient supplies may still not be available at any price. We zoom in on LNG as an example on pages 7-8. A country that has 90% of its supplies locked in on contracts is clearly going to fare very differently in 2022-23 than one that had planned to source 90% of its supplies from the spot market.
Challenge #3 is securing future supplies amidst uncertainty. No one wants to finance a 20-year project where prices could collapse, volumes could collapse or the commodity in question could even be banned outright. As an OPEC oil minister recently stated “it isn’t going to work like that”.
Could all of this point to a renaissance for long-term contracts? On pages 11-13, we outline what this might look like, who might benefit, and some possible pushbacks.
For an outlook on our top 10 energy commodities with upside in the energy transition, please see our article here.
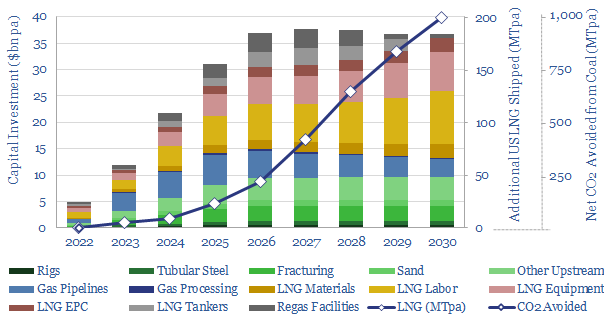
Perceptions in the energy transition are likely to change in 2022, amidst energy shortages, inflation and geopolitical discord. The biggest change will be a re-prioritization of US LNG. At a $7.5/mcf delivered price, there is 200MTpa of upside by 2030, which could also abate 1GTpa of global CO2. This 15-page note outlines our reasoning and conclusions.
Pragmatic solutions are increasingly needed in the energy transition, in order to avoid painful energy shortages, double-digit inflation and geopolitical discord. We review each of these challenges on pages (2-6), concluding that a 50-60% decarbonization solution (i.e., LNG) is increasingly going to seem better than no solution.
Meanwhile, on the other side of the Atlantic Ocean, there is an industry with the capability to supply 200MTpa of incremental gas to Europe (26bcfd), flexibly, for a competitive price point of $7.5/mcf, ramping up in the late-2020s. We outline the economics on pages 7-8.
The CO2 credentials are for 50-60% lower CO2 per unit of delivered energy versus coal. Each MTpa of LNG avoids around 5MTpa of net CO2 emissions. And we expect most of the LNG will be ‘Clear LNG’ with no embedded Scope 1&2 emissions (page 9).
The challenges and bottlenecks for achieving this US LNG ramp are addressed on page 10-14, again integrating across our models. The capex, materials, labor and land bottlenecks are all at least 95% less demanding than an equivalent energy ramp from ‘renewables only’.
Our conclusions are spelled out on page 15, ending with a discussion of ‘who benefits’ from the theme.
Further research. Our outlook on 300 offtake contracts across the global LNG industry is linked here.
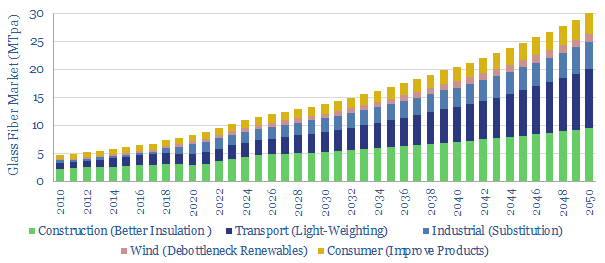
What opportunities for glass fiber in the energy transition? Glass fiber makes up 50% of a wind turbine blade, lightens vehicles and insulates homes for 30-70% energy savings. Hence we see demand rising 3.5x in the energy transition. To appraise the opportunity, this 13-page note assesses the market, costs, CO2 intensity and leading companies.
6% of the global glass market is sold in the form of fibers, a mesh of 4-40μm thick filaments. They can be used directly as an insulation material, or woven into a fabric and embedded in a polymer resin matrix, yielding ‘fiberglass’. These production processes are summarized on pages 2-3.
Applications in the energy transition are then quantified on pages 4-7, including for wind turbine blades, insulation of homes, light-weighting vehicles and substituting for higher-cost and higher-carbon alternative materials. This underpins our forecast for 3.75x market growth.
The energy economics of producing glass fiber are modelled on pages 8-10, in order to quantify the marginal cost, cost breakdown, energy intensity and CO2 emissions of glass fiber product.
The biggest challenge for the industry is industrial leakage, as we find that some product made in the emerging world can undercut the West by c50% on price, despite having 2x higher CO2 intensity (page 11).
The company landscape is summarized on pages 12-13. There are four main listed companies (2 in China, 2 in the West). Interestingly, private equity firms have recently been buying up European pure-plays.
Coal provided 25% of the world’s primary energy in the past three years, but 40% of all global CO2 emissions. Gas also provided 25% of the world’s primary energy but just 15% of the CO2 (data below). In other words, gas’s CO2 intensity is 50% less than coal’s. The purpose of today’s short note is to explain the different carbon intensities from first principles.
Explanation #1: half the energy in gas is from hydrogen
Burning coal releases energy as carbon is converted into CO2. In other words, substantively all of the energy from coal combustion is associated with CO2 emissions.
Burning gas releases energy as methane (CH4) is converted into CO2 and H2O. In other words, just over half of the energy from gas combustion is associated with innocuous water vapor, and just less than half is associated with CO2 emissions.
This is simple chemistry. For many decision-makers, this chemistry is sufficient to explain why switching all of the world’s future potential coal energy to gas energy can directly underpin one-fifth of the decarbonization on realistic roadmaps to net zero (note below). For others, who want to get into the nerdy details of bond enthalpies, we have written the note below.
If you wish to delve deeper into the numbers behind gas and coal’s CO2 intensities, then our discussion below will help you understand the thermodynamic calculations. As an ongoing reference, the numbers are also spelled out in our bond enthalpy data-file.
Bond enthalpies. Atoms are bonded together into molecules. ‘Bond Enthalpy’ denotes the total thermodynamic energy that is contained in each of these bonds (data here), as determined by fundamental electromagnetic forces that define the universe (note here). In other words, bond enthalpy is the minimum amount of energy that must be supplied in order to dissociate the atoms on either side of the bond; and the maximum amount of energy that could be harnessed when these atoms bond together.
Bond enthalpies are often quoted in kJ/mol. As a reminder, 1 Joule is the energy transferred when a force of 1 Newton acts over a distance of 1 meter; or when 1 Watt of power is exerted for 1 second; or when a current of 1 Amp flows through a resistance of 1 ohm. And 1 mol is a standard for counting the numbers of atoms or atomic reactions, described 6.022 × 10²³ units. This precise number, in turn, was chosen so that 1 mol of protons would have a mass of 1g, and all larger molecules would have an atomic mass that effectively matches their atomic number of protons and neutrons.
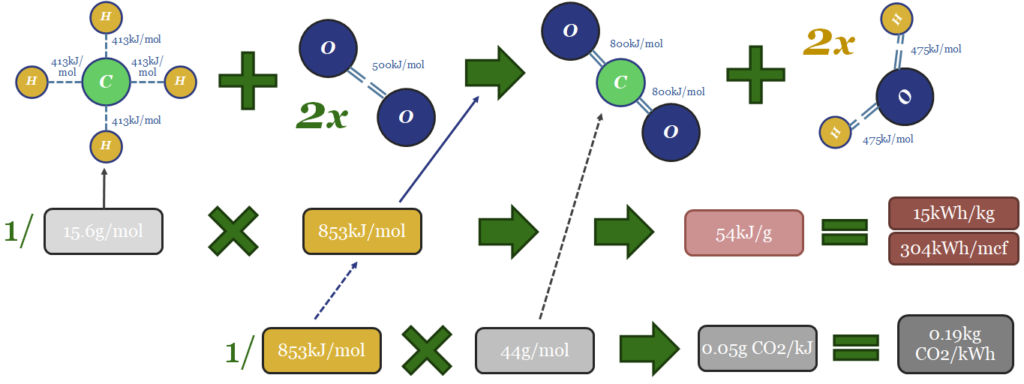
Thus the thermodynamics of gas can be computed from bond enthalpies in the image below. Breaking the bonds in the methane molecule requires 1,652 kJ/mol of input energy. Breaking the bonds in 2 x O2 molecules requires 996kJ/mol. Total bond-breaking energy is 2,648kJ/mol. On the other side of the equation, forming the bonds in 1 CO2 molecule releases 1,598kJ/mol. And forming the bonds in 2 x H2O molecules releases 1,903kJ/mol. Total bond-making energy is 3,501kJ/mol (of which 54% is from forming water molecules). Subtract 2,648 from 3,501, and the result is 853kJ/mol of total energy being released. 1 kJ = 0.2778 Wh. So with some unit juggling, we arrive at 15kWh/kg of energy generation, or 304kWh/mcf of gas (at 48.7mcf of gas per ton; or 48.7bcf per MTpa for those who prefer LNG units).
The CO2 emissions will include 1 mol of CO2 per mol of methane. That mol of CO2 weighs 44 grams. Hence if you divide 44 grams by 853kJ, the result is 0.05 g of CO2 per kJ. Divide by 0.2778kWh/kg and the result is 0.19kg of CO2 per kWh. Multiply by 304kWh/mcf and the result is 56kg of CO2/mcf.
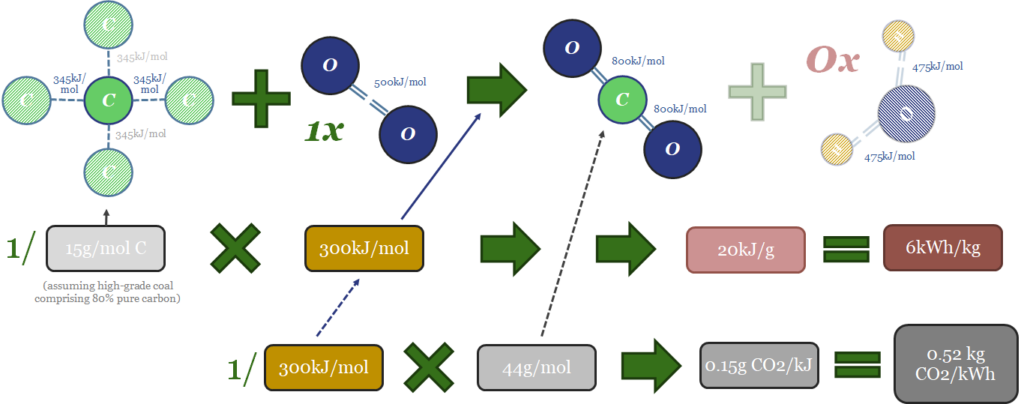
Likewise the thermodynamics of coal can be computed in the same way. Forming each mol CO2 from C and O releases releasing 1,598kJ/mol. That side of the equation of the easy. Next, if the coal was perfect, pure carbon then the energy that would need to be supplied for bond breaking would be 50% x 4 x C-C bonds at 346kJ/mol (692kJ/mol total), plus 1 x O=O bond (498kJ/mol), for a total bond-breaking energy of 1,190kJ/mol. But in practice, we assume that coal is usually only 80% carbon, while remaining impurities include water (which must be evaporated off), sulphur, nitrogen and other ashy impurities. It will vary grade-by-grade. But on average we think 300kJ/mol is a sensible assumption for the energy release. This yields some important conclusions…
(a)300kJ of energy is released when 1 mol of coal combustion occurs. This is 65% less than when 1 mol of gas is burned. The main reason, as stated above, is that the coal combustion reaction does not generate any energy from producing water vapor.
(b) 20kJ/gram or 6kWh/kg of energy is released per unit mass of coal consumption. This is c60% less than when an equivalent mass of methane is burned.
(c) Minimal extra mass, as we assume methane weighs 15.6g/mol, versus coal at 15g/mol of combustible carbon (pure carbon is 12g/mol, but we assumed high-grade coal has only 80% carbon). To re-iterate, this means that 1 kg of natural gas is generating 2.5x more energy than 1kg of coal. Again, the reason comes down to hydrogen atoms in methane, which generate 54% of the energy release when they are oxidized to H2O, but in a very dense package of mass. At 1g/mol, hydrogen atoms are much lighter than carbon atoms at 12g/mol and oxygen at 16g/mol. (The hydrogen industry is currently looking for the perfect hydrogen carrier — is it ammonia? is it toluene? — in our view, a near-perfect one already exists, it is called natural gas, and it comes straight out of the ground).
(d) 1 mol of CO2 is released when 1 mol of coal is combusted. This is the same as the amount of CO2 released when 1 mol of gas is combusted. But to re-iterate gas combustion generates around 2.5x more energy.
(e) CO2 intensity can be as high as 0.5kg/kWh for coal combustion. Again this is 2.5x higher than gas combustion, and we have derived the result that gas provides the same amount of energy as coal despite emitting 60% less CO2. There is nothing here except maths and science.
We have glossed over some important thermodynamic concepts in our explanation above. For completeness, we address them here. Those who are bored of abstruse academic details can probably skip ahead to the next section.
Strictly, the useful energy that can be obtained from combusting a fuel is not a pure function of bond enthalpies. You must also deduct a small amount for the change in entropy (Gibbs Free Energy = Enthalpy – T-Delta-S). We have not considered entropy changes in our numbers above. Neither coal nor gas combustion increase entropy by increasing the number of molecules in circulation. But both coal and gas combust with a flame temperature around 1,950C, which is going to increase the entropy of their surrounding thermodynamic systems and prevent their full bond enthalpies from being harnessed.
Another issue is higher versus lower heating values. Specifically, our schematic above showed the combustion of methane releasing 54kJ/g of energy, via the formation of CO2 and H2O. However, 5-10% of this ‘gross calorific value’ energy that is released will be lost in the water vapor. Water is a liquid at ambient temperatures and pressures. Vaporizing that water into an exhaust gas will absorb some of the energy from the combustion reaction. The amount depends on the atmospheric conditions. This is why textbooks quote the ‘net calorific value’ of methane closer at 50kJ/g at standard conditions of 0C and 1-bar. Vaporizing water is not an issue for coal combustion as there is effectively no water produced in that reaction. This narrows the ‘energy gap’ between gas and coal in practice.
Another issue is that our bond enthalpies for coal above were not quite right. We used the average bond enthalpies for Carbon-Carbon single bonds. But the carbon in coal may contain ring structures, aromatic compounds, unsaturated bonds, and particles that are not chemically bound together at all. All of this will most likely lower the bond enthalpies within coal. So our numbers for coal combustion enthalpy are imprecise, and probably a little bit too conservative. Moreover, the rocks found out in the world that we call “coal”, tend to physically contain other hydrocarbons, such as methane, within them. Overall, real world coal grades come in closer to 0.37 kg/kWh (data below).
Another issue is that ‘coal’ is a broad term, covering a range of different fuels, with different carbon contents and different impurities. These will vary. One useful online resource, suggests that energy content can range from 32.6kJ/g for the highest-grade pure anthracite coals, through to 30kJ/g for bituminous, 24kJ/g for sub-bituminous and 14kJ/k for lignite. In 2020, the average ton of coal produced in the US had a grade of 19.8 mmbtu/ton, equivalent to 5,800kWh/tonne, or 23kJ/g. This is probably a bigger issue for energy density per kg than it is for CO2 emissions per kWh.
Finally, coal may be moderately less likely to combust completely, producing small portions of soot and carbon monoxide, especially when burned in small-scale furnaces. This will detract from both the energy content and has a debatable impact on CO2 credentials.
(1) What about emissions across the supply chain?
One potential issue with the numbers we have presented above is that we also need to consider the CO2-equivalent emissions from the supply chains of producing gas and coal, respectively. If, for example, the emissions of producing natural gas were materially higher than the emissions of producing coal, then we would need to factor this in.
However, our analysis finds that often the total full-cycle emissions footprint of producing and distributing coal (usually 50kg/boe or higher) will be similar or higher than the emissions footprint of producing and distributing gas (10-60kg/boe). The free note below gives a full overview of the data we have reviewed here.
A second potential issue with our analysis could be if it were easier to extract the energy from coal than from gas. For example, capturing 80% of the energy from a 0.52kgCO2/kWh fuel would result in lower emissions than capturing 20% of the energy from a 0.2kgCO2/kWh fuel.
Yet again, the data we have reviewed points to higher combustion efficiencies on gas. Our models for a coal-fired power plant assume c40% efficiencies, while our models of combined cycle gas plants average 57% efficiencies, and we are particularly excited about emerging gas-fired CHP systems that can reach 80-90% total thermal efficiencies (note below).
A third factor that is worth considering is the ease of capturing the carbon from combusting coal and gas. We think there is nothing wrong with continued fossil energy use in a fully decarbonized global energy system, as long as the CO2 emissions from that fossil energy is fully captured or offset.
Across our work, we find there are mixed opportunities and challenges for integrating CCS with coal and gas, but it is 2.5x easier to integrate gas with nature-based carbon removals, because there is 60% less CO2 that needs to be offset in the first place.
CCS momentum has also stepped up impressively in the past year (notes below). Coal combustion might seem to have a natural advantage, as its CO2 exhaust stream tends to be c10% concentrated, versus 4% for gas combustion. However, we also find gas’s exhaust CO2 can be concentrated towards 10% by combustion technologies such as exhaust gas re-circulation, gas benefits from fewer impurities that can poison amine cocktails, emerging technologies such as blue hydrogen can decarbonize gas at source, and there are also practical ways of blending gas back-ups with renewables in fully decarbonized power grids (notes below).
The dimension that has most kept coal burning in the world’s energy mix is its absurdly low cost. A new mine requires $60/ton for a 10% IRR, equivalent to producing thermal energy for 1c/kWh (model below). Natural gas can actually beat this cost, as the best gas fields are economical below $1/mcf (0.3c/kWh), and we estimate that $2/mcf pricing can support passable IRRs in the shale industry (model also below). But on top of this, global gas value chains can bring delivered cost to $6-8/mcf (2-3c/kWh). The biggest challenge, we find, is that starving gas value chains of capital may have re-inflated marginal costs to $12-16/mcf (4-5c/kWh) (third note below).
The conclusion across our analysis above is that each TWH of energy that is generated from gas rather than coal will result in 50% less CO2, which will lower the burden that is placed on other decarbonisation technologies in our roadmap to net zero. Stated another way, each MTpa of LNG that is developed will likely go on to obviate 5MTpa of CO2 emissions.
So far in the energy transition, however, our depressed observation is that ideological fantasies may have delayed the implementation of real, low-cost and practical CO2 reductions, such as coal-to-gas switching. We think this may change in 2022, as energy shortages deepen (note below), and the world needs more pragmatic options, to accelerate its path towards net zero. Our lowest-cost roadmap to net zero by 2050 requires global gas output to rise by 2.5x.
This 18-page report revises our roadmap for the world to reach ‘net zero’ by 2050. The average cost is still $40/ton of CO2, with an upper bound of $120/ton, but this masks material mix-shifts. New opportunities are largest in efficiency gains, under-supplied commodities, power-electronics, conventional CCUS and nature-based CO2 removals.
Important note: our latest roadmap to net zero is from 2022, published here. But this note remains on our website, for transparency into our views at the end of 2021.
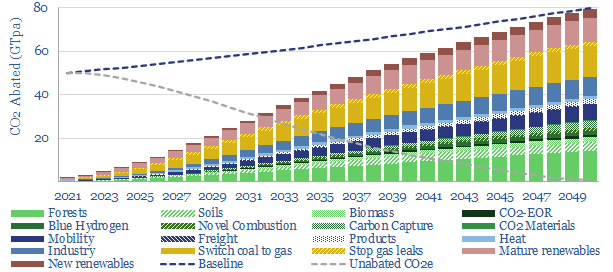
This note looks back across 750 of our research publications from 2019-21 and updates our most practical, lowest cost roadmap for the world to reach ‘net zero’. Our framework for decarbonizing 80GTpa of potential emissions in 2050 is outlined on pages 2-3.
Our updated roadmap is presented on pages 4-6. Most striking is the mix-shift. New technologies have been added at the bottom of the cost curve. Other crucial components have re-inflated. And we have also been able to tighten the ‘risking factors’ on earlier-stage technologies, thus an amazing 87% of our roadmap is not technically ready.
The resulting energy mix and costs for the global economy are spelled out on pages 7-8, including changes to our long-term forecasts for oil, gas, renewables and nuclear.
What has changed from our 2020 roadmap? A full attribution is given on pages 9-10. Disappointingly, global emissions will be 2GTpa higher than we had hoped mid-decade, as gas shortages perpetuate the use of coal.
A more detailed review of our roadmap is presented on pages 11-18. We focus on summarizing the key changes in our outlook in 2021, in a simple 1-2 page format: looking across renewables, nuclear, gas shortages, inflationary feedback loops, more efficiency gains, carbon capture and storage and nature-based carbon removals.
Global energy investment in 2020-21 has been running 10% below the level needed on our roadmap to net zero. Under-investment is steepest for solar, wind and gas. Under-appreciated is that each $1 dis-invested from fossil fuels must be replaced with $25 in renewables, to add the same new energy supplies. Future energy capex requirements are staggering. These are the conclusion in our 14-page note.
This 14-page note compares annual energy investment in different upstream energy sources with the amounts that would be required on our roadmap to net zero. The methodology is explained on page 2.
Current investment levels in each energy source are described on pages 3-5, reviewing the trajectory for each major category: oil, gas, coal, wind and solar. A stark contrast is found in capex per MWH of new added energy supplies.
We have constructed 120 different models, in order to stress-test the capex costs per MWH of new added energy supplies, across different resource types. Conclusions and comparisons from our modelling are presented on pages 6-8.
How much would the world need to be investing, on our roadmap to net zero, or indeed on the IEA’s roadmap to net zero? We develop our numbers, category by category, on pages 9-12, to identify where the gaps are greatest.
Conclusions and controversies are laid out on pages 13-14. Disinvestment from oil and gas will tend to exacerbate future energy shortages. To avoid this, it would be ideal to replace each dis-invested $1 of oil and gas investment with around $25 of new renewables investment.
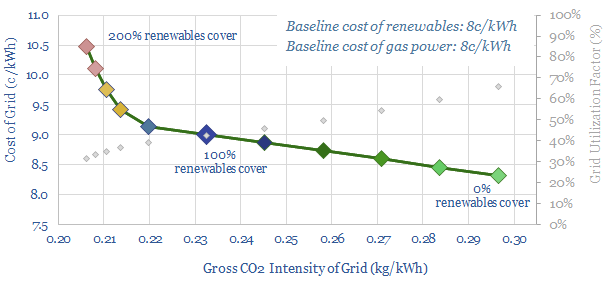
This 14-page note lays out a new model to supply fully carbon-neutral energy to a cluster of commercial and industrial consumers, via an integrated package of renewables, low-carbon gas back-ups and nature based carbon removals. This is remarkable for three reasons: low cost, high stability, and full technical readiness. The prize may be very large.
Four building blocks for a zero-carbon energy mix are outlined on pages 2-5. They include wind, solar, gas-fired CHPs and gas-fired CCGTs. Costs, CO2 intensities and key debates are reviewed for each technology.
Taking out the CO2 requires high-quality nature based carbon removals, for any truly ‘carbon neutral’ energy mix. Meeting this challenge is described on pages 5-7. There will be nay-sayers who do not like this model. To them, we ask, why do you hate nature so much?
Finding a fit requires combining the different building blocks above into an integrated energy system. We find the optimal fit is for renewables capacity to cover 110% of average grid demand. The balancing act is outlined on pages 8-10.
The gas supply chain that backs up the renewables must minimize methane leaks and use the gas as efficiently as possible. Our suggestions are laid out on pages 11-12.
The commercial benefits of this integrated model are described on pages 13-14. We think this is an excellent opportunity to provide fully carbon-neutral energy, using fully mature technologies, at costs well below 10c/kWh and highly bankable price-stability.
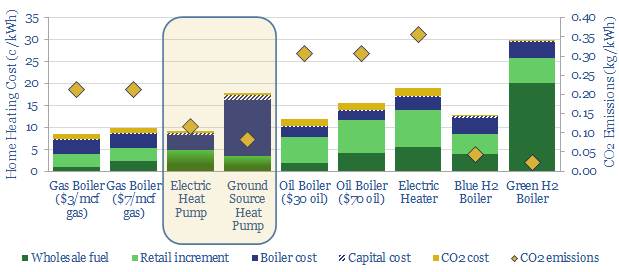
Some policymakers now aspire to ban gas boilers and ramp heat pumps 10x by 2050. In theory, the heat pump technology is superior. But in practice, there are ten challenges. Outright gas boiler bans could become a political disaster. The most likely outcome is a 0-2% pullback in European gas by 2030. We have also screened leading heat pump manufacturers in this 18-page note.
The opportunity for heat pumps in the energy transition is laid out on pages 2-3, as the IEA now advises that “bans on new fossil fuel boilers need to start being introduced globally in 2025, driving up sales of electric heat pumps”.
But are they ready for prime time? We have reviewed technical specifications, costs and consumer feedback on pages 4-13. The work suggests large heat pumps may not feasibly substitute for gas boilers in every context. There are ten crucial challenges for the industry to overcome.
Gas market impacts are quantified on pages 14-17. Our base case is that trebling heat pump capacity in Europe by 2030 will erode 2% of total gas demand. But rebound effects and under-performance could cut the net benefits to nil.
The best placed companies are explored in our detailed screening work (which we have used to select a heat pump provider for our own GSHP project in Europe). One company stands out in particular, having built-up an industry leading portfolio through acquisitions.
Cookies?
This website uses necessary cookies. Our cookies are simply to improve your experience. We do not undertake any advertising or targeting via our cookies. By clicking 'accept' or continuing to use the website, you consent to our use of cookies.AcceptRead More
Privacy & Cookies Policy
Privacy Overview
This website uses cookies to improve your experience while you navigate through the website. Out of these, the cookies that are categorized as necessary are stored on your browser as they are essential for the working of basic functionalities of the website. We also use third-party cookies that help us analyze and understand how you use this website. These cookies will be stored in your browser only with your consent. You also have the option to opt-out of these cookies. But opting out of some of these cookies may affect your browsing experience.
Necessary cookies are absolutely essential for the website to function properly. This category only includes cookies that ensures basic functionalities and security features of the website. These cookies do not store any personal information.
Any cookies that may not be particularly necessary for the website to function and is used specifically to collect user personal data via analytics, ads, other embedded contents are termed as non-necessary cookies. It is mandatory to procure user consent prior to running these cookies on your website.