Vehicle miles traveled are a crucial measure of mobility and an input variable for predicting global oil demand, averaging 8,600 miles per global vehicle in 2024. This data-file tracks vehicle miles traveled by region, over time, and how it co-varies with urbanization, population density, income, and by travel trip purpose.
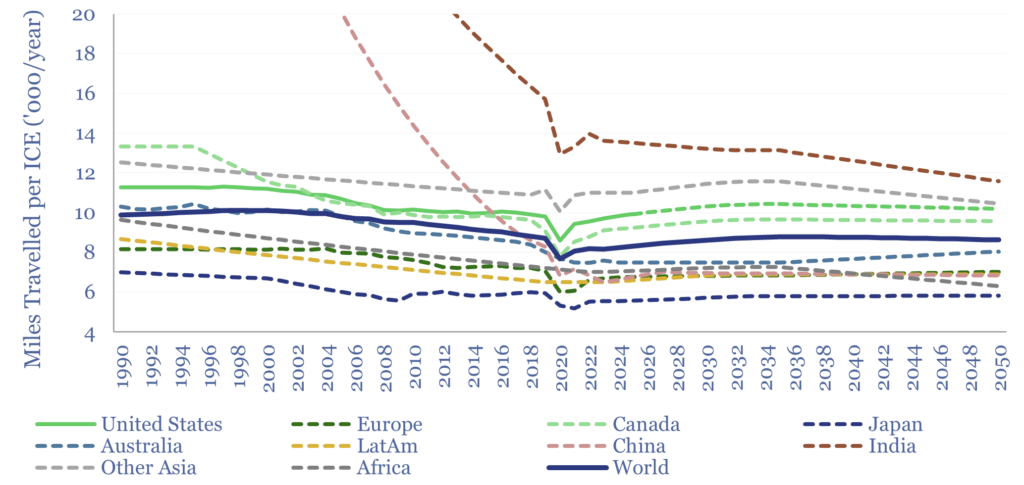
Oil demand in vehicles can be disaggregated as the number of ICE vehicles x miles driven per vehicle x fuel consumption per mile (aka fuel economy). Globally, miles traveled per vehicle is thus broken down by region in our long-term oil demand model (chart below), averaging 8,600 miles per ICE per year. VMT also influences energy used in EVs.
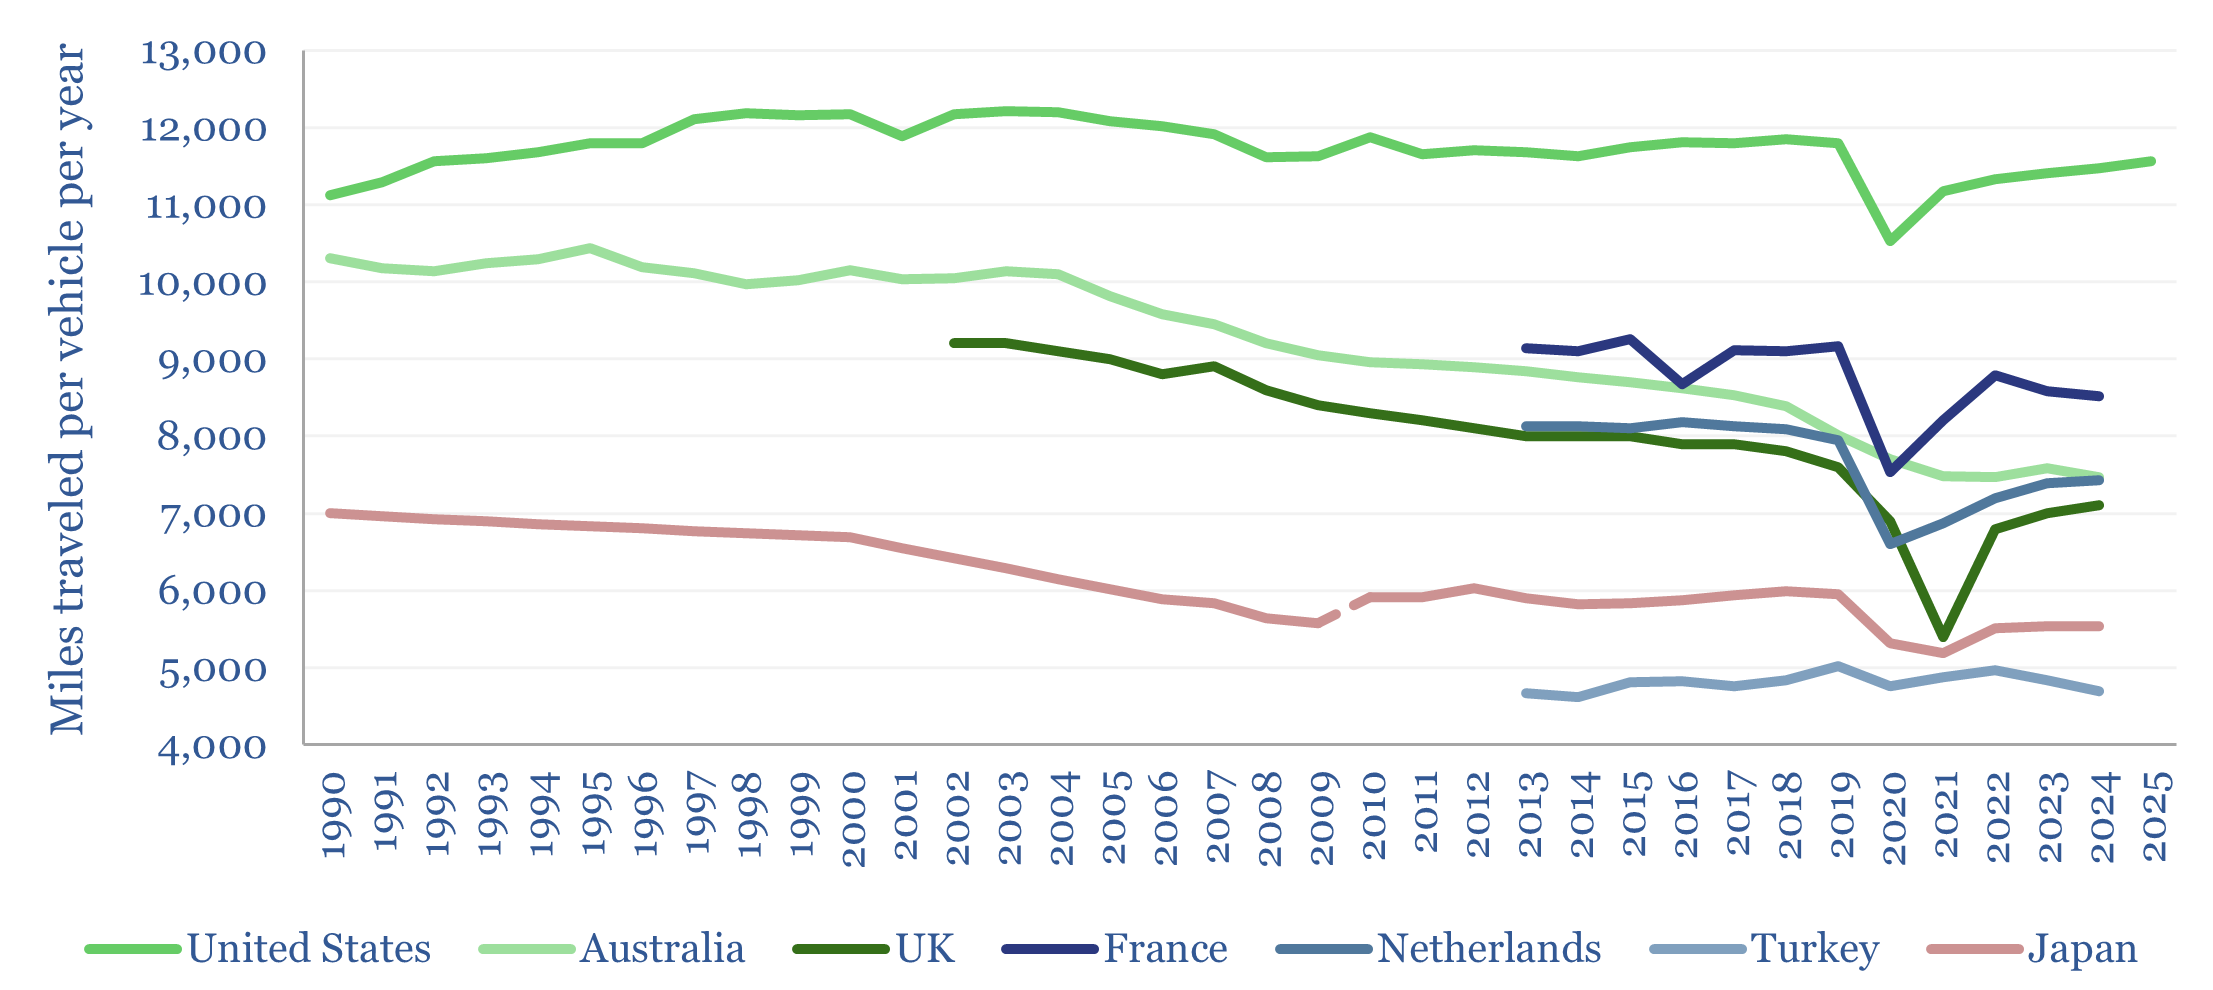
This data-file aggregates data from national statistical agencies, to track vehicle miles traveled in different regions. Miles driven per global vehicle fell by -0.7% per year from 1999 to 2019, but surprisingly, started rising again after 2022, on average.
Reasons for the historical decline in miles driven per vehicle include wealth effects (greater ownership of ‘second’ and ‘third’ vehicles), the rise of the emerging world consumer (passenger vehicles are usually driven only 10-20% as much as commercial vehicles), aging populations (elderly people tend to travel less), and the rise of the internet (tasks that used to require a physical trip can be done online).
One future angle that could increase miles traveled per vehicle is the rise of autonomous vehicles, which is being prioritized by OEMs, and could add 5Mbpd to global oil demand, by increasing the convenience of vehicle mobility.
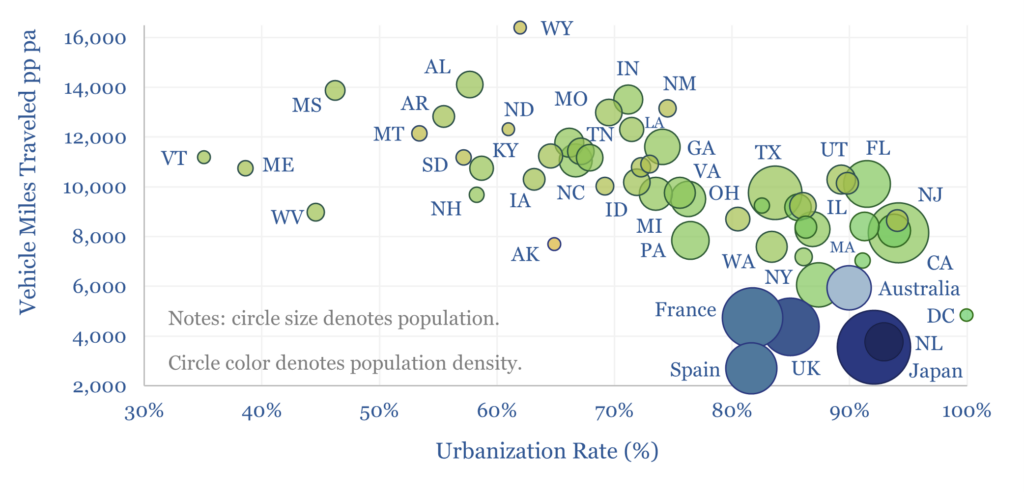
Another possibility is that autonomous vehicles and digital connectivity enable people to ‘move out’ of cities, which is statistically associated with 3-5x higher vehicle miles traveled (chart below).
The data-file also breaks down all miles travelled by individuals in the US and UK, according to 20 different categorizations on 20 distinct tabs: by purpose, by vehicle type, by journey distance, by age, by income category, and by urban location, using historical survey data.
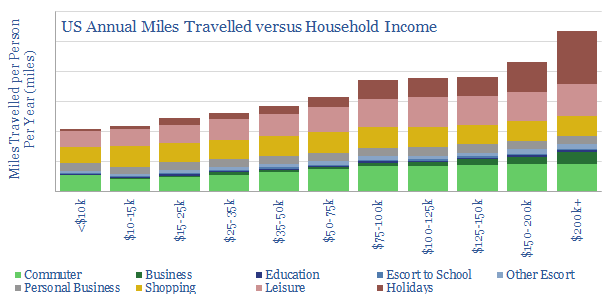
Some of the data are derived from the US National Household Travel Survey, which was last conducted in 2017, collecting a day’s data across 1M journeys from 250,000 individuals in the United States; and the UK Department of Transportation’s National Travel Surveys, which interviews and tabulates travel-diaries from 14,000 – 20,000 individuals each year since 2002.