Solar+battery co-deployments allow a large and volatile solar asset to produce a moderate-sized and non-volatile power output, during c40-50% of all the hours throughout a typical calendar year. This smooth output is easier to integrate with power grids, including with a smaller grid connection. The battery will realistically cycle 100-300 times per year, depending on its size.
The output from a standalone solar installation is notoriously volatile, varying +/- 5% every 5-minutes on average, plus sudden power spikes and drops, and achieving an annual utilization factor of just 20%.
But how does co-deploying solar+batteries lower the volatility? This data-file uses real-world data, from an Australian solar asset, measured at 5-minute intervals, and then applies simple rules about when to flow power into and out of the batteries, to maximize the delivery of 100MW, smooth, non-volatile power.
The solar+battery output also includes synthetic inertia and frequency regulation, which helps rather than hinders overall grid stability.
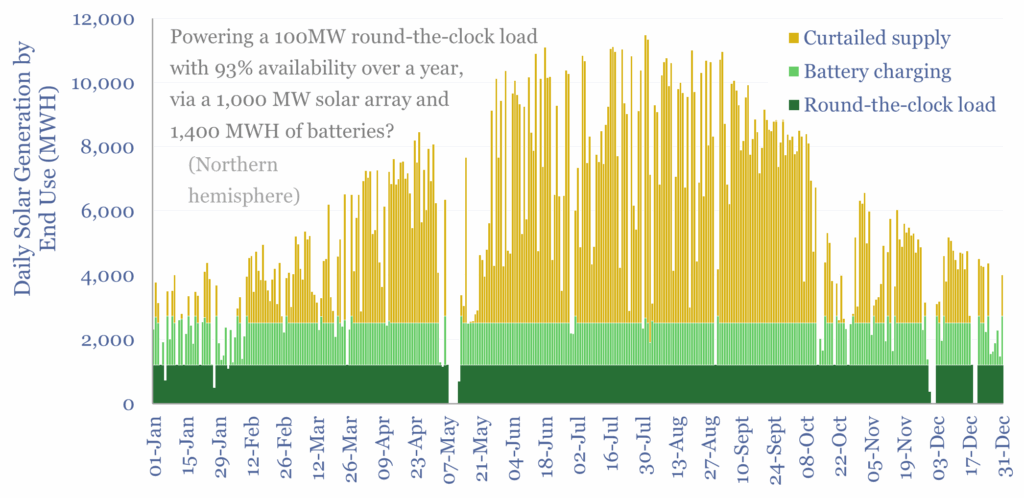
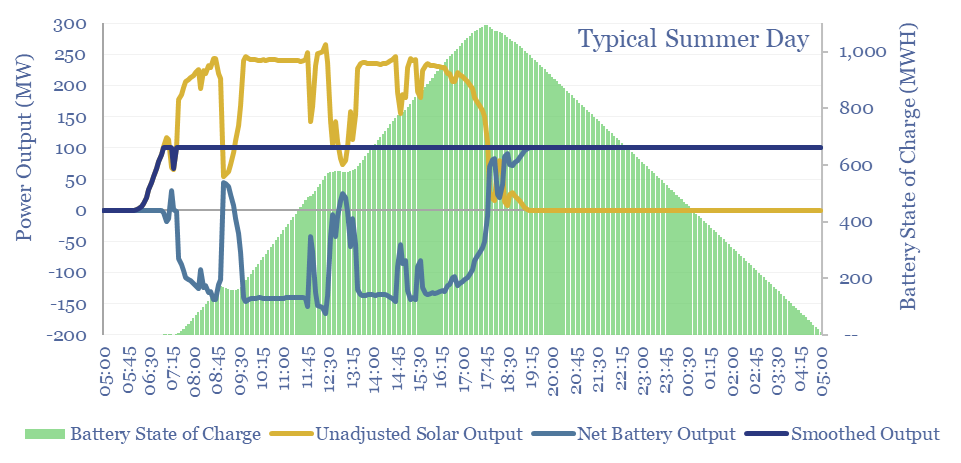
The title chart above shows how the output profile of our solar+battery system might behave on a summer’s day, with the net asset providing 100MW to the grid for 24-hours. Excess solar is shunted to the battery throughout the day. Then the battery is gradually discharged to zero after sunset. This model works well in the summer.
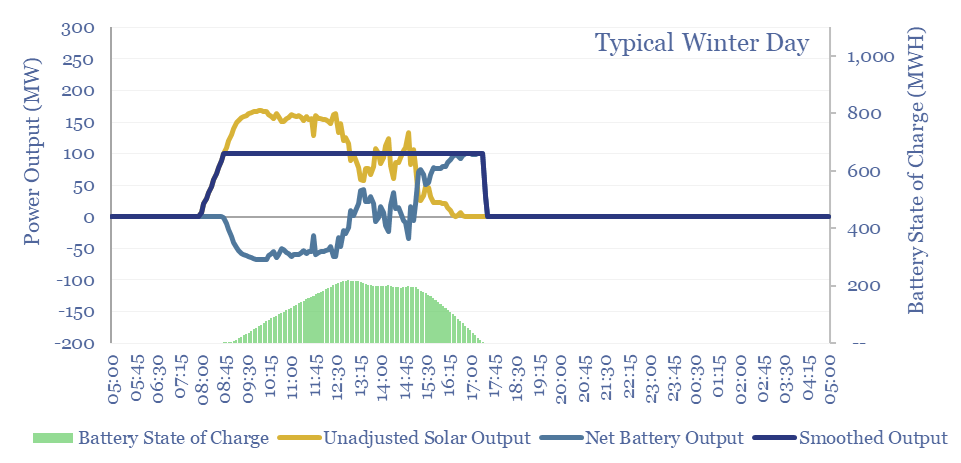
However solar generation is highly seasonal, and on a winter’s day, this exact same battery does help to keep output stable at 100MW, but it only achieves 20% of a full charge-discharge cycle, as there is simply not enough solar generation to fill the battery. The bigger the battery, the less likely it gets full in the summer, and the less utilized it is in the winter.
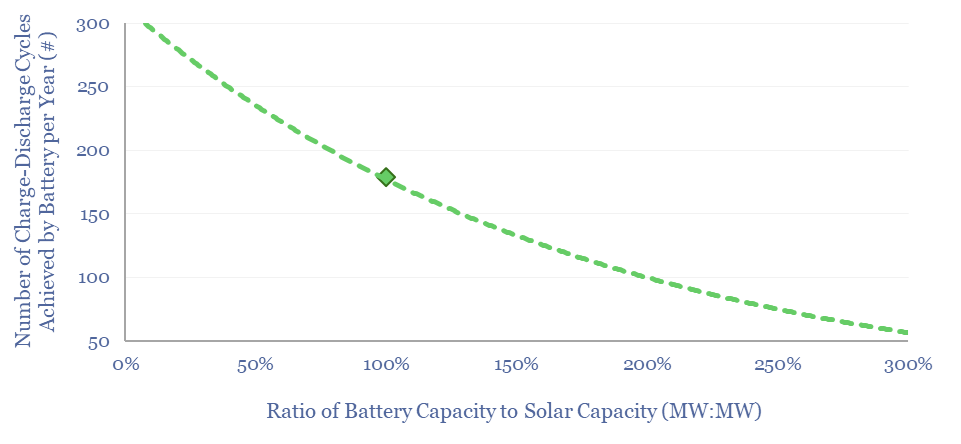
This can be stress-tested in the data-file. We can also calculate the number of charge-discharge cycles that different batteries achieve, if they are charged exclusively with solar generation. Some decision-makers assume daily charging-discharging when modeling the economics of batteries, but this is shown to be much too optimistic (below).
Overall, remarkably, the solar+battery co-deployment model means that a 275MW solar installation + a 275MW battery can dispatch 95% of its generated output through a mere 100MW grid connection. This is why co-deploying renewables+batteries can help to surmount power grid bottlenecks. And in turn, this is why we think battery co-deployment is accelerating.
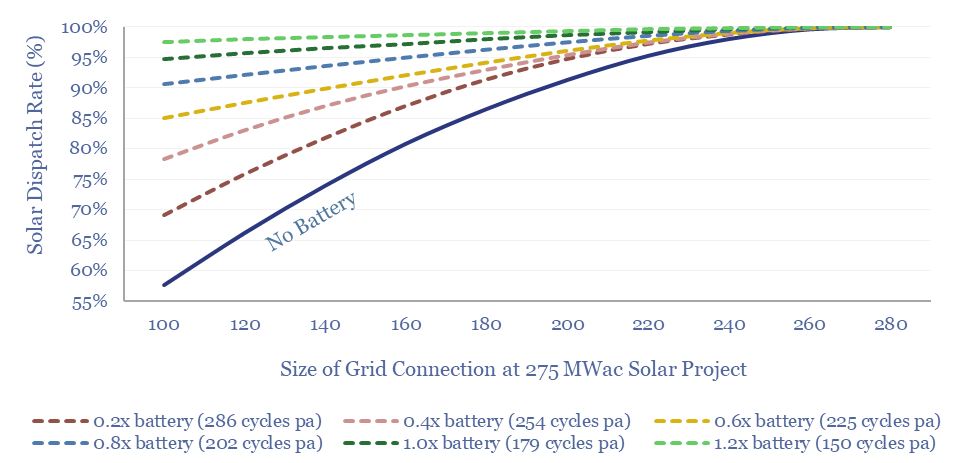
If a battery is run purely for solar smoothing, with 1MW of battery capacity per MW of solar, then the battery will tend to achieve 180 charge-discharge cycles throughout the year, and it will allow a 275MW solar asset to output precisely 100MW to the grid in c50% of the time throughout an entire year (but still producing no power about 40% of the time).
The production profiles vary month by month. The results vary with battery sizing and charging-discharging rules. These sizings and rules can be stress-tested in the data-file, to assess how different-sized batteries result in different dispatch rates and charge-discharge cycle counts.
In the Round-the-Clock tabs, we also run a calculator, which shows how solar, plus batteries, plus a “penalty” for unmet loads, can combine to give total system costs on round-the-clock power. These costs can be optimized, suggesting that c10MW of solar and 14 MWH of batteries, per MW of stable output, can provide 93-98% of round-the-clock loads at costs of 12-45c/kWh.