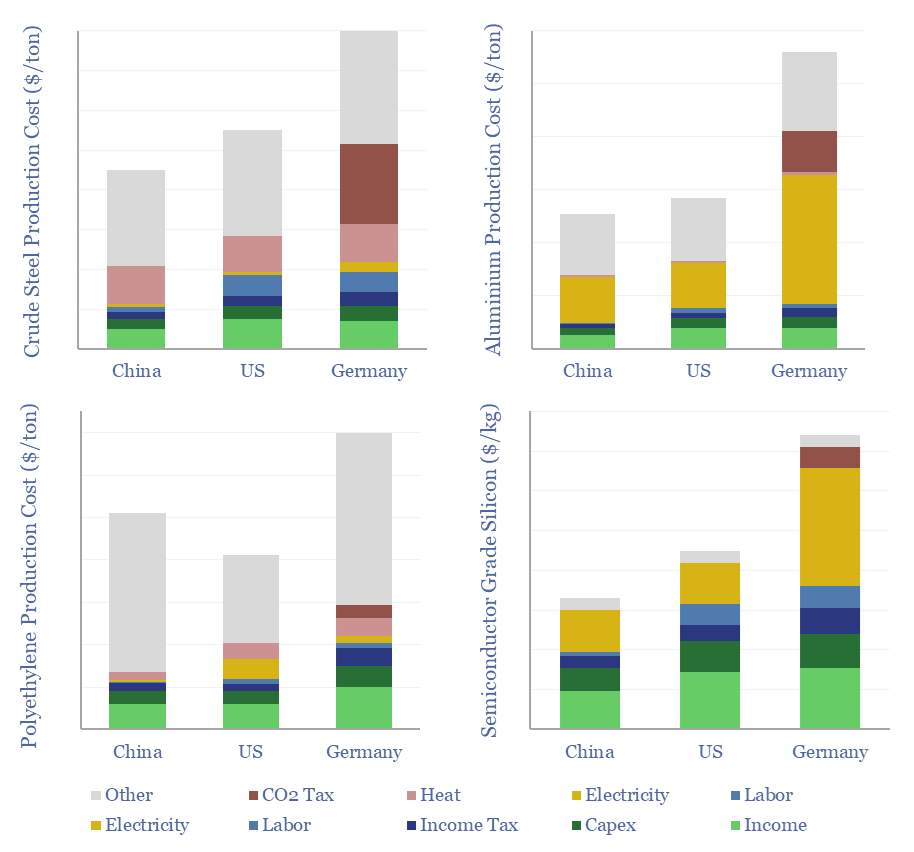
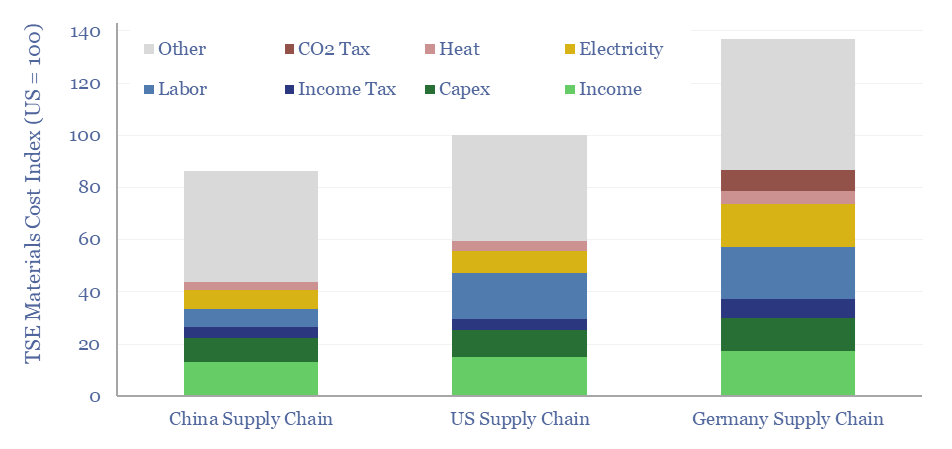
Material and manufacturing costs by region are compared in this data-file for China vs the US vs Europe. Generally, compared with the US, materials costs are 10% lower in China, and 40% higher in Germany, although it depends upon the specific value chain. A dozen different examples are contrasted in this data-file, especially for solar value chains.
To build up the numbers in this data-file, we have stress-tested a dozen of our economic models, using generalized assumptions to represent the US, China and Germany. This includes their energy costs, labor costs and tax regimes, including the EU’s carbon tax.
To make the analysis apples-to-apples, all costs are quoted on a full-cycle basis, with income covering a 10% cost of capital, and excluding subsidies. However, in some industries, China has been accused of selling product below full-cycle cost, helped via state support, to crowd out competition. This is not captured in our calculations.
Underlying materials costs are lowest in China, averaging -10% below the US, but ranging from -40% cheaper (e.g., for glass, silicon) to +30% dearer (contrasting China’s naphtha-cracker ethylene versus US ethane crackers). Lower costs almost all attribute to cheaper labor in China, where all-in employee costs are $15-20k pa versus $80-100k in the West. And manufacturing costs are likely 50-60% lower as well.

Materials costs are highest in Germany, averaging 40% above the US and 60% above China, as Europe’s industrial policy chickens have come home to roost. Every single line is higher in Europe. Costs are c10% higher due to industrial electricity prices (20c/kWh vs 6c/kWh), 10% is due to CO2 prices under the EU ETS (which have recently ranged from $60-100/ton), and 10% is due to higher supply-chain and logistics costs.
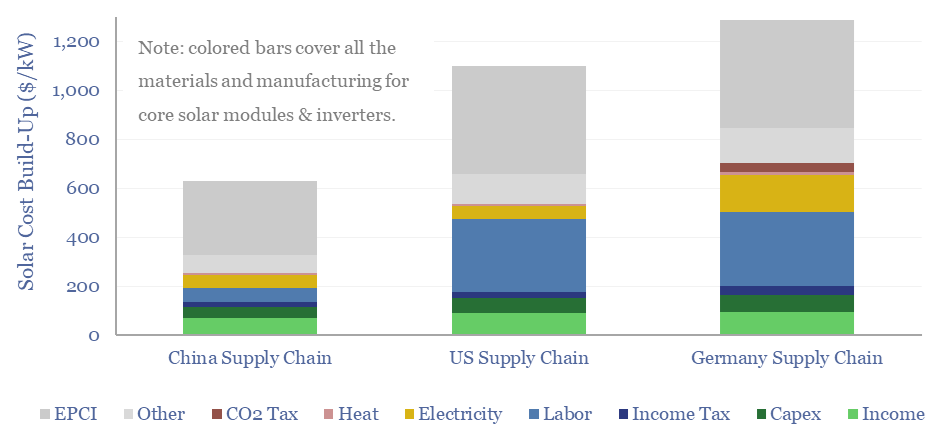
We can use our material cost indicators in this data-file to ask how much solar costs would re-inflate, if today’s China-dominated supply chain for modules and inverters were reshored to the West, or if trade with China were disrupted due to tariffs or geopolitical reasons.

Costs of recent solar projects are coming in at $600-700/kW in Europe and Asia, which reflects today’s China-dominated supply chain. Utility-scale solar costs in the US are higher, around $1,200/kW, as the US already has c50% tariffs on Chinese-made solar. So if the economic costs of re-shoring US solar supply chains is c$1,000/kW, tariffs persist, and the IRA offers a direct incentive of $40-70/kW+, then should we be seeing exciting momentum in the US domestic solar supply chain?
It turns out that ramping US solar supply chains is not without challenges. Already in 2025, REC Silicon has said it will shut its PV silicon plant in Moses Lake, Washington, as output was missing purity targets under its supply agreement with QCells. REC’s share price has now fallen 94% since its 2022 peak after the Inflation Reduction Act was signed. Meyer Burger (Swiss small-cap) also canceled plans for a 2GW module plant in Colorado in August-2024. And OCI/CubicPV canceled plans for a 10GW silicon wafer factory in February-2024.
The US solar supply chain includes First Solar (public thin-film solar company), Canadian Solar (building a 5 GW solar cell facility in Indiana) and QCells (developing a $2.5bn solar module plant in Georgia). Japan’s TOYO Solar also announced plans for a 2GW US facility in 2024. More details are in our screen of module makers.
Conversely, if Europe wished to re-shore solar supply chains, or could not for some reason import Chinese modules, this would approximately double European utility-scale solar costs, to $1,200/kW.
Similar cost differences were also found in our recent deep dive into battery value chains, especially for Chinese LFP versus Western LFP and NMC, or for wind turbine blades.
Deteriorating trade relations with China would be highly inflationary for Western renewables and electrification initiatives, and thus strangely bullish for other energy sources (eg LNG).
