Search results for: “demand”
-
Global oil demand forecasts: by end use, by product, by region?
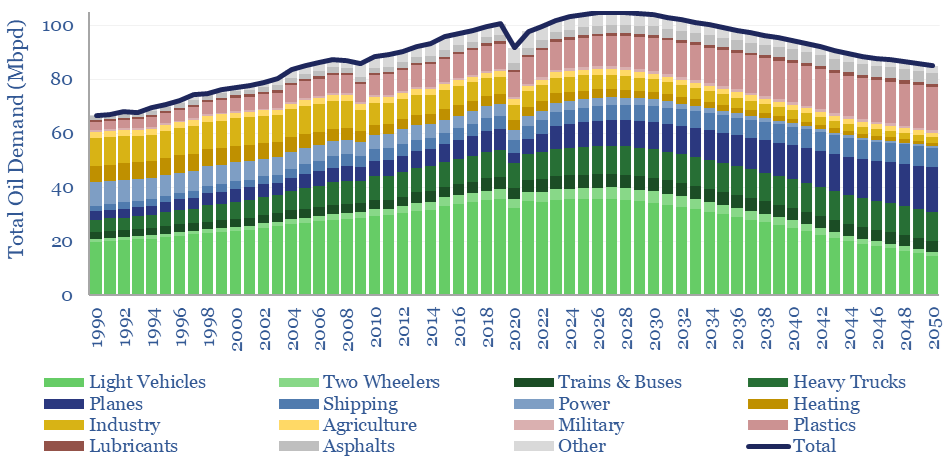
This model forecasts long-run oil demand to 2050, by end use, by year, and by region; across the US, the OECD and the non-OECD. We see demand gently rising through the 2020s, peaking at 105Mbpd in 2026-28, then gently falling to 85Mbpd by 2050 in the energy transition.
-
Global plastic demand: breakdown by product, region and use?
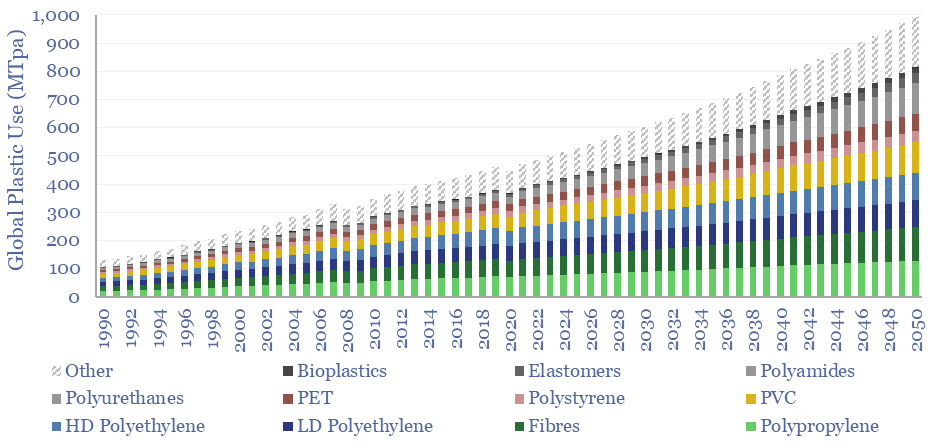
Global plastic is estimated at 470MTpa in 2022, rising to at least 800MTpa by 2050. This data-file is a breakdown of global plastic demand, by product, by region and by end use, with historical data back to 1990 and our forecasts out to 2050. Our top conclusions for plastic in the energy transition are summarized.
-
Jet fuel demand: by region and forecasts to 2050?
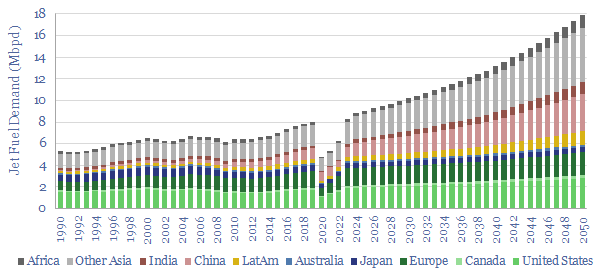
Jet fuel demand ran at 8Mbpd in 2019, the last year before COVID, and could rise to 18Mbpd by 2050, as global population rises 25%, jet fuel demand per capita doubles and fuel economy per aviation mile rises by 20%. This data file breaks down jet fuel demand by region, including our forecasts through 2050,…
-
Air conditioning: energy demand sensitivity?
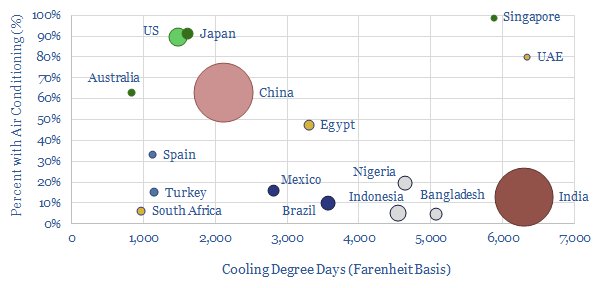
This data-file quantifies air conditioning energy demand. In the US each 100 variation in CDDs adds 26 TWH of electricity (0.6%) demand and 200bcf of gas (0.6%). Air conditioning already consumes 7% of all global electricity and could treble by 2050.
-
Global oil demand: breakdown by product by country?
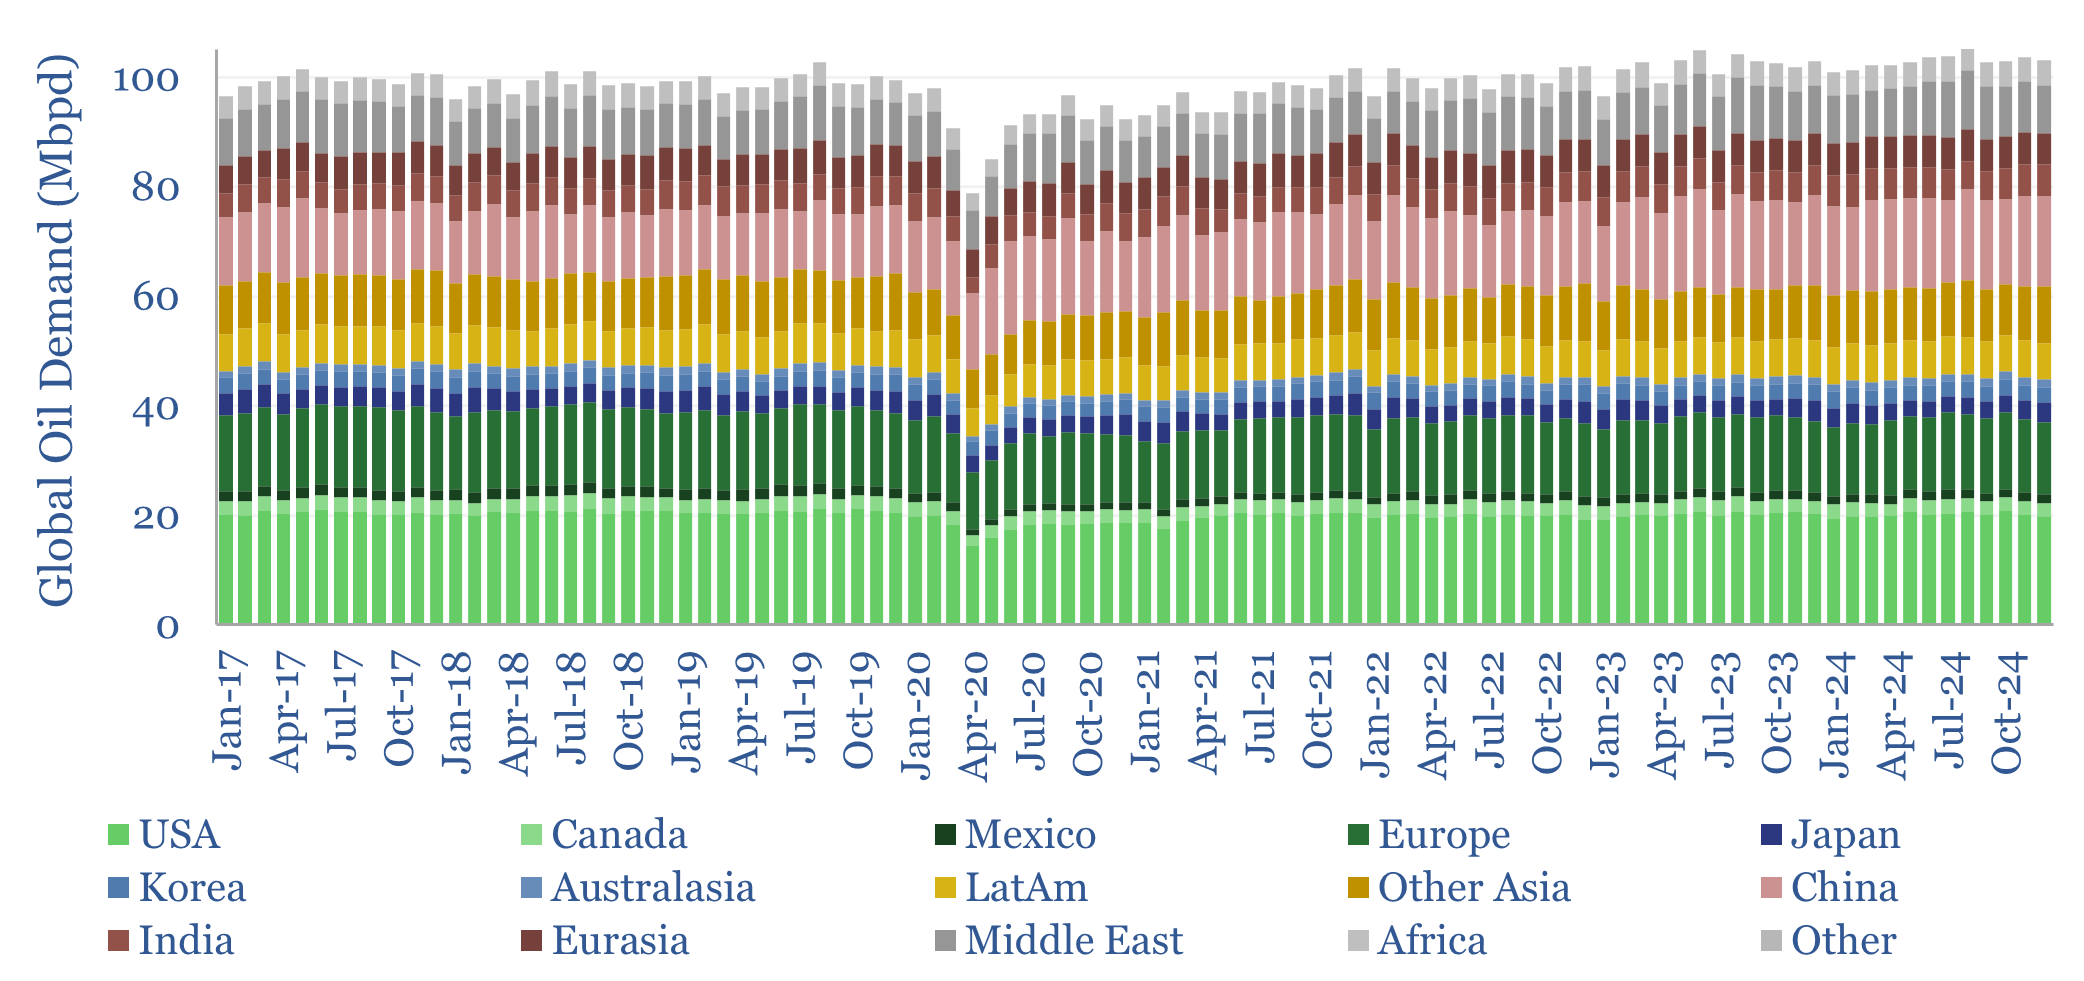
This data-file breaks down global oil demand, country-by-country, product-by-product, month-by-month, across 2017-2024. Global oil demand ran at 103 Mbpd in 2024, for +1.0 Mbpd of growth, according to our databases. For perspective, global oil demand rose at +1.2Mbpd per year in the 30-years from 1989->2019, so not much evidence, on face value, that “peak oil…
-
Peak power demand by region (and case studies)

This data-file tracks the timing and magnitude of peak power demand, across different grids in the North Hemisphere, with case studies. This matters for grid-planning, gas peakers and batteries. In the US, peak demand is typically driven by high AC loads in summer heatwaves. In Europe’s milder climate, only c10% of homes have AC, and…
-
Energy demand forecasts: making predictions about the future?
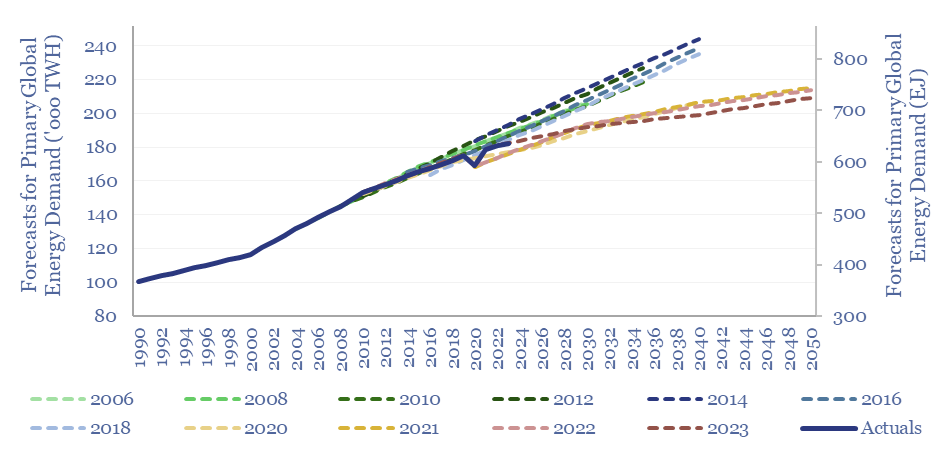
How accurate are energy demand forecasts? Long-term forecasts for total global energy demand can easily be wrong by +/- 10%. Oil market forecasts tend to be amiss by 0.6% x the number of years away. Oil and coal seem to have been consistently under-estimated since 2020. Solar and wind were consistently underestimated in 2010-20, but…
-
Demand shifting: electrical flexibility by industry?
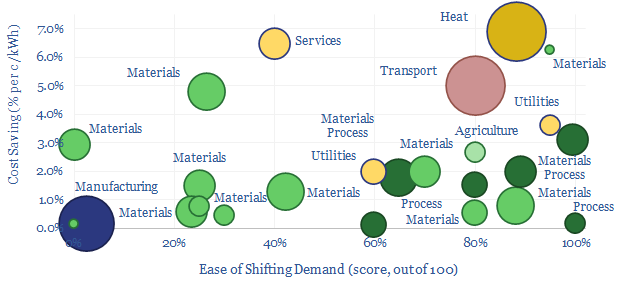
Demand shifting flexes electrical loads in a power grid, to smooth volatility and absorb more renewables. This database scores technical potential and economical potential of different electricity-consuming processes to shift demand, across materials, manufacturing, industrial heat, transportation, utilities, residential HVAC and commercial loads.
-
Global commodity demand: sensitivity to GDP?
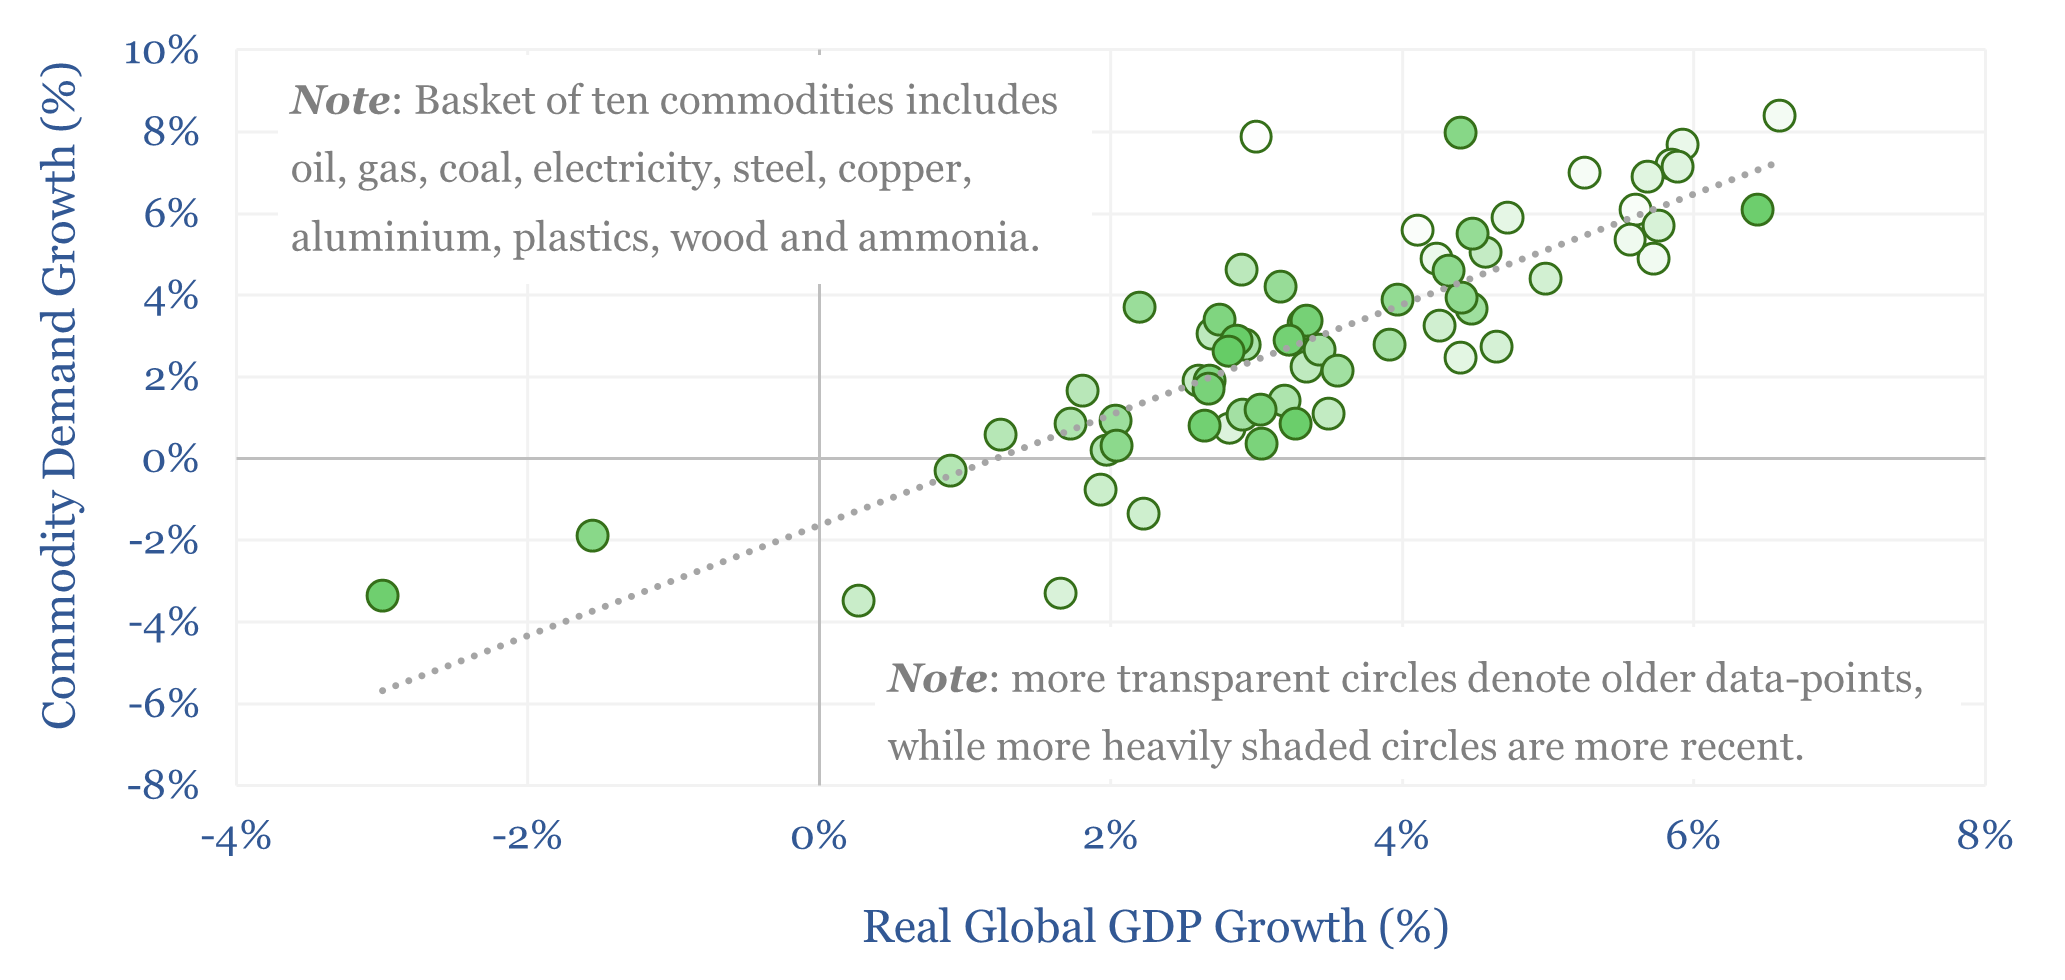
Global commodity demand is levered to GDP. Specifically, for each +/- 1% acceleration or deceleration in global GDP, commodity demand tends to accelerate or decelerate by +/- 1.4%, with a 70% R-squared, across 25 examples that are indexed in this data-file. Oil demand sensitivity to GDP is particularly interesting.
-
Australia energy supply-demand model?
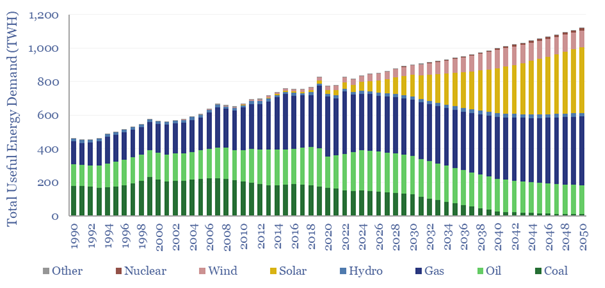
Australia’s useful energy consumption rises from 820TWH pa in 2023, by 1.2% pa 1,100 TWH pa in 2050. As a world-leader in renewables, it makes for an interesting case study. This Australia energy supply-demand model is disaggreated across 215 line items, broken down by source, by use, from 1990 to 2023, and with our forecasts…
Content by Category
- Batteries (89)
- Biofuels (44)
- Carbon Intensity (49)
- CCS (63)
- CO2 Removals (9)
- Coal (38)
- Company Diligence (95)
- Data Models (840)
- Decarbonization (160)
- Demand (110)
- Digital (60)
- Downstream (44)
- Economic Model (205)
- Energy Efficiency (75)
- Hydrogen (63)
- Industry Data (279)
- LNG (48)
- Materials (82)
- Metals (80)
- Midstream (43)
- Natural Gas (149)
- Nature (76)
- Nuclear (23)
- Oil (164)
- Patents (38)
- Plastics (44)
- Power Grids (130)
- Renewables (149)
- Screen (117)
- Semiconductors (32)
- Shale (51)
- Solar (68)
- Supply-Demand (45)
- Vehicles (90)
- Wind (44)
- Written Research (354)