Energy transition: distorted by politics?

is energy transition distorted by politics?

Political divisions may explain some recent mysteries around the energy transition, and be larger than we had previously imagined. This note explores lobbying data and concludes there is more need for objective and apolitical analysis.


To an apolitical researcher, focused mostly on data, numbers and objective analysis, there are some strange goings-on in the energy transition. Our review of the ‘top ten controversies’ is linked below. But let us zoom in on a few examples…

(1) A Republican President recently stated that climate change was a ‘hoax’ and could effectively be ignored. This is despite not having any clear expertise in Earth Science or climatology himself. Conversely, our own climate models and conclusions are below.

(2) A Democrat President recently has been seen to discourage US oil and gas production in the name of averting climate change, but then later called on OPEC to raise output. This is despite many OPEC countries – Iraq, Nigeria, Venezuela – having much higher levels of flaring, methane leaks and CO2 emissions than US producers (data below).

(3) Another of the leading US Academic institutions recently announced it would divest its endowment from oil and gas. This is despite suggestions that divestment might, again, hand market share to higher CO2 producers, while also depriving China of new LNG supplies, thereby perpetuating its reliance on 2-3x more CO2 intensive coal.

(4) 100% renewable electricity is often promoted by policymakers and even claimed by some tech companies (note here). This is despite nobody having a practical or economical solution to satisfy demand in the 30-70% of the times when wind and solar hardly generate any electricity at all, or other complications with the power grid (below).

(5) Restoring degraded natural ecosystems can absorb around 200-400 tons of incremental CO2 per acre at costs of around $15-50/ton. This should be an enormous win for the environmental movement, especially with more experience (notes below). Yet many policymakers have so far disavowed nature-based solutions in favor of other CO2 abatement options costing $300-1,000/ton and that do not restore nature.

The mysteries above are unsettling to me as a researcher. I have spent an inordinate amount of time wondering ‘what am I missing?’ and poring back over my numbers.

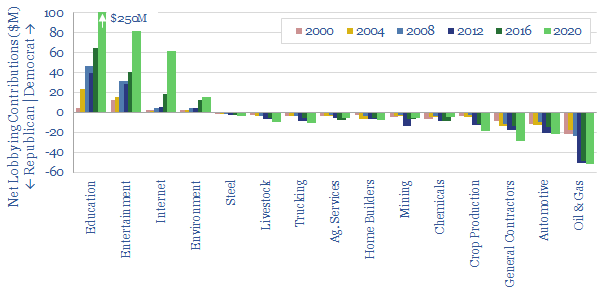
But these apparent paradoxes may also be explained by political divisions. Our chart below aggregates data from opensecrets.org, showing several billions of dollars spent on lobbying by fifteen major industries in the past 20-years. Conspiracy theories are not usually helpful. But there are clear conflicts of interests in these numbers.

Political polarization? Some members of the oil and gas industry appear to be consistently among the largest contributors to Republican candidates and causes, followed by some members of other energy-intensive industries. Conversely, some members of the education, entertainment and tech industries are consistently the largest contributors to Democrat candidates and causes. And to state the obvious, Democrats tend to be pro-Democrat causes and anti-Republican causes; and vice versa.

Everyone is entitled to a political opinion. However, is there not the smallest temptation for those with strong political leanings to promote the interests of others with similar political learnings; and equally, to weaken the interests of those with opposite political leanings? How do we know that politics are not ‘distorting’ energy transition policies? Five conclusions follow below…
(1) Some statements are merely political posturing? If you cannot find a good facts-based, numbers-based justification for strange goings-on in the energy transition, it is possible that they could be politically driven. In some cases, you may simply translate “I support this technology” or “I strongly object to this technology” as “I am hereby expressing my political position”. That is fine. People are entitled to political positions. But it may be helpful for decision-makers to differentiate between objective facts and political opinions. We think transparent data and numbers are the best way to do this.

(2) Politicizing the energy transition may make it harder to achieve important environmental goals. By definition, the solution space that satisfies a complex array of lobbying interests is going to be smaller than the overall solution space. It may involve selecting non-optimal solutions. There is also a risk of yo-yo policies, as each fresh administration reverses course from the last. Therefore an important goal for decision-makers, is to identify opportunities that will ‘stick’, regardless of the political climate, and differentiate them from temporary fads that are politically motivated. Our work aims to do this.

(3) If you want to make a difference, driving the energy transition, the best solution may be to steer clear of politics, and simply get on with ‘doing’ something constructive. You are not going to change other peoples’ political views. Get on with your life. As a personal example, I am currently speccing out my own reforestation project, which should offset my family’s entire lifetime CO2 emissions (note below). Per our research, there are some amazing companies ‘doing’ amazing things across the energy transition, and some amazing opportunities as a consequence…

(4) Is all research objective? What is most surprising about our lobbying chart above is the very large political skew of US Academia, especially in the last electoral cycle. How does an institution that gives $2.5 – 25M to a particular political party (data here) ensure that it is conducting apolitical research, balanced peer-reviews and considering all angles? Everyone is entitled to political opinions. But we aspire that science should be apolitical and objective. Moreover, some of the output from widely-reputed, inter-governmental organizations has also recently contained some surprising conclusions, which smell of the political cart leading the numerical horse.

(5) The best antidote, we believe, is objective, numbers-based analysis. Which is the goal in TSE’s research. It is independent and apolitical. The sole focus is to find practical and economic opportunities for decision-makers, which can help the world decarbonize. To keep a balance, each of our 170 clients pays the same subscription fee to access our research. Our conflicts of interests policy is linked here. And most importantly, all of our data and models are published transparently on our website. If you ever disagree with the number in a particular cell in a particular spreadsheet, then please write in, and we should debate it.

Diet and climate: should energy transition include agriculture?

diet changes could cut total CO2 footprint

Feeding the world explains 20% of global CO2e, across 12bn acres of land, whose reforestation could theoretically decarbonize the entire planet. Kilo for kilo, many meat products have 1-10x more embedded CO2 emissions than fossil fuels. Thus with dietary changes a typical developed world inhabitant could cut their total CO2 footprint by 50-70%. The purpose of this short article is to present our top ten facts and observations.


(1) Food is a form of energy. The average person needs to ingest around 2,000 calories (kcal) per day to maintain their weight. The energy content of 2,000 calories is equivalent to 2.3 kWh. In power terms, this is c100W, or a similar electrical draw as a desktop computer. Hence nourishing 8bn people globally is equivalent to supplying 7,000 TWH per annum of energy, or c10% of all global energy. For comparison, the useful energy harnessed from 40Mbpd of oil by the world’s fleet of 1.7bn passenger vehicles is around 5,000 TWH per annum. Energy demand per capita and across different household appliance are captured in our data-files below, to enable further comparisons. But how efficiently do we supply this food energy onto our plates?

(2) Crop yields can be very high per acre. The average yield for an acre of corn in the US is 175 bushels (explored in detail in our biofuels research below). 1 bushel of corn contains 88k kcal of food energy. Hence 1 acre of corn yields 15M calories per year of energy and could theoretically nourish 20 people (although they would get very sick of eating corn). Numbers can be similar for potatoes. Calorific yields fall to c11-13M calories/acre for rice, 4-6M for wheat, 2-6M for soybeans.

(3) Animal agriculture has >85% lower yields per overall acre. Producing 1 calorie of eggs or dairy products requires feeding 6 calories to chickens and cows. While producing 1 calorie of poultry, pork or beef, respectively, requires feeding 9, 12 or 37 calories to chickens, pigs or cows. Even further land is needed to rear these animals too.

(4) Macro land use. Animal agriculture therefore takes up c80% of all agricultural land to produce c20% of the calories. Specifically, the Earth contains 37bn acres of land. Of this 37bn acres, 12bn acres are barren (deserts and Antarctic wilderness) and 25bn acres can support life. Of this 25bn acres, 10bn acres remain as forests. 8bn acres are used to graze animals, and 4bn acres are used to raise crops. Of these crops, c55% are fed to humans, c35% are fed to animals and c10% are used for biofuels. These data are drawn from our research below.

(5) Micro land use. It takes 2.5 acres of land to support the average UK person’s diet, consuming 75g per day of protein, which is 50% above the recommended daily intake, and c40% derived from meat and meat products. The US average land requirement has been estimated between 2.6 – 3.3 acres, as the average American eats 200lbs of meat per annum, 3x the global average. By contrast, the average Chinese and Indian diets currently require 1.7 acres and 0.8 acres of land. Finally, to re-iterate, the minimum possible land footprint to sustain a human being today is around 0.05 acres.

(6) Agricultural land has a climate cost. 5bn acres have been deforested by mankind, releasing one-third of all anthropogenic CO2-equivalents. Forest cover in different countries with Western diets is as low as c10%, across the UK, Netherlands, Ireland, Denmark; and generally around c30% in countries such as the US, Germany, France, Italy and Central Europe more broadly. We have cleared 50-70% of our forests in these European countries, over the past several centuries. The world is still shedding 25M acres per year of forest land globally, of which 75% is driven by animal agriculture, and half may be for rearing beef. Thus deforestation remains the largest source of anthropogenic CO2 emissions on the planet (chart below).

(7) Agricultural land also has an opportunity cost. Reforesting 1 acre of land would be likely to absorb around 5 tons of CO2 per acre per year (below). This is equivalent to 25-35% of the average CO2-equivalent emissions of the average Western citizen. A purely vegetarian diet that requires <0.5 acres of land per year may free up an area large enough to absorb 10 tons of CO2 per year, around 50-70% of the average Western CO2 footprint. To be clear, our existing thesis – on the amazing climate potential of large-scale reforestation – does not require vast numbers of people to give up eating meat. But it would help.

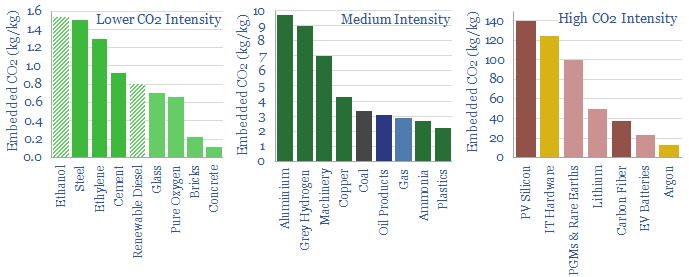
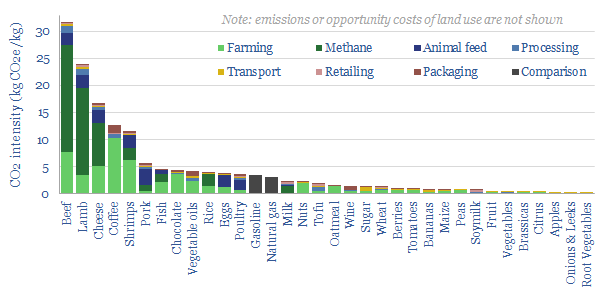
(8) Direct emissions add on top. Methane is responsible for another 25-30% of all anthropogenic warming that is currently occurring on the planet. c40% of mankind’s methane emissions have come from the fossil fuel industry, where vast efforts are needed and underway to reduce leaks (note here). But a similar, c40% of anthropogenic methane has come from agriculture, mainly from methanogenic bacteria, which digest coarse plant material in the fore-stomachs of ruminant animals. 1kg of beef releases 15-50kg of CO2-equivalent methane emissions, as the average cow burps up c100kg of methane per year. Kilo for kilo, this means that 1kg of hamburger is one of the most CO2 intensive materials on the planet, an order of magnitude more than steel or cement (1-2 kg of CO2 per kg of material, chart below). Even further, on top of this, producing different crops will typically require 0.4-2 kg/kg of CO2 emissions, in fertilizers and running agricultural equipment; and 6-40 kg of crop feed is needed to produce 1 kg of meat. Thus ‘what you choose to eat’ has vast CO2 consequences, and certainly much more than ‘where it comes from’ or ‘what form of packaging’ it is sold in (charts below).

(9) Weird subsidies abound. One of the strangest site visits I ever did in my time as an analyst took me to a 4MTpa frac sand mine in Texas. There were a couple of cows standing around on the property. And the manager explained that these cows enabled the facility to claim a legitimate tax exemption available to cattle ranches. In Florida, a similar tax loophole allegedly induces Disneyland to keep cows. Some studies have estimated that the US spends a total of $38bn per annum subsidizing the meat and dairy industries (direct and indirect costs). Meanwhile, the EU has been said to pay €2bn per annum to support livestock farming (direct costs only), providing half of all ‘value add’ in the livestock industry. It makes you wonder whether current climate policies have anything to do with climate at all. For the future, it will be interesting and controversial to see whether emissions taxes will cover agricultural products. If the IEA’s proposal for a $250/ton CO2 tax by 2050 was adopted in the developed world, this would logically be expected to add around $1.65 to the cost of the c$1 quarter-pounder in a typical c$3 fast food hamburger.

(10) An environmentally friendly diet has recently been called the single biggest opportunity for any individual to reduce their CO2-equivalent impact on the planet by a research team at the University of Oxford. Direct CO2 intensities are lowest for root vegetables, nuts, and fruits and vegetables more broadly, which should all have CO2e emissions below 0.5 kg/kg. In addition, this type of annoyingly virtuous vegetarian lifestyle may free up enough land that, if reforested, could realistically offset c50-70% of the CO2 emissions of a typical Western lifestyle. A further practical step would be to minimize food waste, which claims one-third of all food produced globally. Energy efficiency of different cooking techniques is discussed here. Finally, we have recently profiled vertical indoor greenhouses, which may make sense in grids with overbuilt renewables, and certainly a lot more sense than hydrogen (note below).

After-word. The data used in the header image of this report are from an excellent and free resource provided by Our World in Data (Source: Hannah Ritchie and Max Roser (2020) – “Environmental impacts of food production”. Published online at OurWorldInData.org. Retrieved from: ‘https://ourworldindata.org/environmental-impacts-of-food’). Some of these numbers are possibly on the high side, relative to our own numbers. But if they are correct, they imply that consuming 1kg of meat products emits 1 – 10x more CO2 than 1 kg of fossil fuels such as gasoline or natural gas.

Phasing out gas: five hidden consequences?

consequences of phasing out gas

Phasing out gas is likely to be a policy choice made by some cities or States, as part of the energy transition. The purpose of this note is simply to examine possible consequences. Which could be stark. Somewhere after c75% of customers have been shed, costs balloon by 70-170% for remaining customers, methane leaks worsen, local gas distributors suddenly go bankrupt, and governments must step in to ensure safe decommissioning and reliable backups. Taxpayers foot the bill.

A baseline: how do gas utilities work?

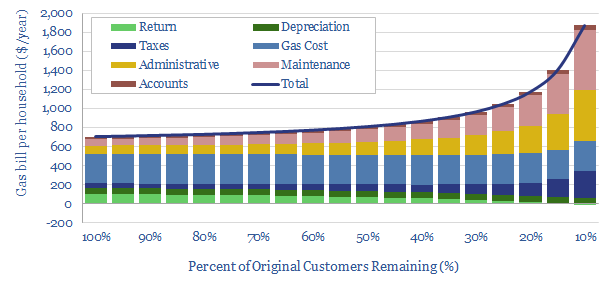
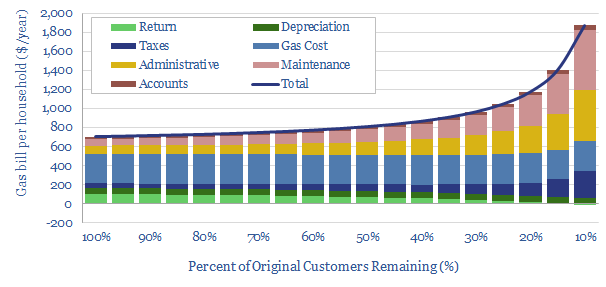
As a starting point, the typical, small municipal gas network might serve a few thousand to a few tens of thousands of customers, charging around $700 per household per year (60mcf pa at $12/mcf) (note below), and more for larger consumers, such as industrial/commercial consumers (data also below).

Network effects mean that costs are a function of the customer count. Furthermore, costs will rise if the number of customers falls. For example, a recent technical paper has evaluated 250 shrinking utilities in the United States, over several years, concluding that customer losses tend to yield 0.5-to-one revenue declines (Davis, L, & Hausman, C. (2021). Who Will Pay for Legacy Utility Costs? Energy Institute WP 317).

In other words, $1 of lost revenue typically results in $0.5 of additional revenue being raised from remaining customers. The idealized maths of this process are captured below…


Specifically, we estimate that if a gas network falls to c20% of its original size, the remaining customers would be likely to pay 70% more (rising from $700 pa to $1,200 pa) while the gas utility’s ability to earn a profit has effectively been wiped out. The balance could be different in practice. But let us explore the consequences of this scenario…

Five hidden consequences of phasing out gas

(1) Tipping points? The more customers leave a gas network, the faster costs start rising for remaining customers. In turn, this might accelerate the rate at which new customers leave the network. So the shift away from incumbent gas networks could start slowly, then accelerate, then happen particularly quickly. This suggests governments wishing to phase out gas may need a good plan up-front, before this sudden acceleration sets in.

(2) Huge costs for those who cannot switch? If the ultimate size of a gas network falls by 80%, the cost per customer rises 70%. If the size falls 90% then costs per customer rise 170%. If there were some customers who could not switch away from gas (e.g., insufficient capital/credit to make the upgrade), then they would be saddled with very high energy costs. Those most impacted are likely to be those with the least financial resilience. Again, this means governments may need to step in and come to the rescue in some way.

(3) Maintenance costs of the gas networks hardly decrease just because customers are moving away. The pipes are still in the ground. But fewer customers dents the profitability of gas distributors. Hence there may be a temptation to cut back on maintenance spending, or some other financial difficulty for maintaining existing as networks properly. In turn, this could have negative environmental consequences, worsening methane leaks, which already tend to be higher at smaller and more cash-strapped gas utilities (note and data-file below).

(4) Bankrupted distributors? Once c75% of the customers have left a gas network, it will become very difficult for these gas distributors to remain profitable at all, according to our analysis. Thus they may shut down entirely, yielding ‘stranded assets’ and the bankruptcy of thousands of small firms (charted in the data-file above). Critics of the fossil fuel industry often jeer at stranded assets, as though it is some kind of milestone of progress to be celebrated. The reality is that governments would need to step in, take over control of these gas networks, and then pay to have them safely decommissioned. Using taxpayer money.

(5) What alternatives? The old adage for a century has been that a mixture of gas and electricity offers a helpful lifeline in the depths of winter. Gas pipelines tend to be trenched underground. Hence if a vicious winter snowstorm comes through and knocks out the overhead power lines, Mrs Miggins is going to have some kind of alternative heating source and is not going to freeze to death in her home. Again, one of our main question marks over renewable-heavy power grids is whether they will have sufficient resiliency in extreme conditions (note below, looking at hot conditions, but a similar logic applies in the cold).

Conclusions: are there better options?

Our own personal view is that some governments may not be prepared to shoulder the consequences noted above. Nor do they need to. Well functioning gas heating can be perfectly compatible with decarbonization goals in the energy transition, if the gas is used efficiently, without methane leaks, and the residual CO2 is offset or decarbonized at source. This may be superior to ‘phasing out gas’ and dealing with the issues noted above.

Our research below explores a selection of these different themes…

Reforestation: a real-life roadmap?

Roadmap to reforestation

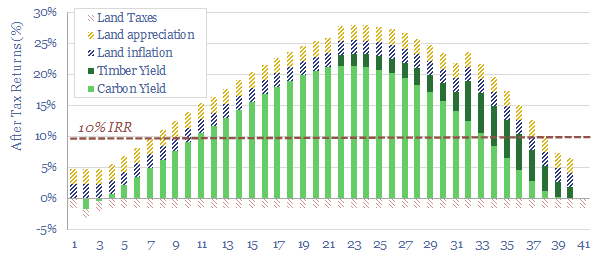
This 12-page note sets out an early-stage ambition for Thunder Said Energy to reforest former farmland in Estonia, producing high-quality CO2 credits in a biodiverse forest. The primary purpose would be to stress-test nature-based carbon removals in our roadmap to reforestation and net zero, and understand the bottlenecks. IRRs can also surpass 10% at $35-50/ton CO2.


The correct way to structure a reforestation project is one of the most important questions in the energy transition, but few seem to have cracked the code. This is our conclusion from hundreds of models and discussions, which are summarized on pages 2-4.

Our own interests in undertaking a reforestation project are set out on 5-8, combining personal circumstances, economics and an aspiration to understand the roadmap to reforestation and process in more detail.

What will a high-quality project need to look like? Our expectations and goals are set out on pages 9-12. As transparently as possible. This is a structured list of questions, and our initial hypotheses, to be addressed in future research.

Carbon markets: a thought experiment?

Carbon Markets

The short video below is a thinly-veiled critique of carbon markets, their ridiculousness and the lobbying that seems to be taking place against nature based solutions. To do this, use an analogy from the banking sector, followed by some observations on carbon markets, carbon prices and carbon offsets.

The analogy is that if bank debt were like carbon markets, you would never be allowed to re-pay the debt; you would simply be forced to borrow less money every year under a cap-and-trade system, following a byzantine set of rules; until eventually you gave up and went to do business with a different bank.

Conversely, if carbon markets worked like the modern banking industry, using nature based solutions to re-pay the ‘debts’ of carbon emissions, then the world could likely find a genuine, low-cost and verifiable route towards net zero.

Referenced in the video are our latest views on inflation-risks due to energy transition policies, the world-changing potential of nature based carbon offsets, a re-thinking of carbon prices, and hopes for better carbon labelling. Please see below for further details of each one.

Blockchain: why so energy intensive?

energy costs for Blockchain

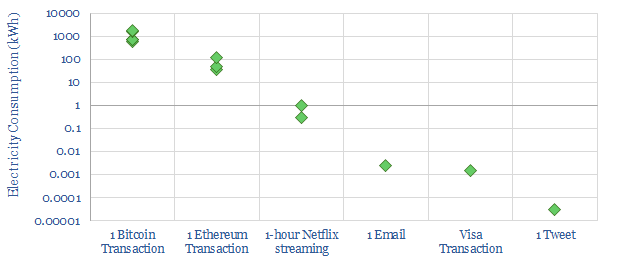
A single Bitcoin transaction currently uses c1,000kWh of electricity, which is 1 million times more than a traditional payment. Hence this 8-page note aims to explain how blockchain works, why it has been so energy intensive in the past, and how the energy multiplier could be reduced to maybe 100 – 1,000 x in a best case future scenario. Thus there could be a role for blockchain in some use cases in the energy transition.

Moore’s law: causes and new energies conclusions?

Moore’s Law for renewables

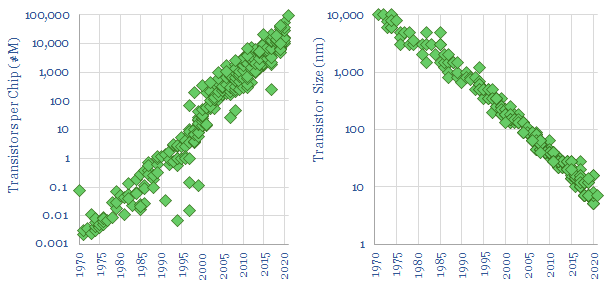
Moore’s law entails that computing performance will double every 18-months. It was proposed in 1965. And since then, chips have consistently sustained this pace. We argue such exponential progress has been driven by three positive feedback loops. Can these same feedback loops unlock a similar trajectory for new energies costs? We find mixed evidence in this short, six-page note.


Pages 2-3 explain Moore’s Law for renewables: why it matters for the new energies industry, and why sustained, exponential improvements must hinge upon positive feedback loops.

The first feedback loop is down to the laws of physics, unique to the semiconductor industry, as explained on page 4. It is hard to see how new energy technologies benefit from the same physics.

The second feedback loop is from boot-strapping, as better chips give better computers, which in turn have designed better chips, as outlined on page 5. New energies seem to be doing the opposite of boot-strapping.

The third feedback loop is from learning curves, noted on page 6, which we do expect to occur in new energies. But we must assess each learning-curve case-by-case.

To read more about Moore’s law for renewables, and our top conclusions, please see the article sent out to our distribution list.

Energy transition: conclusions from 6-months on the road?

top five conclusions on the energy transition

The video below contains my top five conclusions on the energy transition, from some eye-opening real world experiences. Specifically, for the better part of the past six months, my wife and I have been working ‘nomadically’, moving to a new location week-after-week. I made it to 44 US States in total, before returning permanently to Europe.

I hope the experiences will make me a better analyst, including some new ideas on energy transition economics, infrastructure, mobility, nature-based solutions and geographic variability…

Below is some actual footage of the trip, illustrating some of those surprisingly tree-filled landscapes in the middle of the country…

Also, as mentioned in the video, here is that Tesla towing a diesel-generator…

A few research reports are also referenced in the video too. Here they are below, on the importance of cost to the transition, the ability to reforest agricultural acreage, and the relative CO2 costs of mobility.. .

Finally, in case your curiosity has been piqued, here is my wife’s take on our US adventures, and our permanent re-location to Estonia, the ‘most digital country in the world’… link here.

CO2 prices: re-thinking the costs?

CO2 prices vs CO2 abatement costs

CO2 prices and CO2 abatement costs are very different numbers. CO2 prices are incurred by emitters. But abatement costs depend on how much CO2 is reduced. These abatement costs can actually be astronomical if CO2 does not fall by very much. Hence we argue CO2 prices are only effective if nature-based offsets are incorporated.


Economy-wide CO2 prices have been suggested as an effective policy tool to drive decarbonization. For example, our research has shown that a CO2 price could create a level playing to allow a broad range of energy technologies to decarbonize the entire US economy. (note below).

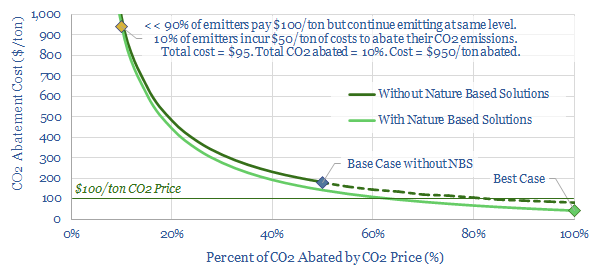
But something is missing from this analysis: what is the relationship between CO2 prices and CO2 abatement costs? The chart below aims to answer this question.

Short-run abatement costs from a CO2 price are astronomically high. To see this, consider the yellow dot in the chart above. Let us assume that a $100/ton CO2 price is imposed on all emitters in an economy. As a result, 10% of those emitters spend c$50/ton to eliminate their CO2 (total cost = $5 per ton of total ex-ante emissions). However, the remaining 90% of emitters continue emitting as before, and simply bear the costs of the $100/ton CO2 price, or pass it on to their customers (total cost = $90 per ton of total ex-ante emissions). Now, to calculate the CO2 abatement cost, we must add these costs together ($90 + $5 = $95/ton of ex-ante emissions) and then we must divide this total by the percent of CO2 that has been abated (10%). The result is a $950/ton abatement cost.

Can this be right? It might seem like a paradox, that the CO2 abatement cost associated with a $100/ton CO2 price could be $950/ton. The reason is that CO2 prices and CO2 abatement costs are very different things. As shown on the chart above, the CO2 abatement cost depends on how much CO2 is actually abated. If a CO2 price is imposed, and no one actually abates their CO2, then you have simply imposed a consumption tax.

Is this risk realistic? Different studies show that the price-elasticity of energy demand is relatively low. One good meta-study finds an average price-elasticity of 13% (here). In other words, a 100% increase in energy prices would likely only reduce energy demand by 13%. Using our data-file below, we estimate that a $100/ton CO2 price, if imposed overnight, would increase retail energy prices by around 35%, which in turn would most likely reduce energy demand (and with it CO2) by around 5%. So if anything, our suggestion of a $950/ton CO2 abatement cost from a $100/ton CO2 price is 2x too low.

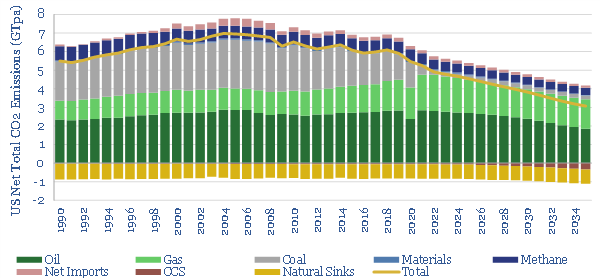
The objective of a CO2 price, however, is to incentivize deep changes across an economy, in order to reduce emissions. We studied one such scenario for the US last year (link here). This work found that by 2035, a CO2 price gradually rising to above $100/ton could eliminate around half of all US CO2 emissions (chart below). Here, the CO2 abatement cost comes out at c$180/ton. 50% of emitters continue emitting, and pay $100/ton of CO2 prices ($50). The other 50% of emitters incur an average of $80/ton of CO2 abatement costs to eliminate their CO2 ($40). The total cost is $90. This translates into a CO2 cost of $180/ton, because c50% of emissions are abated on this model.

CO2 prices vs CO2 abatement costs

One problem of this model is that many of the technologies that need to be incentivized have a much higher incentive price than $100/ton. As an illustration, some of the direct subsidies currently offered to different transition technologies are shown below, translated into $/ton terms. A $100/ton CO2 price clearly does not incentivize a technology costing $200-700/ton. So complex additional subsidies would also be needed.

A much more effective iteration of the model allows nature-based solutions into the solution set. Specifically, companies that sponsor reliable nature-based offset projects can use the CO2 abatement from these projects as a credit against CO2 price payments. First, allowing these nature-based offsets is the only way that many industries can realistically get to ‘zero’ CO2. Second, the costs are much lower, and our roadmap to net zero finds that the entire global economy could be decarbonized for an average cost of $40/ton, if 25% of the heavy-lifting is done via nature-based methods (note here).

What is interesting about this scenario, returning to the chart below, is that the average CO2 abatement cost in our ‘best case’ comes in at $40/ton. This is to say, 0% of emitters continue emitting and paying the $100/ton CO2 price (why would you, if you could source nature-based carbon offsets for a much lower price, of $3-50/ton). 100% of erstwhile emitters pay an average abatement cost of $40/ton. And this offsets 100% of emissions, hence the total CO2 abatement cost also comes in at $40/ton.

CO2 prices vs CO2 abatement costs

Note the abatement cost is lower than the CO2 price, in this scenario. This also seems counter-intuitive at first glance. It is a function of two variables: the abatement cost is lower than the CO2 price, and a very high portion of CO2 is being abated. As another example, imagine the government declares a $1,000 fine for anyone caught wearing a yellow T-shirt tomorrow. As a result, no-one wears a yellow T-shirt. The total cost of this policy is therefore zero.

Achieving a low cost transition matters, as our recent work finds that inflation could de-rail high-cost transition pathways (note below). We conclude that CO2 prices can be very powerful. But to be cost-effective, they must genuinely drive decarbonization, rather than simply taxing continued emissions. This is best achieved by integrating nature-based carbon offsets into CO2 pricing frameworks, in our view.

Mass extinctions: insights into systemic risk?

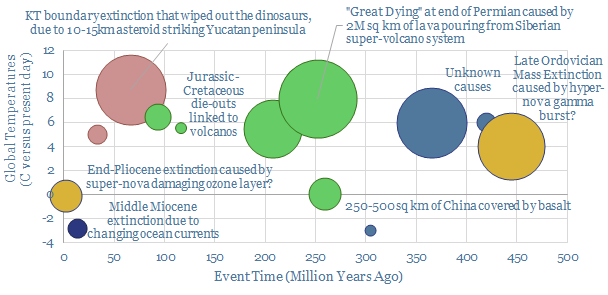
Overview of mass extinctions and energy transition

We have reviewed 14 mass extinctions over the past 500M years, in order to draw five conclusions on systemic risk amidst the energy transition. Current policies may be short-sighted. Improved technologies and nature-based solutions could likely fare better.

Mass extinctions are the ultimate “systemic risks” as they tend to wipe out an average of 50% of all life on Earth (for perspective, Coronavirus has wiped out about 0.05-0.1% of humanity). In almost all cases in our data-file, they are caused by exogenous shocks, which also change the global climate, either by warming it or cooling it. Eventually life has rebounded, although it can take 30M years, while re-balancing the planet towards a different mix of species than came before. Full details can be downloaded here.

If you were to draw a spectrum of cataclysmically bad things that can happen to the world, mass extinctions would probably lie at the extreme. Hence five conclusions and insights follow below from our data-set…

(1) Mass extinctions happen every 15-30M years. This includes 14 events over the past 500M years, through to 4 events over the past 65M years. The numbers are likely towards the more frequent end of the range, as the rock record turns over every 100-300M years, making it hard to detect smaller extinction events from the distant past. This implies that for every 15M year period, there is approximately a “one-in-a-million” chance of a mass extinction event threatening the majority of all life on Earth. Small but not zero.

(2) Are risks preventable? A good, common-sense principle of risk-management is that you should care just as much about low-probability high-impact risks as you care about high-probability low-impact risks. This is why people buy life insurance. But it is hard to see how you protect against vast outpourings from super-volcanos (5 events), enormous asteroids (2 events) or supernovas stripping the world of its ozone layer (2 events). My intuition here is that there is no way to “eliminate” systemic risks that might make the world unlivable.

(3) Policies are effectively useless at preventing many systemic risks. Try banning a volcano from erupting, a virus from mutating or a war from breaking out. There are two thoughts here that keep me up at night: (a) policies focused at averting climate change are at the top of every policymaker’s list right now, but is this coming at the cost of ignoring and thereby inflating other significant systemic risks? (b) worse, will policies focused at averting climate change actually exacerbate some systemic risks? Some examples from our research are here, here and here.

(4) Improved technologies may be a better focus area, as they lower systemic risks across the board. I say this after receiving my second dose of the Moderna vaccine this week. And recalling that totally realistic scene in Armageddon where Bruce Willis flies a rocket to an asteroid and blows it up using nuclear weapons. The thought that fascinates me is how inextricably human resiliency to systemic risks is bound up with energy technologies. This is a rationale for our renewed focus on energy technologies (below).

(5) Nature based solutions? We are currently undergoing one of the greatest mass extinction events in the history of the planet, destroying over one-third of the world’s forests since pre-industrial times, over half of some blue carbon eco-systems and threatening up to 1M species. Solving this problem is the direct rationale for nature-based solutions to climate change, which do not simply use trees to remove CO2 from the atmosphere, but also tackle the underlying issue of not destroying the planet. We argue nature-based activities will emerge as the single largest focus in the energy transition (note below).

Copyright: Thunder Said Energy, 2019-2024.