Rise of China: the battle is trade, the war is technology?

US vs China technology development

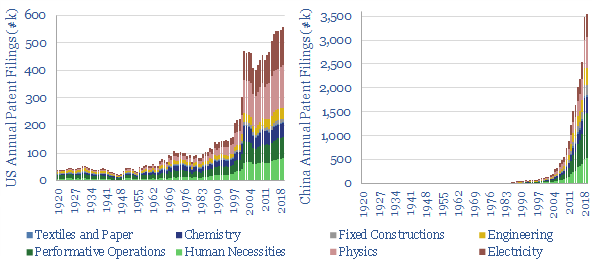
Chinaโ€™s pace of technology development is now 6x faster than the US, as measured across 40M patent filings, contrasted back to 1920 in this short, 7-page note. The implications are frightening. Analysing the US vs China technology development raises questions over the Western worldโ€™s long-term competitiveness, especially in manufacturing; and the consequences of decarbonization policies that hurt competitiveness.


Our conclusions are presented in this short note from tabulating 40M patents in the US and China back to 1920.

China first filed more patents than the US in 2007, and filed 6x more in 2019. Our charts compare the US vs China technology development across multiple industrial categories, presenting implications for trade and energy policy.

The long-term history of patent filings is also compared globally, for the US, for China and for Japan. In some countries, the pace of patent filings has been 90% correlated with GDP growth.

The green hydrogen economy: a summary?

green hydrogen economy

Our mission is to find economic opportunities that can drive the energy transition, substantiated by transparent data and modelling. Therefore, we have looked extensively for opportunities in hydrogen, but somewhat failed to find very many.

More pessimistically stated, we fear that the ‘green hydrogen economy’ may fail to be green, fail to deliver hydrogen, and fail to be economical. We see greater opportunities elsewhere in the energy transition.

This short note summarizes half-a-dozen deep-dive research notes, plus over a dozen models and data-files into the commercialization of hydrogen. There may be opportunities in the space, but they must be chosen very carefully.


An overview of different hydrogen pathways?

We start with an overview of hydrogen pathways. In 2019, c70MT of hydrogen was produced globally. 95% of it was grey, meaning it was derived from steam-methane reforming of natural gas. The cost of this process is around $1.3/kg ($11.5/mcf-gas- equivalent) and efficiency is c70%, which means that replacing 1 kWh of gas with 1kWh of hydrogen actually increases both gas demand and CO2 emissions.

Capture 80-100% of the CO2 from SMR using CCS and you have ‘blue hydrogen’, a fuel that costs c$2/kg ($18/mcfe), with a production efficiency of c60%, and a CO2 content that is 75-100% lower CO2 than combusting the natural gas it is derived from.

Finally, use renewable energy to hydrolyse water, and you have ‘green hydrogen’, which is truly zero carbon. But it currently costs $6-8/kg ($55-70/mcfe) and has 60-90% production efficiency, which is far worse than the best batteries we have researched.

Can hydrogen be economic: in heat, power or transportation?

Costs matter for consumers in the energy transition. For example, we estimate that using blue hydrogen to decarbonize heat would raise an average household’s heating bill by c$670 per year, while green hydrogen would increase it by c$2,600. By contrast, our preferred solution of nature based solutions and efficient natural gas decarbonizes home heating at an incremental cost of $50 per household per year.

Green hydrogen in the power sector does not look viable to us. We have modelled the green hydrogen value chain: harnessing renewable energy, electrolysing water, storing the hydrogen, then generating usable power in a fuel cell. Todayโ€™s end costs are very high, at 64c/kWh. Even by 2040-2050, our best case scenario is 14c/kWh, which would elevate average household electricity bills by $440-990/year compared with the superior alternative of decarbonizing natural gas.

This is despite heroic assumptions in our 2040s numbers, such as a 1.5x improvement in round trip energy efficiency, 80% cost deflation, c40% “free” renewable energy, in situ hydrogen production and use, and nearby salt caverns for low cost storage (so green H2 retails at $3/kg). All of this analysis is based on transparent data and modelling, as shown below. We welcome pushbacks and challenges if you have different numbers.

Challenges are raised about green hydrogen in our work. First, processes fuelled purely by renewables (i.e., electrolysis reactors) will tend to have 30-40% utilization rates at best (half the US industrial average), which amortizes high capital costs over less generation. Second, storage is complex and could be 4-10x more expensive than we assumed, if salt caverns are not nearby. Finally, beware of ‘magic mystery deflation’ that is baked into the estimates of some commentators.

Economizing comes with trade-offs. This is particularly visible when we look at the cost of electrolysers, where lower capex may come at the cost of lower efficiency, reliability, longevity and even safety. Some forecasters are calling for 80% deflation, but we see 15-25% as more likely, if manufacturers wish to make a margin in the future, and as many of the cost components are technically mature.

Green hydrogen in trucking may offer more promising inroads, particularly in well-chosen niches. Trucking consumes 10Mbpd of diesel globally and emits c1.5bn tons of CO2 per year, which is 3.5% of the global total. Current full-cycle costs of hydrogen trucks are c30% higher than diesels. This is based on $150k higher truck costs, 85% higher maintenance and $7/kg green hydrogen plus $1.5/kg retail margins.

But a full and rapid switch to hydrogen trucks in Europe would cost an incremental $50bn per year (equivalent to a 0.3% off Europeโ€™s GDP, plus multipliers). 2040s green hydrogen truck costs could become competitive with diesel, in Europe, but again, this is incorporating some heroic assumptions. In particular, fuel retail margins for hydrogen may need to be c20x higher than for conventional fuels in remote locations with little traffic.

Immutable midstream issues: an anomalous commodity?

All of the value chains and models above assumed hydrogen was generated in situ, via electrolysis, at its point of use. However, in order for hydrogen to scale up, it would need to be transported, like other commodities.

Transporting hydrogen may be more challenging than any other commodity ever commercialised in the history of global energy. Costs are 2-10x higher than gas value chains. Up to 50% of hydrogen’s embedded energy may be lost in transit. We find these challenges are relatively immutable. They are due to physical and chemical properties of H2, plus the laws of fluid mechanics, which cannot be deflated away through greater scale.

For example a hydrogen pipeline will inherently cost 2-10x more than a comparable gas pipeline. This is down to fluid dynamics, as the hydrogen line, all else equal, will flow 25% less energy (due to the gravity, energy density and compressibility of hydrogen gas), but require c30% more expensive reinforcement and materials (due to hydrogen’s lower molecular mass and proneness to causing embrittlement and stress cracking in high-pressure lines).

Moving hydrogen as ammonia is another option. Air Products recently sanctioned a $7bn project to produce green hydrogen in Saudi Arabia, convert it to ammonia, then ship the ammonia to Europe or Japan. Its guidance implies hydrogen could be imported at $10/kg while earning a 10% IRR. But we needed to assume several cost lines are budgeted at 50% below recent comparison-points to match this guidance. Our sense is that a comparably complex LNG project might warrant a 20% hurdle rate. Thus to be excited by this project, we would want to see a hydrogen sales price closer to $15/kg.

Is Magic Mystery Deflation a Cure All?

The pushback to our hesitations is that deflation will prevail, costs will fall and green hydrogen will ultimately become economic in ways that are hard to model ex-ante. This is possible, but it is not borne out by our work reviewing over 1M patents. The โ€˜averageโ€™ topic in the energy transition is seeing c600 patents filed per year (ex-China) and accelerating at a 5% CAGR. Hydrogen fuel cells saw 222 in 2019 and are declining at a -10% CADR. Hydrogen trucks and fuelling stations saw c300 patents in 2019 which is flat on 2013.

The patents also flag complexities. How do you safely prevent explosions in the event of a crash? How do you keep a fuel cell hydrated in dry climates, cool under thermal loads and starting smoothly in very cold climates? How do you add odorants to hydrogen to lower the risk of undetected leaks, if odorants poison fuel cells? Who is legally liable if a fuel cell is poisoned by inadvertently selling contaminated hydrogen?

We would be wary of companies that have made extensive promises, especially around future economics, but without having developed the underlying technologies being promised. This creates a high degree of risk.

To help identify technology leaders, we have assessed the patents filed in fuel cells, electrolyers, hydrogen vehicles and in fuelling infrastructure.

Conclusion. Policymakers are currently aiming to accelerate the development of green hydrogen. Our own work into the economics and technical challenges make us nervous that these policies may need to be walked back over time. There may be some interesting use cases for hydrogen in the energy transition (especially blue hydrogen). But the history of technology transitions does not suggest to us that a green hydrogen economy could emerge and have any meaningful impact on climate within the required 20-30 year timeframe.

Carbon offsets: ocean iron fertilization?

Carbon offsets through ocean iron fertilization

Nature based solutions to climate change could extend beyond the world’s land (37bn acres) and into the world’s oceans (85 bn acres). This short article explores one option, ocean iron fertilization, based on technical papers. While the best studies indicate a vast opportunity, uncertainty remains high: on CO2 absorption, sequestration, scale, cost and side-effects. Unhelpfully, research has stalled due to legal opposition.


Nature based solutions to climate change are among the largest and lowest cost opportunities to achieve “net zero” and limit atmospheric CO2 to 450ppm, as summarized here. But so far, all of our research has been limited to land based approaches.

The ocean is much larger, covering 85bn acres, compared with 37bn acres of land. Furthermore, compared to the c900bn tons of carbon in the atmosphere, there is c38,000 bn tons of carbon stored in the oceans (chart below). Of this, c1,000bn tons is near the surface and 37,000 bn tons is in deeper waters. The surface and the deep waters exchange c100 bn tons of carbon per year (in both directions), through the “ocean biological pump”, which is c8x higher than total manmade CO2 emissions of c12bn tons of carbon per annum. These numbers are largely derived from the IPCC and our own models.

A vast opportunity to mitigate atmospheric CO2 in oceans is suggested by the figures above. The mechanism would need to increase the primary productivity of oceans (i.e., the amount of CO2 taken up by photosynthetic organisms) and the sinking of that fixed organic material into deep oceans, where it would be remain for around c1,000 years.

Below we will describe the process of ocean iron fertilization, which has been explored to sequester CO2 in the intermediate and deep ocean. First, we will introduce some terms and definitions.

An Ocean In Between the Waves

The mixed layer (ML) captures the surface of the ocean. It is named because this surface layer of water is effectively mixed together by turbulence (e.g., waves) so that its composition is relatively homogenous. The depth of the mixed layer ranges from around 20-80 meters. It tends to be larger in the winter than the summer. This is also the layer of the ocean penetrated by light and capable of supporting photosynthesis.

Phytoplankton in the mixed layer are responsible for 40% of the world’s photosynthesis and oxygen production. They are single celled microorganisms that drift through the water. They comprise micro-algae and cyanobacteria. They make up 1-2% of global biomass. Under optimal conditions, algae can fix an enormous 50T of CO2 per acre per year, which is 10x higher than typical forests (data file here).

However, typical conditions are not optimal conditions. Total primary productivity of marine organisms is around 100 bn tons per year. This implies CO2 is fixed at around 4T/acre/year, on a gross basis, not including the CO2 that is respired back again by other organisms.

Iron is an essential limiting factor for the uptake of macronutrients in phytoplankton. Typically, with iron concentrations below 0.2nM, phytoplankton cannot absorb macronutrients (especially nitrates) for photosynthesis.

The major source for ocean iron is dust inputs to the ocean from land. Indeed, one theory on the cause of the last Ice Age is a vast uptick in desert dusts or volcanic ash blowing into the ocean, enhancing the productivity of phytoplankton, raising the CO2 dissolved in the oceans, and lowering CO2 in the atmosphere (which was measured at 180ppm at the last glacial maximum, 20,000 years ago, compared to 280ppm in pre-industrial times).

The Martin hypothesis suggests, therefore, that Ocean Iron Fertilization (OIF) could increase oceanic carbon, sequestering CO2 in intermediate- and deep-ocean layers for storage over c1,000-years. As Martin famously (hyperbolically) stated it, “give me half a tanker of iron and I will give you another Ice Age”.

High nutrient low-chlorophyll concentrations (HNLC) indicate the areas where OIF is most likely to be effective. HNLC suggests primary productivity is below potential levels, due to a shortage of iron. HNLC regions include the North Pacific, Equatorial Pacific and Southern Ocean.

Ocean Iron Fertilization: Productivity Increases

6 natural and 13 artificial OIF experiments have been performed since 1990 into ocean iron fertilization, denoted as nOIF and aOIF respectively.

All the aOIF experiments were conducted by releasing commercial iron sulphate dissolved in acidified seawater into the propeller wash of a moving ship, over initial areas from 25-300 sq km. By the end of the experiments fertilized areas have spread as far as 2,400 sq km (as evidenced by sulfur hexafluoride tracers). The iron is rapidly dispersed and taken up, dropping from 3.6nM to 0.25nM in 4-days, and often refertilized.

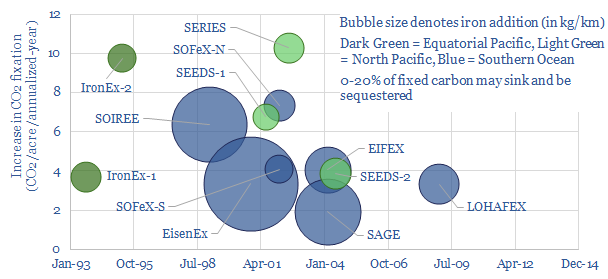
Primary production is significantly enhanced, with potential 100,000:1 ratios of carbon fixation to iron additions. Maximum phytoplankton growth occurs in response to 1.0-2.0nM. For example, in one experiment, denoted as IronEx-2, surface chlorophyll increased 27-fold, peaking at 4 mg/m3 after 7-days, increasing primary productivity by 1.8gC/m2/day. On an annualized basis, this is equivalent to around 10 tons of CO2e per acre per year.

Other studies are shown below. CO2 absorption has been highly variable and does not correlate with the amount of iron that is added. This indicates a complex biophysical system, which requires a deeper understanding.

It’s only a Carbon Sink if the Carbon Sinks.

The largest controversy around the effectiveness of aOIF is whether the carbon will sink into the intermediate and deep oceans. High carbon export has been observed in natural OIF in the Southern Ocean near the Kerguelen Plateau and Crozet Islands, so we know that the process can sequester CO2.

But of the 13 artificial OIF experiments, only one (EIFEX) has conclusively shown additional carbon fixation sinking into the deep ocean. The study saw carbon export down to 3,000m, as phytoplankton blooms aggregated and sank. But others have been less clear cut.

The skeptics argue that across the broader ocean, only 15-20% of CO2 fixed by photosynthesis sinks into the intermediate ocean and just c1-2% sinks into the deep ocean. The remainder is grazed by zooplankton or bacteria, so the fixed carbon is metabolized and respired back into the atmosphere. While CO2 sinking can be higher in nOIF, this is a continuous and slow process, based on the upwelling of iron-rich subsurface waters. Conversely, aOIF will inherently be episodic, with massive short-term iron additions, and thus perhaps struggle to be as effective.

The proponents argue back that past studies have failed to measure carbon sinkage due to limitations in their experimental design. The one clear success, at EIFEX, was a a 39-day study, while others may not have been sufficiently lengthy. In other studies, there were simply no measurements in the deep ocean or outside the fertilized patch for comparison (e.g., IronEx-2). In other studies, the measurement methods over a decade ago may not have been sufficiently — based on tracers (Thorium-234) or physical traps that are meant to collect organic matter, which are known to be disrupted by currents.

Diatom blooms could also enhance future sinkage. Diatoms are a group of unicellular micro-algae that make up nearly half of the organic material in the ocean, forming in colonies that tend to aggregate and sink more readily than other phytoplankton types. Primary productivity has doubled in past aOIF studies where diatoms dominated. The prevalence of diatoms in phytoplankton blooms can be enhanced in areas rich in silicates.

Future experiments can also test the process more effectively, identifying the right conditions for diatoms to dominate the blooms, aggregate and sink; which in tun hinges on abundant silicates and low grazing pressure from mesozooplankton. It is suggested to conduct studies in ocean eddies, which naturally isolate 25-250km diameter areas for 10-100 days. More precise measurement is also possible using satellite data; and unmanned aquatic vehicles equipped with transmissometers, which measure the impedance of light by materials such as sinking organic matter (our screen below finds a rich improvement in autonomy and precision of concepts for the oil and gas industry).

Unintended climate consequences and feedback loops?

The other criticism of OIF is that interfering with nature ecosystems can have unintended consequences, both for biodiversity and for climate.

N2O is a complication. It is a 250x more potent greenhouse gas than CO2. The ocean is already a significant source of N2O, from bacterial mineralization. N2O increased by 8% at 30-50m during on aOIF trial, named SERIES. Models suggest excess N2O after 6-weeks could offset 6-12% of the CO2 fixation benefit. Conversely, other studies suggest OIF acts as a sink for N2O, as it also sinks alongside aggregates.

Dimethyl Sulfide (DMS) is another by-product of aOIF, from the enzymatic cleavage of materials in planktons. DMSs may be a precursor of sulfate aerosols that cause cloud formation. This would counteract global warming. Fertilizing 2% of the Southern Ocean could increase DMS c20% and produce a 2C decrease in air temperatures over the area, one study has estimated. Others disagree and do not find increases in DMS from aOIF.

A commercial hurdle: commercial aOIF is currently illegal

The current legal framework actually prohibits OIF in international waters because of a perceived threat of environment damage by profit-motivated enterprises. Specifically, regulations from 2008 and 2013 categorize OIF as marine geo-engineering and thus it is not allowed at large scale (>300 sq km) or commercially.

This seems unhelpful for unlocking a potentially material solution to climate change. Companies such as GreenSea Venture and Climos, which were set up to harness the opportunity appear to have dissolved. As one recent technical paper stated, โ€œno other marine scientific institutions are willing to take up the challenge of carrying out new experiments due to the fear of negative publicityโ€.

Others have illegally explored OIF, flouting regulations. For instance, in 2012, Haida Salmon Restoration dumped 100 tons of iron sulphate into international waters off Haida Gwai, British Columbia, in an attempt to raise salmon populations.

Conclusion: large potential, large uncertainty and likely stalled

The costs of OIF are highly uncertain and estimates have ranged from $8/ton of CO2 to $400/ton of CO2. It is currently not clear how a commercial aOIF project would need to be designed in order to calculate precise costs.

Total CO2 uptake potential from ocean iron fertilization is also vastly uncertain and has been estimated between 100M and 5bn tons of CO2 per year globally. The upper end of the range could be conceived as c0.5T of CO2-equivalents sinking per acre per year across a vast c10bn acres of ocean. But again, this is not possible on today’s understanding.

The technique is likely limited to oceans that are deficient in iron but rich enouch in other nutrients (e.g., the North Pacific, Equatorial Pacific and Southern Ocean). Moreover, blooms are limited to c2-months over summer, where nutrients are welling up from subsurface waters, light is available but grazing pressure from zooplankton remains light.

Uncertainty is very high and for now the technique is stalled due to stifling regulation and low research activity. Hence for now, we reflect OIF on our CO2 cost curve, but we have taken the more conservative ranges above as inputs.

Sources:

Yoon, J-E., Yoo, K-C., MacDonald, A., et al (2018). Reviews and syntheses: Ocean iron fertilization experiments โ€“ past, present, and future looking to a future Korean Iron Fertilization Experiment in the Southern Ocean (KIFES) project. Biogeosciences, 15.

Ciais, P., C. Sabine, G. Bala, L. Bopp, V. Brovkin, J. Canadell, A. Chhabra, R. DeFries, J. Galloway, M. Heimann, C. Jones, C. Le Quรฉrรฉ, R.B. Myneni, S. Piao & P. Thornton, (2013). Carbon and Other Biogeochemical Cycles. In: Climate Change 2013: The Physical Science Basis. Contribution of Working Group I to the Fifth Assessment Report of the Intergovernmental Panel on Climate Change. Cambridge University Press, Cambridge, United Kingdom and New York, NY, USA.

Report to Congress (2010). The Potential of Ocean Fertilization for Climate Change Mitigation.

Solar energy: is 50% efficiency now attainable?

solar efficiency in record-breaking multi-junction cells

Most commercial solar cells achieve 15-25% efficiencies, converting incoming solar energy into usable electricity. But a new record has been published in 2020, achieving 47.1% conversion efficiency. The paper used “a monolithic, series-connected, six-junction inverted metamorphic structure under 143 suns concentration”. Our goal in this short note is to explain this solar efficiency record.


“A monolithic, series-connected, six-junction inverted metamorphic structure under 143 suns concentration”

p-n junctions are the foundation of all solar cells. Each side of the junction is doped, so that the โ€œnโ€-side will surrender electrons, while the โ€œpโ€-side will accept electrons. When incoming solar energy strikes the junction, it may dislodge an electron and leave behind a hole. The liberated electron will propagate towards the โ€œpโ€-side, while the holes will propagate towards the โ€œnโ€-side, thus creating a direct current.

Bandgap is the energy needed to dislodge an electron from its usual orbit, so it is free to move through a p-n junction. The energy in light varies with wavelength (lower-wavelength equals lower energy). Light waves below the bandgap will not suffice to dislodge electrons: they will pass through the material and the energy will not be captured. Light waves above the bandgap will have excess energy left over after dislodging electrons: the excess energy will be lost as heat.

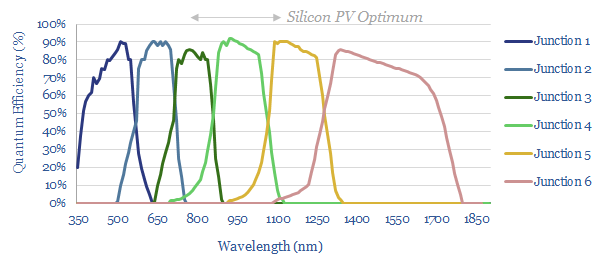
Single-junction solar cells are composed of p-n junctions made of a single material, most commonly crystalline silicon, in today’s commercial solar industry. Silicon atoms have a bandgap of 1.4eV and achieve optimum conversion efficiency in light with 700-1,000nm wavelengths (red and infra-red). They do not capture energy efficiently from lower energy, lower wavelength light (such as 400-700nm) or very high wavelength light (1,000nm+).

Multi-Junction solar cells aim to overcome the limitations of single-junction solar cells, combining multiple p-n junctions, made of multiple solar materials, to capture a broader range of the spectrum. For example, the six-junction solar cell discussed in this note has six separate junctions, connected in series, to capture light from c350-1700nm wavelengths, which is tantamount to c65-85% of all the energy in sunlight.

Group III-V alloys are used in different combinations in each of these junctions, to tune its bandgap, to capture a different wavelength of light. These alloys are composed of elements from Groups III and V in the periodic table. Group III includes boron, aluminium, gallium and indium. Group V includes nitrogen, phosphorus, arsenic and antimony.

The junctions are usually stacked with the highest energy absorber on top (i.e., junction 6). Photons that lack sufficient energy to dislodged electrons in junction 6 will pass through it, and have a additional chances of being absorbed in junction 5, through to junction 1.

The challenge is how to stack these six junctions on top of each other in a way that limits recombination and resistance, both of which are going to impair solar cell efficiency.

The challenge of recombination?

Recombination occurs when dislodged electron and holes re-combine in a solar cell, thereby lowering the current reaching the current collectors. If recombination re-emits photons, it is known as radiative recombination. Group III-V solar cells are particularly sensitive to recombination around dislocations.

Dislocations are abrupt changes in the crystal structures in a material. A physical effect is that dislocations allow atoms to glide or slip past one another at low stress levels. An optoelectronic effect is to impede current and encourage recombination of electrons and holes.

One type of dislocation, known as a threading dislocation because of its shape, extends beyond the surface of the strained layer and throughout the material, so it can be particularly deleterious to solar cell performance.

Multi-junction solar cells are particularly prone to dislocations because each junction is made of a different material. These materials are lattice-mismatched monoliths.

Monolithic materials are formed a single, continuous and unbroken crystal structure, all the way to its edges, with minimal defects or grain boundaries. This means it does not suffer from grain boundaries or dislocations, and in turn, efficiency losses from recombination should be minimized. But it is very difficult to manufacture monolithic materials from lattice-mismatched components.

Lattice-mismatched materials have different lattice constants. This means that they are composed of crystals of different sizes. In turn, this means they will not adhere well to one-another. Their boundaries are prone dislocations.

The solution: metamorphic epitaxy?

A technique called metamorphic epitaxy was used to create the monolithic six-junction solar cells described above, and overcome the inter-related challenges of recobination at dislocations in lattice mismatched materials.

Epitaxy is the process of orientation-controlled growth of crystals on top of other crystals. The 47% efficient solar cell used a variant called organometallic vapour phase epitaxy (OMVPE). Our overview of manufacturing methods is here.

Metamorphic epitaxy minimizes dislocations around the active site of an engineered material. This is achieved by relieving the strain around lattice-mismatched boundaries by encouraging dislocations to occur away from the active site of the material. Specifically, materials known as Compositionally Graded Buffers (CGBs) were introduced in between the fourth to sixth junctions of the six-junction solar cell, as thse were the boundaries most prone to dislocations.

Specifically, these six-junction solar cells were monolithically grown on a single 2×3 cm GaAs substrate, at 550-750C temperatures, in an atmospheric-pressure OMVPE system.  โ€œGrowth begins with the high-bandgap lattice-matched junctions [on the bottom], leaving these high-power-producing junctions without dislocationsโ€.

Then the cell was then inverted as the high bandgap lattices need to be situated on the top of the cell. (In other words, the cell is printed upside down and then turned over). Gold was electroplated onto contact of the inverted structure (literally, “gold-plated”!), then the cell was epoxied onto a flat silicon wafer. The GaAs substrate was removed by chemical etching. A front-side grid of NiAu was deposited by photolithography. Finally an anti-reflective coating of MgF2/ZnS/MgF2/ZnS was thermally deposited on the top of the cell.

The full 6J IMM structure consisted of 140 layers, including individual compositional step-graded buffer layers. The total growth time was 7.5โ€‰h.

1 sun’s concentration?

Under 1 sun’s solar intensity, the cell described above achieved 39.2% efficiency. This is the highest 1-Sun conversion efficiency demonstrated by any technology to-date. The prior record is 38.8% for a five-junction bonded IIIโ€“V solar cell.

The efficiency is very high, because the voltages of each junction add up to a high total voltage. However, the current density in each junction was low. The efficiency could have been higher with a higher current density, which in turn, is achieved by concentrating the incoming sunlight.

143 suns’ concentration?

Concentration of incident light improves solar cell efficiency. The reason is that more concentrated light dislodges more electrons. More dislodged electrons means a higher current density. In turn, a higher current density raises the bandgap for dislodging further electrons (it is harder to remove further electrons from a material that has already lost some electrons). So even more energy can be absorbed when additional light strikes the cell.

Concentrating solar light is also desirable as a way to lower costs, as multi-junction solar cells are expensive to produce. Concentrating the light from 1 square meter onto 1 square centimeter, for example, reduces the area of solar materials required by a factor of 10,000.

Joule losses set the upper limit on the solar concentration that will maximize efficiency. Joule losses are the loss of electricity as heat when electric current passes through a conductor. They are a square function of current and a linear function of resistance. So they rise quadratically as solar intensity rises linearly.

Lower resistance will help to limit joule losses. In the solar cell described above, several challenges were observed keeping resistance low.

Each junction is connected in series in the cell. The current flows between each junction through a “tunnel interconnection”. Resistance through these tunnel junctions was found to rise with current, placing a practical limit on solar concentrations.

Internal resistances within each junction were also higher than desired. They were found to have been elevated by the temperatures during epitaxy and during dopant diffusion (particularly in Zn-containing layers).

At the top junction, the 2.1eV bandgap material required a high resistance to conduct charge laterally to the metal grid fingers that serve as current collectors for the cell’s electrical circuit.

Reducing the effective series resistance to 0.015โ€‰ฮฉโ€‰cm2 is seen to be possible, by analogy to previous four-junction solar cells, which would allow the six-junction cell described above to surpass 50% efficiency at 1,000โ€“2,000 Suns. The maximum theoretical efficiency is 62%.

Commercial implications?

47-50% efficient solar cells are a good incremental improvement. To put the ‘breakthrough’ into context, the previous record for a multi-junction solar cell was 46% efficiency at 508 suns, using a four-junction device. There is scope for multi-junction solar cell efficiency to improve further.

The cell was also very small, at 0.1cm2. When solar ‘records’ are measured, usually the stipulation is required that a cell must be 1cm2 in area, as a testing criterion.

Its production was very complex taking 7.5-hours to assemble 140 separate layers. Complex structures are expensive and more prone to degradation, which makes commerciality challenging.

We conclude that a 47-50% efficient solar cell is a tremendous technical achievement. But the evidence does not yet suggest proximity to commercialising ultra-efficient multi-junction solar cells like this at mass scale. All of our solar research is summarized here.


Source: Geisz, J. F., France, R. M., Schulte, K. L., Steiner, M. A., Norman, A. G., Guthrey, H. L., Young, M. R., Song, T. & Moriarty, T. (2020). Six-junction IIIโ€“V solar cells with 47.1% conversion efficiency under 143 Suns concentration. National Renewable Energy Laboratory (NREL), Golden, CO, USA.

Energy Technologies and Energy Transition

energy technologies and energy transition

Below is an overview of our written research into energy technologies and the energy transition, to help you navigate our work, by topic. The summary below captures 1,000 pages of output, across 50 research notes and 40 online articles since April-2019.

Energy Transition Technologies

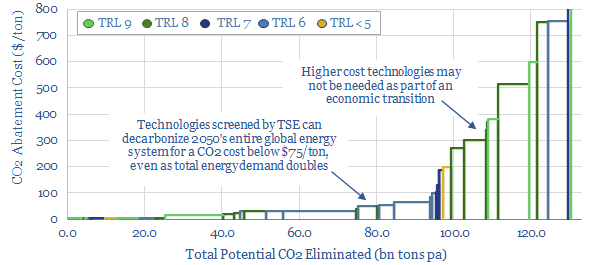
The most economic route to ‘net zero’ is to ramp renewables to 20% of the total energy mix, treble demand for natural gas, pursue industrial efficiency gains, make fossil fuels the most efficient and lowest carbon possible, and then capture or offset the remaining CO2. Total investment of $70trn is required and CO2 prices do not need to surpass $75/ton.

Investing for an Energy Transition (Oct-19, 18-pages)

Energy Transition Technologies: the pace of progress? (July-2020, 3-pages)

What Oil Price is best for an energy transition? (April-2020, 15-pages)

TRLs: When does technology get exciting? (May-2019, online)

Nature Based Solutions to Climate Change

Nature based solutions include reforestation, restoring soil carbon and biomass burial. These are the largest and lowest cost options in the energy transition. They will ramp up vastly in the 2020s, creating new opportunities for for every sector to sell carbon-neutral products while earning elevated returns.

Nature based solutions to climate change: a summary (July-2020, online)

Reforestation: Can carbon-neutral fuels re-shape the oil industry? (May-2020, 26-pages)

Decarbonize Gas: how to make a gas value chain CO2 neutral? (Mar-2020, 15-pages)

Conservation agriculture: farming carbon into soils? (May-2020, 17-pages)

Biomass burial: better to bury biofuels than the burn them? (May-2020, 12-pages)

Green deserts: a final frontier for forest carbon? (July-2020, 18-pages)

Oil and Gas Markets

Oil and gas remain crucial in our decarbonized energy models. Our long-term outlook sees sharp demand growth for natural gas, while oil could also rebound rapidly after the COVID crisis. Hence we bridge to record under-supply in both commodities in the mid-2020s.

Oil Markets: the next up-cycle? (July-2020, 4-pages)

On the road: long-run oil markets after COVID-19? (May-2020, 17-pages)

LNG: deep disruptions and a 100MTpa shortfall? (Apr-2020, 6-pages)

2050 oil markets: opportunities in peak demand? (Sep-19, 20-pages)

The ascent of global LNG demand? (Sep-2019, online)

Drone Attacks on Energy Assets? (Sep-2019, online)

Natural Gas

Gas demand could treble between now and 2050, in order to achieve an economic energy transition. This requires minimizing methane leaks and unlocking decarbonized gas technologies, which are among the top opportunities in our gas research.

Decarbonize Heat: a cost comparison of 20 technologies? (May-2020, 20-pages)

Mitigating methane leaks in global gas: catch methane if you can? (Dec-2019, 23-pages)

DeCarbonizing Carbon: Oxy-Combustion and Chemical Looping Combustion (July-2020, 19-pages)

Molten Carbonate Fuel Cells: what if carbon capture generated electricity? (Feb-2020, 27-pages)

LNG in transport: scaling up by scaling down? (May-2019, 20-pages)

Do methane leaks detract from natural gas? (Mar-2020, online)

Reliable remote power to mitigate methane? (Apr-2020, online)

Satellites: the spy who loved methane? (Dec-2019, online)

Shell drives LNG in transport? (July-2019, online)

Wind and Solar

The optimal share of renewables in a decarbonized energy system is 20-40%, but not higher. The opportunities that excite us most are next-generation wind and solar.

Decarbonized power: how much wind and solar fit the optimal grid? (Feb-2020, 24-pages)

Solar energy: is 50% efficiency now attainable? (July-20, online)

Two Majorsโ€™ Secret Race for the Future of Offshore Wind? (Apr-2019, online)

Offshore Wind: Tracking Turbines with Satellites and Machine Learning? (Jan-2020, online)

Perovskites: Lord of Light? (June-2019, online)

Energy Storage & Hydrogen

We are cautious on energy storage, due to the economics. Lithium ion batteries may be disrupted, while technical and economic challenges are under-appreciated. We are also cautious on the role of hydrogen in the energy transition due to low round-trip energy efficiencies, high costs and complex storage.

Decarbonized power: how much wind and solar fit the optimal grid? (Feb-2020, 24-pages)

Green Hydrogen Economy: Holy Roman Empire (July-2020, 16-pages)

Energy storage: will supercapacitors disrupt batteries? (June-2020, 20-pages)

Electric Vehicles Increase Fossil Fuel Demand? (Feb-2020, 13-pages)

Good batteries versus bad batteries: round trip? (June-2019, online)

Transportation & Vehicles

Electrification of vehicles goes far beyond the current trend of electric cars. Much more exciting are new, light vehicle concepts that would never have been possible using combustion-based power trains. They can be revolutionary. Heavy vehicles will remain fossil-fuelled with energy savings from hybridization.

Green hydrogen trucks: delivery costs? (Jul-2020, 18-pages)

Remote possibilities: working from home? (Mar-2020, 21-pages)

Electric Vehicles Increase Fossil Fuel Demand? (Feb-2020, 13-pages)

Drones & droids: deliver us from e-commerce (Oct-19, 20-pages)

Scooter Wars: are smaller electric vehicles better? (July-2019, 13-pages)

Aerial ascent: why flying cars will fly? (June-2019, 21-pages)

Could new airships displace trucks? (Feb-2020, online)

De-Carbonising Cars. Can Oxy-Combustion Save Gasoline? (July-2019, online)

Robot delivery: unbelievable fuel economy? (June-2019, online)

Industrial Efficiency & Digitization

Global carbon prices will be instated in the 2020s and re-shape the cost curve in every industry. Our research identifies technologies that will help to lower CO2 intensity and improve returns in the process.

Additive Manufacturing: 3D printing an energy transition? (June-2020, 21-pages)

Efficient frontiers: improvements from a CO2 price within oil and gas? (June-2020, 14-pages)

Digitization after the crisis: who benefits and how much? (Apr-2020, 22-pages)

More dangerous than coronavirus? The safety case for digital and remote operations (Apr-2020, online)

Internet versus Oil: CO2 contrast? (Nov-2019, online)

CO2-labelling for an energy transition? (Nov-2019, online)

Disrupting Agriculture: Energy Opportunities? (Sep-2019, online)

Digital Deflation: How Hard to Save $1/boe? (June-2019, online)

Oil Majors

Attaining ‘Net Zero’ is an opportunity for leading Oil Majors to uplift their valuations by c50% while driving the energy transition. It requires making the right portfolio shifts, reducing CO2 intensity, growing through advanced technologies and enhancing retail returns by CO2-offsetting their products.

Net zero Oil Majors: four cardinal virtues? (June-2020, 19-pages)

Net Zero Oil Majors: what cost? worth the cost? (July-2020, online)

Upstream technology leaders: weathering the downturn? (Apr-2020, 14-pages)

Portfolio Perspectives: what is the optimal Major’s allocation to renewables? (Nov-19, 7-pages)

Shell: innovating the future of LNG plants? (Jan-2020, 16-pages)

Patent Leaders in Energy (Sep-19, 34-pages, and a video)

Oil Companies Drive the Energy Transition? (June-2020, 17-pages)

Chevron: SuperMajor shale in the 2020s? (Feb-2020, 11-pages)

Does technology drive returns in a commodity sector? (Aug-2019, online)

The Shale Revolution

Shale productivity continues to improve at a phenomenal pace and will re-define the oil and gas industry, with potential to produce 25Mbpd of liquids from the bottom of the cost curve. The best-operated shales could be carbon neutral.

US Shale: the quick and the dead? (May-2020, 10-pages)

Shale growth: what if the Permian went CO2-neutral? (Dec-2019, 26-pages)

US Shale: No Country for Old Completion Designs (Aug-2019, 18-pages)

Shale: upgrade to fiber? (July-2019, 25-pages)

CO2-EOR in shale: the holy grail? (Aug-2019, online)

Enhanced Oil Recovery in Shales: container class? (May-2019, 16-pages)

US Shale: Winner Takes All? (Apr-2019, 13-pages)

An EOG digitization: pumped up? (Jan-2020, online)

EOG Completions: plugged in? (Apr-2019, online)

New Diverter Regimes for Dendritic Frac Geometries? (Nov-2019, online)

Pioneer: machine learning on Permian seismic? (Apr-2019, online)

Permian CO2-EOR: pushing the boundaries? (July-2019, online)

Offshore Oil & Gas

Offshore oil and gas will be forced to redefine itself to compete with shale. Again, the best projects can achieve CO2 neutrality, as well as higher NPVs per barrel than shale.

The future of offshore: fully subsea? (Mar-2020, 21-pages)

Johan Sverdrup: Donโ€™t Decline? (July-2019, 15-pages)

Guyana: will low carbon credentials lower capital costs? (Oct-2019, 17-pages)

Mero Revolutions: countering CO2 in pre-salt Brazil? (Aug-2019, 16-pages)

Can technology revive offshore oil and gas? (May-2019, 18-pages)

New riser designs for pre-salt Brazil? (Aug-2019, online)

Downstream & Chemicals

The most exciting opportunities are next-generation catalysts and capturing further value in waste plastics.

Decarbonize downstream: a digital transformation in catalyst science? (Nov-2019, 25-pages)

Plastic Pyrolysis: Turn the Plastic Into Oil (Apr-2019, 16-page report)

Turn waste plastic into roads? (Apr-2020, 6-pages)

Carbon-negative plastics: a breakthrough (from TOTAL)? (June-2020, online)

Do refineries become bio-refineries in the energy transition? (Sep-2019, online)

Shale: restoring downstream balance? New opportunities in ethylene and diesel (June-2019, online)

IMO 2020. Fast Resolution or Slow Resolution? (May-2019, online)

CO2, Climate and Other

We practice what we preach and were a CO2 neutral business in 2019. Further observations on the energy transition debate follow below.

Thunder Said Energy: CO2 Neutral in 2019? (Jan-2020, 9-pages)

Climate science: staring into the sun? (Feb-2020, online)

Energy Transition: polarized perspectives? (Jan-2020, online)

The Most Powerful Force in the Universe? (Jan-2020, online)

Subscriptions to our research

In addition to the above, over 200 data-files are available to our subscription clients. This includes economic models, screens of technology leaders, patent screens and CO2 comparisons to identify the lower- and higher-carbon companies within different sub-sectors. For further details of our firm-wide subscription packages, please see here.

Net zero Oil Majors: worth the cost?

Net zero Oil Majors

A typical Oil Major can uplift its valuation by 50% through targeting net zero CO2. This requires demonstrating four cardinal virtues, as outlined in our recent research note (below). However, a recurrent question is “how much will it cost?”. This short note presents an answer, concluding that the costs are likely to be worthwhile.

Our starting point is to model a typical Oil Major with 1Mboed of upstream production, 1Mbpd of refining and marketing, a gas marketing business and 5MTpa of annual chemicals production. We estimate this Oil Major would have around 30MTpa of Scope 1&2 emissions, 200MTpa of Scope 3 Emissions, over $4bn pa of sustaining capex and almost c$4bn pa of opex. To rebase these numbers for a Major that produces, say, 2.5Mboed, simply multiply all of the above figures by 2.5x, and you have an approximation.

The costs of lowering Scope 1&2 emissions are calculated using granular examples in our recent research note below. We estimate that the first c10% of CO2 reductions unlock net economic benefits prior to a CO2 price, with average capex costs of $150/Tpa. The next 10% require a $1-100/ton CO2 price and cost $850/Tpa. Another c5% emissions reductions are possible, but require higher CO2 prices and cost $2,250/Tpa.

An additional method to lower Scope 1&2 CO2 emissions is to power c10% of operations with renewables. This will also cost $850/Tpa of CO2 that is saved, based on our economic models of wind and solar projects (below).

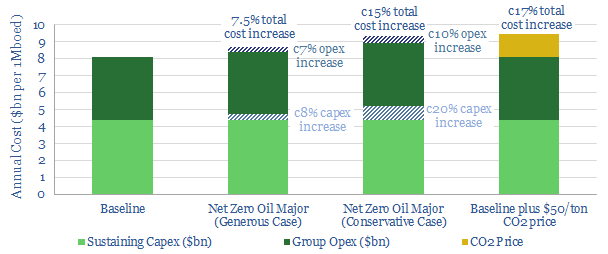
Thus a typical Oil Major can eliminate 35% of its Scope 1&2 CO2 emissions through funding efficiency technologies and renewables. The average cost of these CO2 reductions is $850/Tpa. Spread out over a period of 10-years, this would increase the Major’s annual sustaining capex by c20%, we calculate.

The remaining 65% of CO2 emissions would need to be offset using nature based solutions, which screen among the lowest cost and most scalable decarbonization opportunities on the planet. The note below provides a short summary of several hundred pages of our research on the topic.

We estimate an incremental c10% would be added to group opex, through funding nature based solutions to reach net zero, at a conservative cost of $25/ton per carbon credit.

Overall costs are thus seen to be 15% higher for a Major that transitions to net zero, using the combination of options described above (chart below). This is equivalent to $1.2bn pa of incremental annual costs for a typical 1Mboed integrated oil company.

For contrast, if $50/ton global CO2 prices are introduced, and a Major chooses not to decarbonize, we estimate that the same company would incur a 17% annual cost increase. In other words, if you think $50/ton global CO2 prices are likely to come into force within the next decade, it would be lower cost to shift a business towards net zero pre-emptively.

It could be a lot lower cost. For example, the cost increase could be reduced to 7.5% per annum, if (a) the company did not fund the final, 5% most expensive CO2 reductions (b) spaced its spending over 15-years rather than 10-years and (c) could source nature based offsets at the bottom end of our modelled range of $13/ton rather than $25/ton (chart below).

Although costs are increasing by 7.5-15%, as a Major transitions to Net Zero Scope 1&2, this can be more than offset by the virtues identified in our original work: tilting businesses towards value-accretive areas, benefitting from 2pp lower capital costs in financial markets, targeting efficiency gains that uplift economics and commercializing CO2 offsets at an additional margin (to cut Scope 3 emissions).

A more extreme re-shaping of Oil Majors sees them incubating vast new businesses, seeding nature based solutions to climate change, then selling these CO2 credits alongside their fuels, for an additional margin. Assuming that land for reforestation is leased (not purchased outright), then a 1Mboed Oil Major might need to dedicate $400M of new capex and $4bn pa of opex to nature based solutions, representing 10% uplifts to group capex and 100% uplifts to group opex. Although this new activity would be rewarded by 5-10% unlevered IRRs at $15-35/ton commercial CO2 prices.

We conclude that a typical Oil Major can uplift its valuation by 50% through targeting net zero. This requires incurring 7.5-15% higher costs in early years. But the costs will break even, assuming $50/ton long-term CO2 prices, amidst the energy transition.

Carbon-negative plastics: a breakthrough?

Carbon negative plastics a TOTAL breakthrough

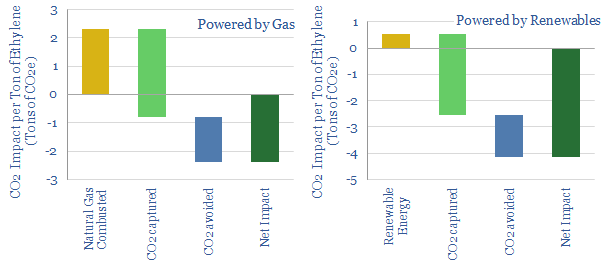
This short note describes a potential, albeit early-stage, breakthrough converting waste CO2 into polyethylene, based on a recent TOTAL patent. We estimate the process could sequester 0.8T of net CO2 per ton of polyethylene. This matters as the world consumes c140MTpa of PE, 30% of the global plastics market, whose cracking and polymerisation emits 1.6T of CO2 per ton of polyethylene.


An exciting array of companies is aiming to convert waste CO2 into materials, as part of the energy transition. We have profiled 27 leading examples in our screen, which is linked here, updated in June-2020. In the past year, we added three new companies to the list. Three companies reached full technical readiness and moved into commercialisation. The pace of progress has been strong. The companies are ranked by sector below.

The most advanced end market for CO2 is in the curing process for cement, a 4bn ton per annum industry, which accounts for 4bn tons per annum of global CO2 (8% of the total). We recently profiled Solidia’s CO2-curing process, which may eliminate 60% of the net CO2, at a c5% lower cost, and could scale up to displace 300MTpa of CO2 globally (below).

Plastics are the second largest opportunity, with 460MTpa of plastic products consumed globally. Aramco and Repsol are already commercialising polyols and polyurethanes derived from CO2, but these are only c7% of total plastics demand. The largest plastic product is polyethylene, at 140MTpa, or 30% of the total plastic market (chart below, data here). Chevron and Novomer also have technologies turning CO2 into carboxylates and acrylates, but again, these are smaller markets.

Hence, one of TOTAL’s 2019 patents stood out to us, as we reviewed 3,000 of the largest Energy Majors’ patents from last year. TOTAL has patented a group of boron-doped copper catalysts for electro-reducing CO2 into C2s, such as ethylene, which is the chemical precursor to polyethylene [1].

The process has a Faradaic efficiency of 80%. It yields two-thirds ethylene, one-third ethanol, and <0.1% C1s. This is a major advance. Pre-existing technologies are described, which have exhibited low selectivity (6-43% C1), low stability (a few hours), low activity and much lower efficiencies (27-39%).

Specifically, boron comprises 4-7% of the catalyst’s molar mass. Chemically, it draws in electrons from adjacent Cu atoms, inducing a positive charge, which lowers the activation energy for carbon-carbon bonds to form. “The invention is remarkable in that it describes the first tunable and stable Cu+ based catalyst”, the patent states.

Stability remains to be proven, and has only been shown to reach c40-hours in the trials described in TOTALโ€™s patent. This remains an obstacle for commercialisation, and we score the technologyโ€™s readiness as Level 5.

Nevertheless, it is interesting to ask “what if”. We estimate that each ton of ethylene produced from CO2 could sequester a net 0.8 tons of CO2 if the process is powered by natural gas (and 2.5T of CO2 if the process is powered by renewables).

An additional 1.6T of CO2 emissions would also be saved, because this is the typical emissions intensity of conventional production methods for cracking ethane and polymerising ethylene (chart below, data here).

TOTAL’s library of speciality chemicals patents is formidable, based on our review of patents around the energy industry, and as outlined in our recent research.

Last year, we profiled another TOTAL patent, using chromium-based catalysts to reduce defects and increase the strength of recycled plastic products (chart below, note here).

We remain excited by the pace of progress in next-generation plastic recycling, turning waste plastic back into oil. TOTAL also screens among the leaders in this area, via a new partnership with Recyling Technologies. Our screen of companies in this space was also recently updated and is linked here.


[1] Che, F., De Luna, P., Sargent, E. & Zhou, Y. (2019). Boron-Doped Copper Catalysts For Efficient Conversion Of Co2 To Multi-Carbon Hydrocarbons And Associated Methods. TOTAL Patent WO2019206882A1

Energy transition technologies: the pace of progress?

Energy Transition technologies progress

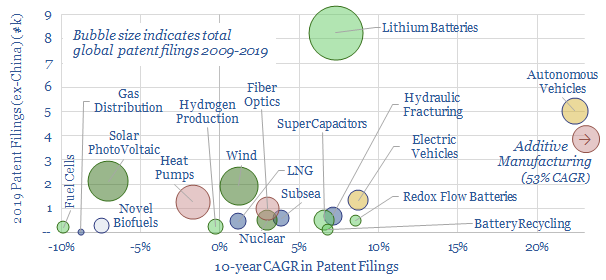
This short 3-page note summarizes 20 different TSE patent screens, to assess the pace of energy transition technologies progress. Lithium batteries are most actively researched. Autonomous vehicles and additive manufacturing technologies are accelerating fastest. Wind and solar remain heavily researched, but the technologies are maturing. The steepest deceleration of interest has been in fuel cells and biofuels. It remains interesting to compare the pace of progress within sub-industries. Our full underlying data-file behind this research paper is linked here.

Our top 4 conclusionon the pace of energy transition technologies progress  are highlighted in the article sent out to our distribution list here, including which energy technologies are the most actively researched, and which are seeing the biggest acceleration or deceleration; and to compare the pace of progress within sub-industries.

Nature based solutions to climate change: a summary

Nature based solutions to climate change

Nature based solutions to climate change are among the largest and lowest cost options to decarbonize the global energy system. Looking across 1,000 pages of our research and over 200 data files, this short note summarizes the opportunity.


Manmade CO2 emissions currently exceed 40bn tons per year, which is equivalent to 11.6bn tons of carbon. This is part of a โ€˜carbon cycleโ€™. For example, 120bn gross tons of carbon are fixed every year through photosynthesis, which naturally sequesters 2.3bn net tons of carbon from the atmosphere. Decarbonization models should consider the entire carbon cycle, to find the most economic route to reach โ€˜net zeroโ€™ CO2 by 2050, while limiting atmospheric CO2 below 450ppm (2C).  

Decarbonizing fossil fuels with nature based solutions can be much more economic than displacing them with alternatives, we find, based on all of our research, data and models into the energy transition (cost curve here).

Low costs decarbonization matters for consumers. As an example, the average developed world household currently spends $750-950 per year on heating, emitting 2.6T of CO2. No one wants to stop heating their homes. But we do want to stop the CO2 emissions. The most economic option is to use an efficient natural gas boiler, then carbon-offset the natural gas with nature based solutions. This would raise a typical household heating bill by $50 per year. Conversely, the bill would rise by $600-2,600 per year, if relying solely on renewables, biogas or hydrogen (chart below). Similarly attractive conclusions hold for decarbonized gas in the power sector.

Reforestation is the largest nature based opportunity, with potential to absorb 15bn tons of CO2 per year, across 3bn incremental acres (8% of the worldโ€™s land mass), as outlined in our recent deep-dive note. These CO2 offsets must be verified using advanced technologies and we have screened exciting companies in this space. They must also be safeguarded using corporate balance sheets, to guarantee that CO2 is genuinely offset. The costs of forest-based CO2 credits will be between $10-50/ton, in our models.

Soil restoration is the second nature based opportunity, with potential to sequester another 3-15bn tons of CO2 per year, using a growing agricultural practice called conservation agriculture. Economics can be exceptional. If CO2 credits are sold at $20/ton, the best farms would make more money farming carbon than crops. This matters as one third of the atmosphereโ€™s post-industrial CO2 derives from degradation of soil carbon. Fertilizer demand would also halve in this scenario.

The need for land is one of the largest pushbacks on nature based solutions, addressed using granular data in our recent note. Our numbers only assume forests will sequester 5T of CO2 per acre per year. But CO2 offsets can be uplifted to 15-25T per acre per year via planting faster-growing grasses, and then burying the biomass (data here). This would save 8x more CO2 per acre than present attempts to displace fossil fuels in the biofuels industry. Precision engineered proteins could also free up 485M acres in the US alone.

Another option is to push into the world’s 11bn acres of arid or semi-arid land, by irrigating deserts, possibly using desalination technology. Unfortunately, the numbers do not work in the most arid deserts, where each ton of CO2 absorbed by new trees would require >300 tons of water, cost >$500/ton of CO2 and emit >0.4 tons of CO2 (below right). An additional 100mm of rainfall-equivalents could, however, green marginal lands for $60-120/ton of CO2 costs. There is historic precedent from Israel’s Negev desert (below left). The best opportunity we can find uses produced water from the Permian basin

A final option is to extend the opportunity into oceans, which are 2.5x larger than all the world’s land. Although these methods and their consequences are less clear-cut.

None of this is to exonerate industrial companies from reducing emissions and improving their energy efficiency. Opportunities to do this remain a core focus in our research, and in our models of the energy transition.

Energy companies can uplift their margins by 15-25% by selling CO2 credits alongside their fuels to yield โ€˜decarbonized fuelsโ€™, both for oil products and for natural gas. Together with CO2 reductions and leading technologies, we find companies can uplift their valuations by 50% as they move their businesses to โ€˜net zeroโ€™.

It is fully possible to meet the world’s energy needs in 2050, even as aggregate global demand almost doubles from today’s levels, while also achieving ‘net zero’ CO2 within the confines of 450ppm. Our models foresee c90Mbpd of long-term oil demand (still equivalent to 1,000 barrels per second) and 400TCF of natural gas (3x growth on 2019 levels) in a fully decarbonized energy system.

US shale: the quick and the dead?

Top US shale companies

It is no longer possible to compete in the US shale industry without leading digital technologies. This 10-page note outlines best practices, process by process, based on 500 patents and 650 technical papers. Chevron, Conoco and ExxonMobil lead our screens. We profile where they have an edge, to capture upside in the industryโ€™s dislocation and recovery. Disconcertingly absent from the leader-board is EOG, whose long-revered technical edge may now have been eclipsed by others.

Copyright: Thunder Said Energy, 2019-2024.