Decarbonizing global energy: the route to net zero?

Decarbonizing global energy

This 18-page report revises our roadmap for the world to reach ‘net zero’ by 2050. The average cost is still $40/ton of CO2, with an upper bound of $120/ton, but this masks material mix-shifts. New opportunities are largest in efficiency gains, under-supplied commodities, power-electronics, conventional CCUS and nature-based CO2 removals.

Important note: our latest roadmap to net zero is from 2022, published here. But this note remains on our website, for transparency into our views at the end of 2021.


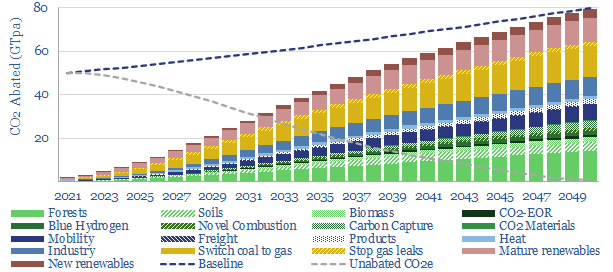
This note looks back across 750 of our research publications from 2019-21 and updates our most practical, lowest cost roadmap for the world to reach ‘net zero’. Our framework for decarbonizing 80GTpa of potential emissions in 2050 is outlined on pages 2-3.

Our updated roadmap is presented on pages 4-6. Most striking is the mix-shift. New technologies have been added at the bottom of the cost curve. Other crucial components have re-inflated. And we have also been able to tighten the ‘risking factors’ on earlier-stage technologies, thus an amazing 87% of our roadmap is not technically ready.

The resulting energy mix and costs for the global economy are spelled out on pages 7-8, including changes to our long-term forecasts for oil, gas, renewables and nuclear.

What has changed from our 2020 roadmap? A full attribution is given on pages 9-10. Disappointingly, global emissions will be 2GTpa higher than we had hoped mid-decade, as gas shortages perpetuate the use of coal.

A more detailed review of our roadmap is presented on pages 11-18. We focus on summarizing the key changes in our outlook in 2021, in a simple 1-2 page format: looking across renewables, nuclear, gas shortages, inflationary feedback loops, more efficiency gains, carbon capture and storage and nature-based carbon removals.

Solar decline rates: causes and solutions?

Causes of solar decline rates

The average solar asset declines at 2.5% per year. This 14-page note reviews the causes of solar decline rates. We find humid climates moderate Potential Induced Degradation, adding a relative headwind in coastal geographies and floating solar. But an exciting way to mitigate declines is emerging via smaller inverters.


Data into solar decline rates are presented on pages 2-3, describing how we have reached our 2.5% decline rate calculation based on 3,200 assets in the US, and plotting the average capacity factor of assets in Europe.

The impacts of solar degradation are quantified on pages 4-5, detracting from IRRs, adding to levelized costs and investment requirements. But this also creates an opportunity to understand and mitigate the declines.

What causes solar degradation? Our goal on pages 6-8 is to explain solar declines from first principles, underlining the main mechanisms of Potential Induced Degradation.

Cure by location is explored on pages 9-10. We find that humidity is a major moderating variable for solar declines. This helps the case for solar in hot, dry climates.

Cure by inverter strategy is explored on pages 11-13. Our work supports the shift from central inverters towards smaller inverters, possibly micro-inverters at utility scale. Companies covered in the report include Enphase, SolarEdge and Shoals.

Other cures, observations and conclusions into the causes of solar decline rates are laid out on page 14.

Green steel: circular reference?

green steel

Steel explains almost c10% of global CO2. Hence 2021 has seen the world’s first ‘green steel’ made using green hydrogen. Yet inflation worries us. At $7.5/kg H2, green steel would cost 2x conventional steel. In turn, doubling the global steel price would re-inflate green H2 costs by $0.5/kg. This 16-page note explores inflationary feedback loops and other options for steel-makers.


Global steel production runs at 2GTpa, comprising one of the ‘top ten’ materials made by mankind. 70% of production is from blast furnaces and basic oxygen furnaces emitting 2.4 tons of CO2 per ton of steel output. Pages 2-4 provide an overview of the industry, its production processes and their CO2 emissions.

Green hydrogen is generating excitement as an abatement option. We review pilot projects and optimistic projections from technical papers on pages 5-6.

What about the costs? We have modeled the economics of a full-scale switch to green hydrogen in a Direct Reduced Iron + Electric Arc Furnace plant configuration. We would see costs doubling, but c85-90% of the CO2 can be removed (page 7).

Inflationary feedback loops have been a recurring topic in our recent research, and steel makes an interesting case study. Steel is used in wind, solar, power distribution, batteries, hydrogen electrolysers and hydrogen storage infrastructure. So what happens to the price of green hydrogen if all of these value chain components switch to 2x more expensive green steel? We run through the results on pages 8-11, then discuss how these inflationary feedback loops might actually play on pages 12-13.

Technical challenges for the adoption of green hydrogen in the steel industry are discussed on page 14. We are skeptical of the cost-deflation promised in other studies.

Our conclusions are that there may be some niche uses for green steel, but we prefer other options for mass-scale decarbonization of the steel industry, on pages 15-16.

Is the world investing enough in energy?

Global energy investment in 2020-21

Global energy investment in 2020-21 has been running 10% below the level needed on our roadmap to net zero. Under-investment is steepest for solar, wind and gas. Under-appreciated is that each $1 dis-invested from fossil fuels must be replaced with $25 in renewables, to add the same new energy supplies. Future energy capex requirements are staggering. These are the conclusion in our 14-page note.


This 14-page note compares annual energy investment in different upstream energy sources with the amounts that would be required on our roadmap to net zero. The methodology is explained on page 2.

Current investment levels in each energy source are described on pages 3-5, reviewing the trajectory for each major category: oil, gas, coal, wind and solar. A stark contrast is found in capex per MWH of new added energy supplies.

We have constructed 120 different models, in order to stress-test the capex costs per MWH of new added energy supplies, across different resource types. Conclusions and comparisons from our modelling are presented on pages 6-8.

How much would the world need to be investing, on our roadmap to net zero, or indeed on the IEA’s roadmap to net zero? We develop our numbers, category by category, on pages 9-12, to identify where the gaps are greatest.

Conclusions and controversies are laid out on pages 13-14. Disinvestment from oil and gas will tend to exacerbate future energy shortages. To avoid this, it would be ideal to replace each dis-invested $1 of oil and gas investment with around $25 of new renewables investment.

Back-stopping renewables: the nuclear option?

Nuclear power can backstop renewables

Nuclear power can backstop much volatility in renewable-heavy grids, for costs of 15-25c/kWh. This is at least 70% less costly than large batteries or green hydrogen, but could see less wind and solar developed overall. This 13-page note reviews how flexibility in nuclear power can backstop renewables, and sees nuclear growth accelerating.


Four types of volatility in renewable-heavy grids are described on page 2 and will require a back-up.

There are limitations for batteries in hydrogen, in smoothing this volatility, as discussed on pages 3-4.

What about nuclear? An improving economic rationale is noted on pages 5-6, prompting us to re-visit the possibility of flexible nuclear plant operation.

Technical issues for maneuvering large nuclear power plants, scaling their output up and down, are laid out from first principles on pages 7-11, including minute-by-minute ramp-rates and the largest challenge, which is cold-starts.

The economics of nuclear flexibility are calculated on page 12, showing costs around 15-25c/kWh for a new Western greenfield facility, which is less than large batteries and hydrogen.

Our conclusions around how nuclear power can backstop renewables volatility – and who benefits – are summarized on page 13.

Electric motors: state of flux?

Axial flux motor technology

Motor innovations are an overlooked enabler for the electrification of transport. This 15-page note explores whether axial flux motors could come to dominate in the future. They promise 2-3x higher power densities, even versus Tesla’s world-leading PMSRMs; and 10-15x higher than clunky industrial AC induction units; while also surpassing c96% efficiencies. This extends the range of EVs and the promise of drones/aerial vehicles.


Traditional AC induction motors are described on pages 2-6, outlining how they work, their efficiency, middling reliability and typically low power density.

Electrification of transport already uses a step-change in motor design, to yield higher power density and controllability. Tesla’s PMSRM is world-leading. Details are laid out on page 7.

But a totally novel motor design is gaining ground. This is the axial flux motor, described on pages 8-11. Power density is 10x a traditional AC induction machine, efficiency is enhanced, and lower material usage may also yield important cost-savings.

Power electronics are overlooked in the revolution of electrifying transport. We note the importance of Moore’s Law on page 12, in the attempt to electrify passenger cars, two-wheelers and even aerial vehicles in the future.

Leading companies in axial flux motors are profiled on pages 13-15, based on reviewing 1,200 patents, and the technical specifications of their products. Auto-makers have started acquiring industry leaders, while earlier-stage companies are also raising capital.

Small-scale CCS: transport liquid CO2?

Liquid CO2 transport costs

CO2 has unusual physical properties, which make small-scale liquefaction and transport much more viable than we had expected. The energy burden is 70% less than other industrial gases. Total CCS costs are $50-90/ton for leading examples. This 15-page note outlines the opportunity.


Liquefying CO2 may allow smaller industrial facilities to capture and transport their CO2 to disposal sites, where permitting a pipeline is not feasible or economical. This expands the opportunity for CCS. Early proposals to do this are explored on pages 2-4.

The physics are helpful and are explained on pages 6-8. CO2’s unusual triple point means that the energy costs of CO2 liquefaction are around two-thirds lower than the heavy-duty cryogenics that are already used to liquefy almost 1GTpa of industrial gases globally.

The economics of CO2 liquefaction and transportation are laid out on pages 9-12. We have modeled a separate liquefaction plant, a convoy of CO2-carrying trucks, and larger liquid CO2-carrying ships. Including capex, energy and CO2 costs.

The main operational hurdles are described on page 13. We have reflected additional safety measures and staff training costs in our models as a consequence.

Who benefits? The opportunity is summarized on pages 14-15. The most ambitious project to-date will see Aemetis capture around 2MTpa of CO2 for disposal in California’s Central Valley, where the LCFS could yield $250/ton revenues.

Electric motors: variable star?

Variable frequency drives energy transition

Variable frequency drives precisely control motors. Amazingly they could reduce global electricity demand by c10%. We expect a sharp acceleration due to sustained energy shortages, increasingly renewable-heavy grids and excellent 20-50% IRRs. Hence this 14-page note reviews the opportunity and who benefits.


There are 50bn electric motors in the world consuming half of all global electricity. They are inefficient because their speed is determined principally by the frequency of the AC power grid. The physics and electronics of this inefficiency are outlined on pages 2-4.

Variable frequency drives use similar power-electronics technology as the renewables revolution, to precisely control electric motors, ensuring they do not run faster than is needed. We outline how they work and case studies of their energy savings on pages 5-7.

Excellent economics are laid out on pages 8-10. We see IRRs in the range of 20-50% and payback periods in the range of 1-5 years, depending on power prices and CO2 prices.

Improved resiliency in renewable-heavy grids is a further advantage, protecting against voltage sags, lack of inertia, trips and motor degradation. There may even be an opportunity for demand shifting. These issues are explored on pages 11-12.

Leading companies are described on pages 13-14, including their market shares, proportionate concentration to the theme and product offerings.

Carbon capture: how big is the opportunity?

US CCS potential MTpa

This 13-page note aims to quantify the upside case for CCS in the United States, using economics, top-down and bottom-up calculations. Our conclusion is that a clear, $100/ton incentive could help CCS scale by c25x, accelerating over 500MTpa of projects in the next decade, which could prevent almost 10% of the US’s current CO2 emissions. Our numbers include blue hydrogen and next-gen CCS.


Current CCS incentives are not sufficient for hard-to-abate sectors in the US, within the <$50/ton confines of the 45Q tax credit (page 2).

Although CCS technology is mature, c$100/ton incentives are needed to kick-start the industry. The economics are built-up on pages 3-7.

Top-down market-sizing is based on the oil and gas industry, which has extracted 900MTpa of hydrocarbons from sub-surface reservoirs, on average in the past 40-years. We discuss possible future CCS volumes relative to this baseline on page 8.

Bottom-up market sizing looks industry-by-industry, to break down possible capture volumes. We discuss each industry in turn – coal power, gas power, ethanol, steel, cement, et al., – on pages 9-12.

Blue hydrogen remains particularly exciting, for the decarbonization of smaller industrial facilities that may need to share infrastructure (page 13).

Insulating materials: deliver us from gas shortages?

Investing in insulation companies

Insulating materials can slow the loss of heat from a warm house by a factor of 30-100x. This matters as 60-90% of today’s global housing stock is 30-70% under-insulated. And the world is now grappling with gas shortages, which may encourage policymakers to re-prioritize nearer-term energy savings. We think renovation rates could treble. This 12-page note screens who might benefit.


Shortfalls in the European gas market are discussed on page 2. A 20% improvement in home insulation could free up the equivalent of all pipelines imports from Algeria.

The thermodynamics of home insulation are laid out on pages 3-4, explaining the W/m.K metric, why it matters, and scoring different materials.

The scale of the opportunity is larger than we thought, based on a dozen technical papers, reviewed and summarized on pages 5-6, in order to quantify potential energy and CO2 savings.

CO2 abatement costs will generally be below $100/ton, we calculate, especially amidst energy shortages. Economic assumptions and calculations are on pages 7-9.

Leading companies that produce insulating materials are screened on pages 10-11, in order to identify who might help supply a potential trebling of materials demand.

An interesting nuance, discussed on page 12, is how better insulation would re-shape the cost curve for decarbonizing home heat, in favor of nature-based solutions, gas and hydrogen; but potentially away from heat pumps and other electrification technologies.

Copyright: Thunder Said Energy, 2019-2024.