-
Global CCS Projects Database

Over 400 CCS projects are tracked in our global CCS projects database. The average project is 2MTpa in size, with capex of $800/Tpa. The largest CO2 sources are hubs, gas processing, blue hydrogen, gas power and coal power. The most active countries are the US, UK, Canada and Europe. However, slow project progress in 2025…
-
Power cuts: how frequent are grid disruptions?

This data-file aggregates significant US power grid disruptions, based on data from the DOE. On average, there are 250 power cuts per year in the United States, lasting for a median average of 5-hours, and affecting a median average of 80,000 customers. 20% of the power cuts last longer than 1-day. 15% affect more than…
-
Industrial heat: can heat pumps compete?
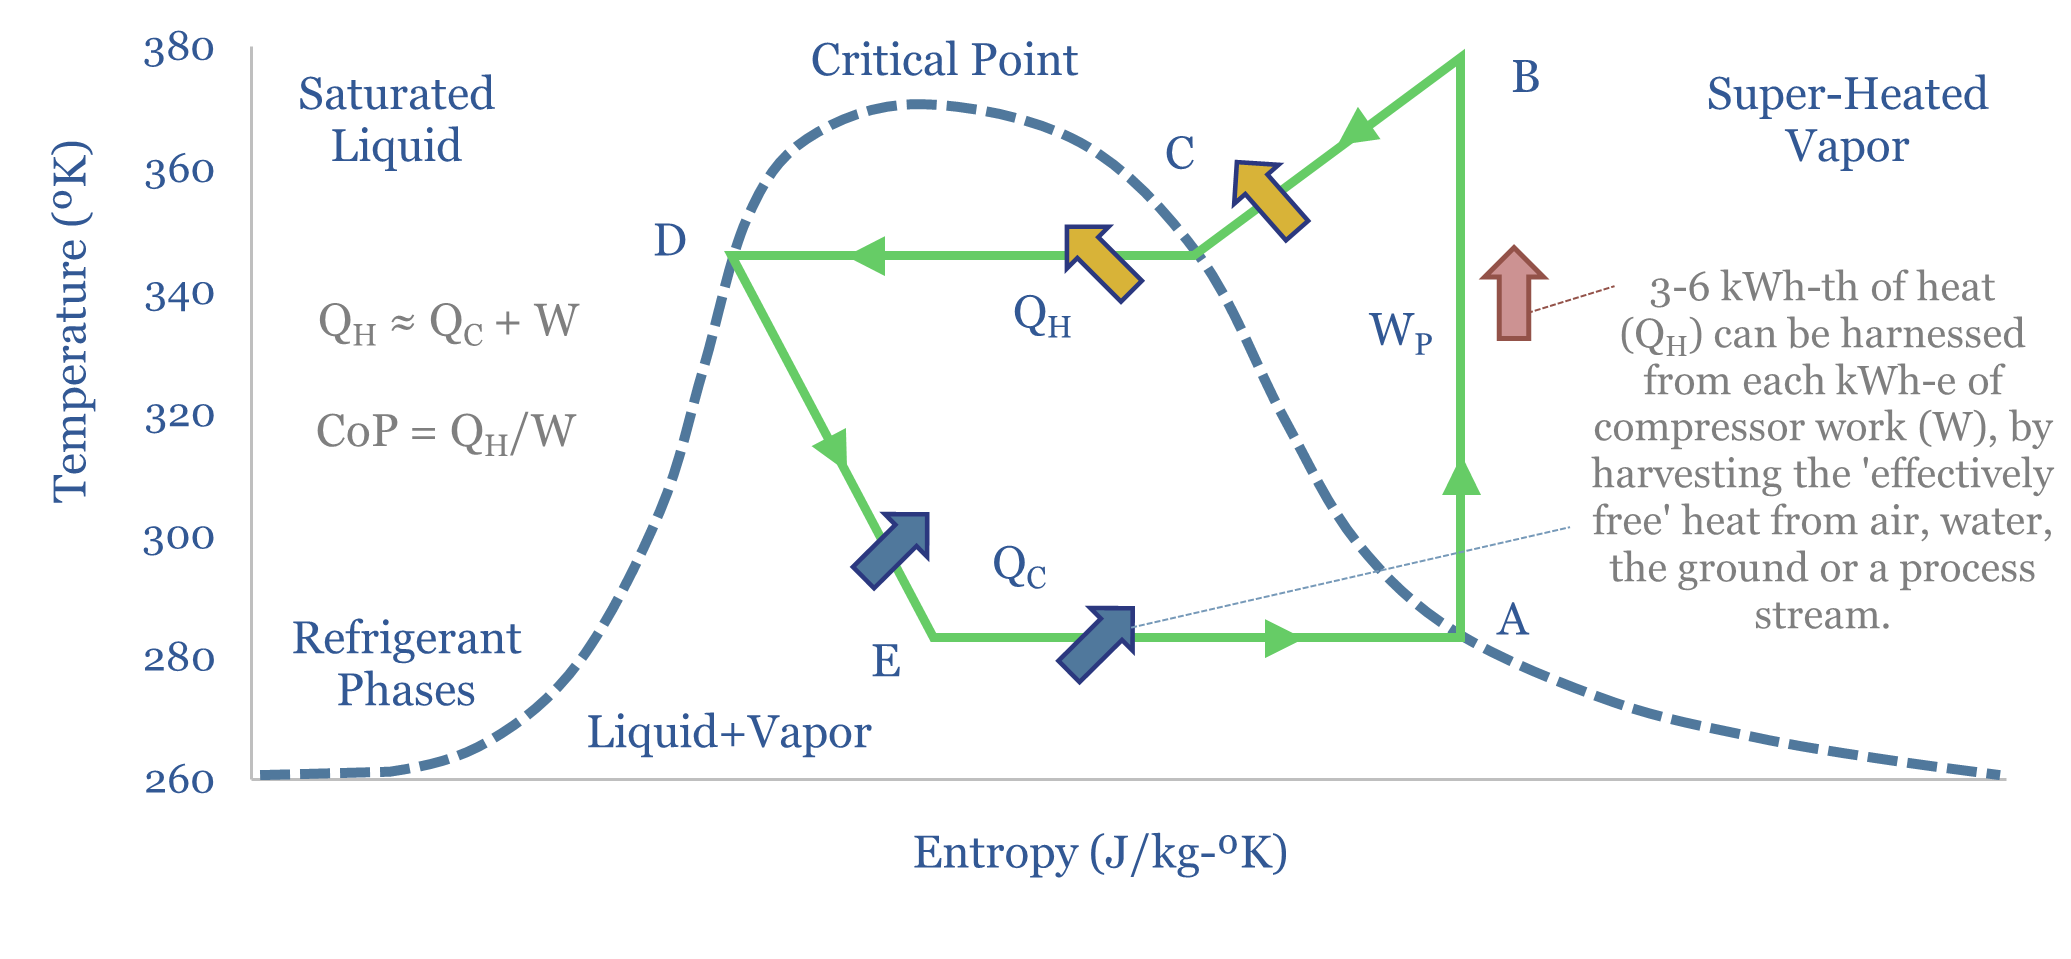
Could industrial heat pumps accelerate, especially due to excess renewables, thereby stoking load growth, and displacing natural gas? This 14-page report finds the economics are more challenging than expected. Heat pumps fare best in specific contexts. Load growth mainly hinges on AI.
-
Gas turbine manufacturing by company by facility?
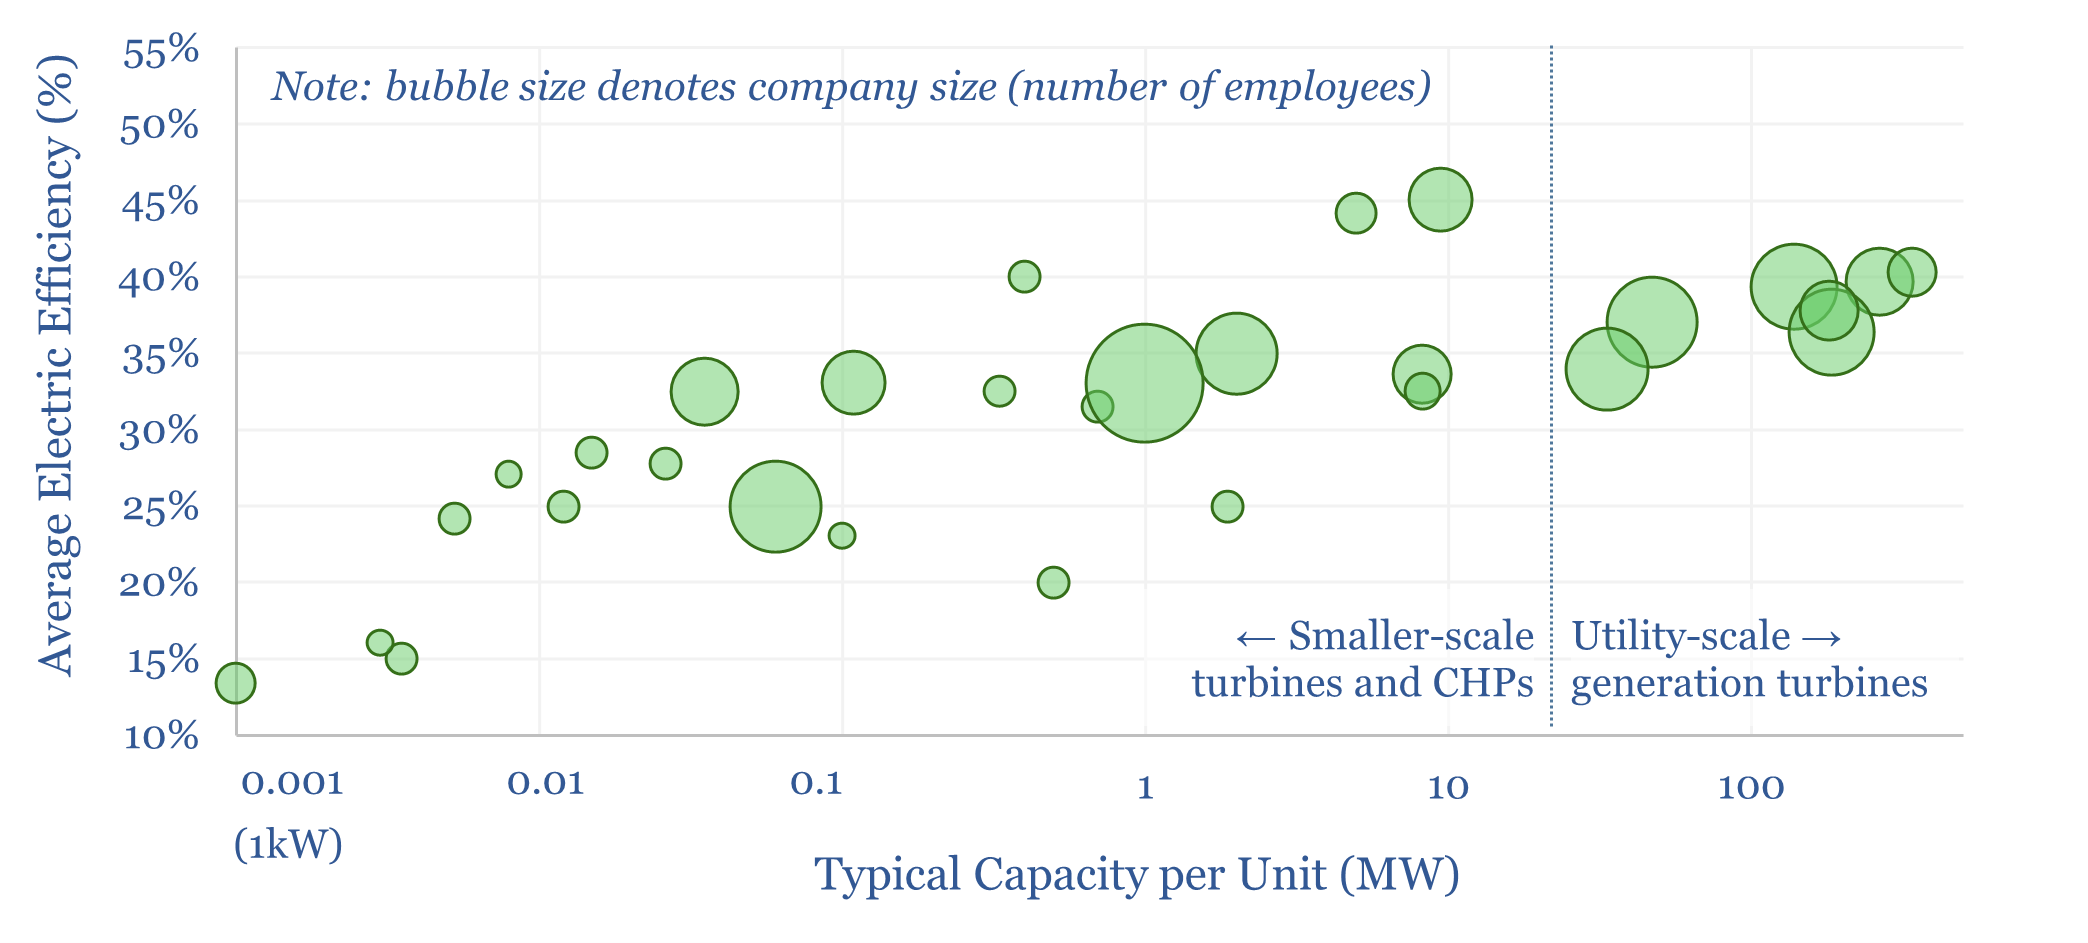
This data-file profiles gas turbines and gas turbine manufacturing capacity by company. 30 companies are profiled, including the ‘big three’ – GE Vernova, Siemens Energy and Mitsubishi Heavy. 100 gas turbines are profiles. And 25 gas turbine manufacturing facilities are also covered, in order to estimate gas turbine manufacturing capacity by region and by company.
-
Global lithium production: by project, by country, by resource?

Global lithium production, by project, by country, by resource type, and over time, are aggregated in this data-file, by tabulating details of each project. There is spare capacity in 2026, especially from Australian mine projects, but the current project pipeline sugggests a 20-30% market deficit in 2030-35.
-
Oil project developments: by region over time?
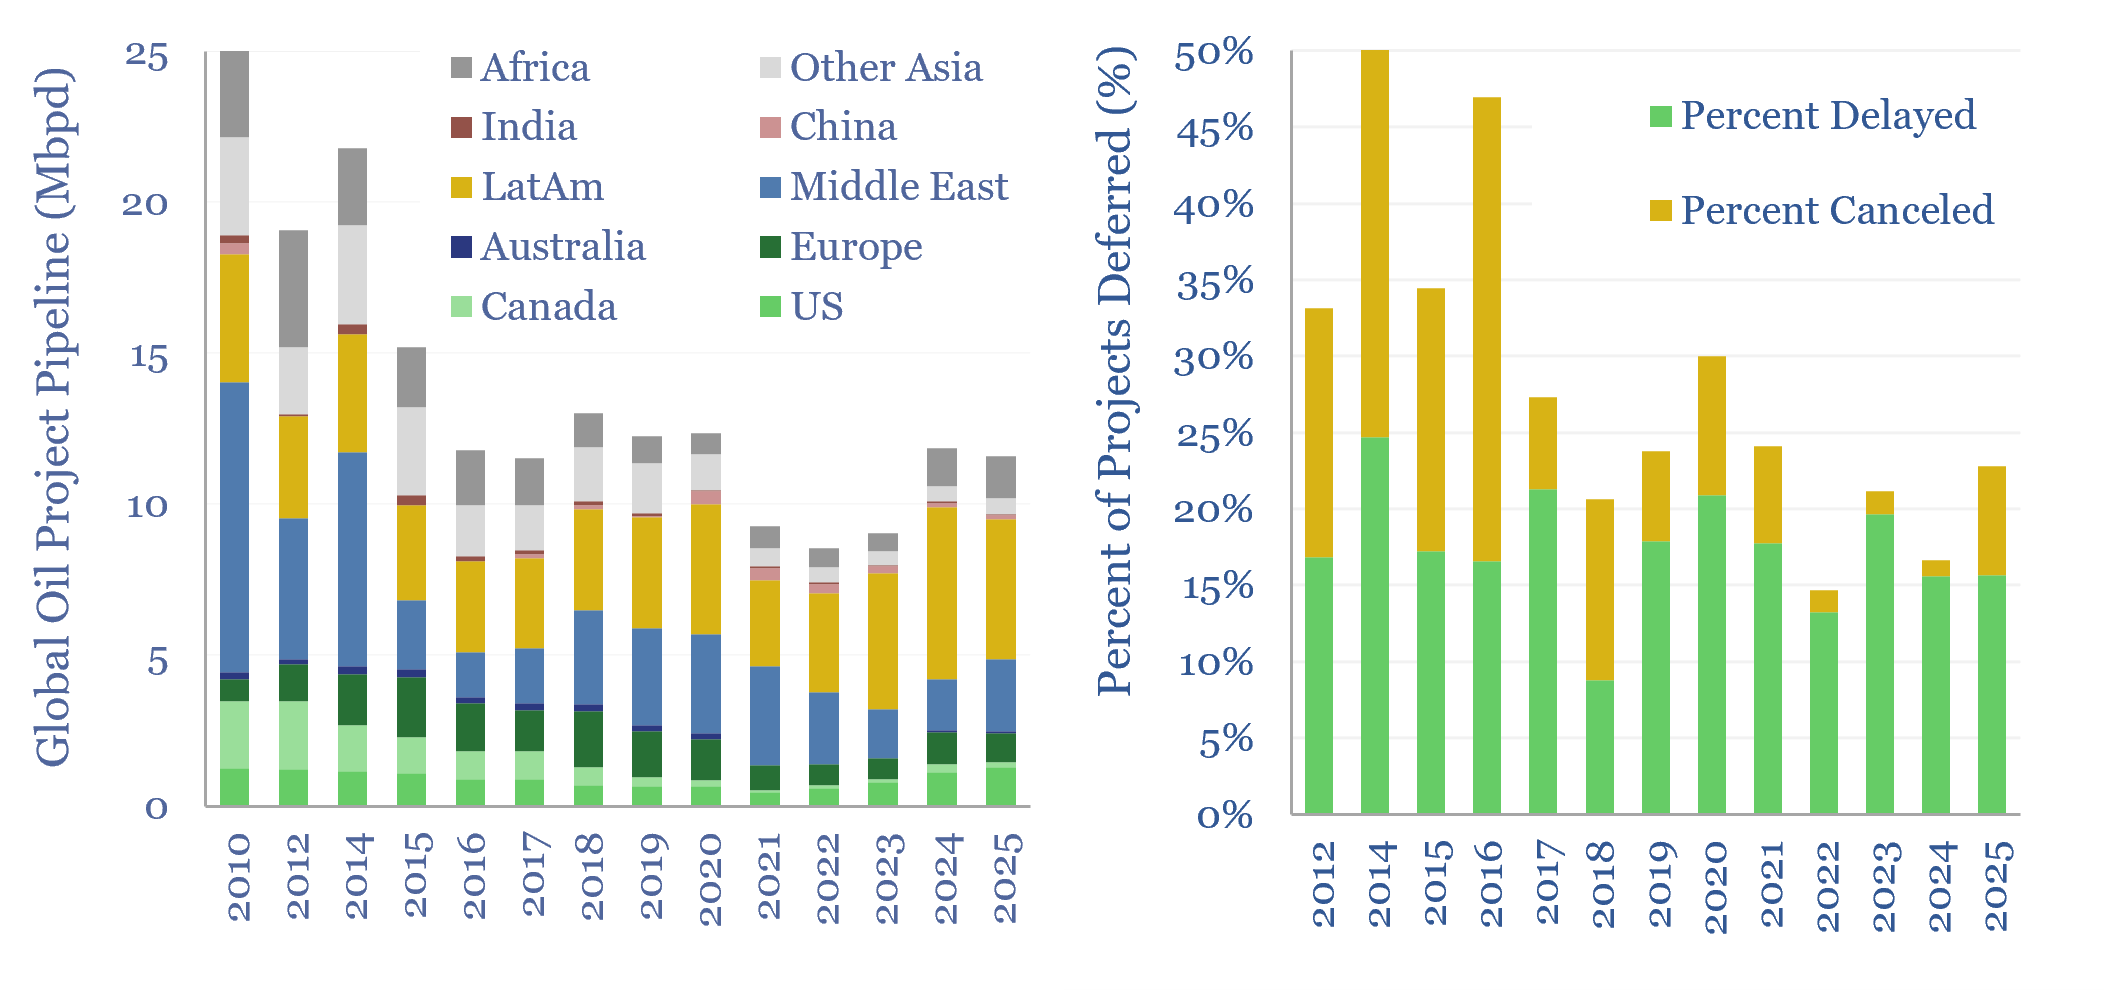
This data-file tracks conventional oil projects, by region, by development type, and over time. Over 10Mbpd of conventional oil projects are currently under development in 2025, representing $500bn of capex. What does this mean for oil markets?
-
Copper: the economics?
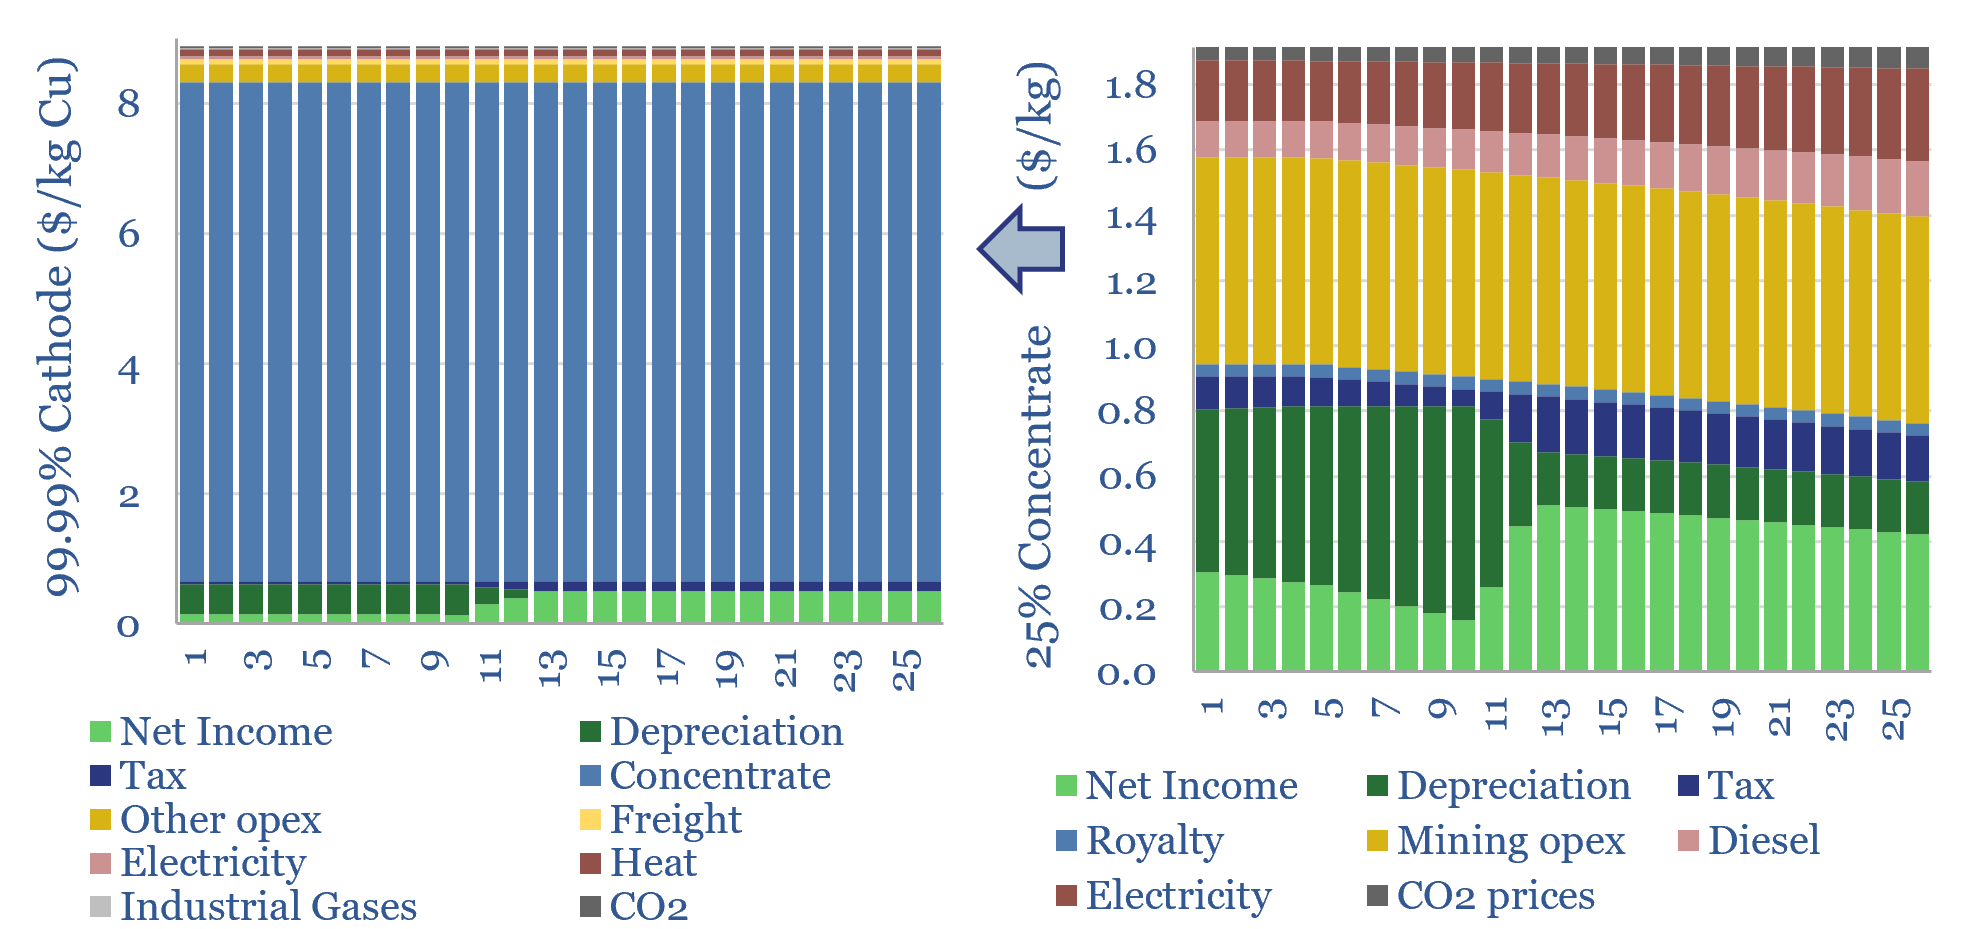
The economic cost of copper production is built up from first principles in this model, from mine, to concentrator, to smelter to 99.99% pure copper cathodes. Our base case is $9/kg copper cathode, for a 10% IRR, with 4 tons/ton CO2 intensity, after starting from an 0.45% ore grade. But higher IRRs may be needed…
-
Australia energy supply-demand model?
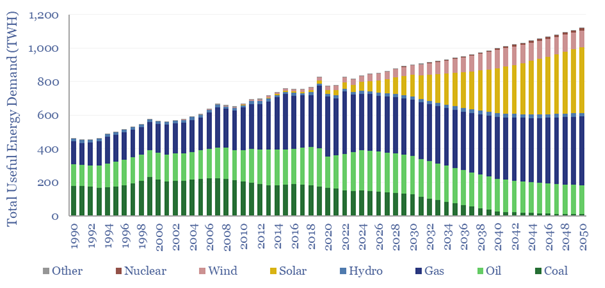
Australia’s useful energy consumption rises from 820TWH pa in 2023, by 1.2% pa 1,100 TWH pa in 2050. As a world-leader in renewables, it makes for an interesting case study. This Australia energy supply-demand model is disaggreated across 215 line items, broken down by source, by use, from 1990 to 2023, and with our forecasts…
-
Power markets: classical economics?

This 15-page report outlines how wholesale power markets work, which helps to understand four emerging controversies. Wholesale power prices are governed by classic microeconomics: day-ahead markets clear at the intersection of downward sloping demand curves and upward sloping supply curves.
-
Electricity pricing: time-of-use tariffs by region?

Time-of-use tariffs mean end customers’ electricity prices are not fixed, but vary across time. ToU tariffs can reduce peak power demand by 10% on average. This data-file tracks the share of customers with time-of-use tariffs, by region, and then focuses in on interesting countries.
Content by Category
- Batteries (96)
- Biofuels (44)
- Carbon Intensity (48)
- CCS (64)
- CO2 Removals (9)
- Coal (41)
- Commentary (65)
- Company Diligence (104)
- Data Models (922)
- Decarbonization (162)
- Demand (129)
- Digital (86)
- Downstream (47)
- Economic Model (221)
- Energy Efficiency (76)
- Hydrogen (63)
- Industry Data (308)
- LNG (56)
- Materials (86)
- Metals (88)
- Midstream (45)
- Natural Gas (161)
- Nature (76)
- Nuclear (28)
- Oil (176)
- Patents (39)
- Plastics (44)
- Power Grids (156)
- Renewables (153)
- Screen (137)
- Semiconductors (35)
- Shale (58)
- Solar (72)
- Supply-Demand (53)
- Vehicles (95)
- Video (24)
- Wind (47)
- Written Research (407)