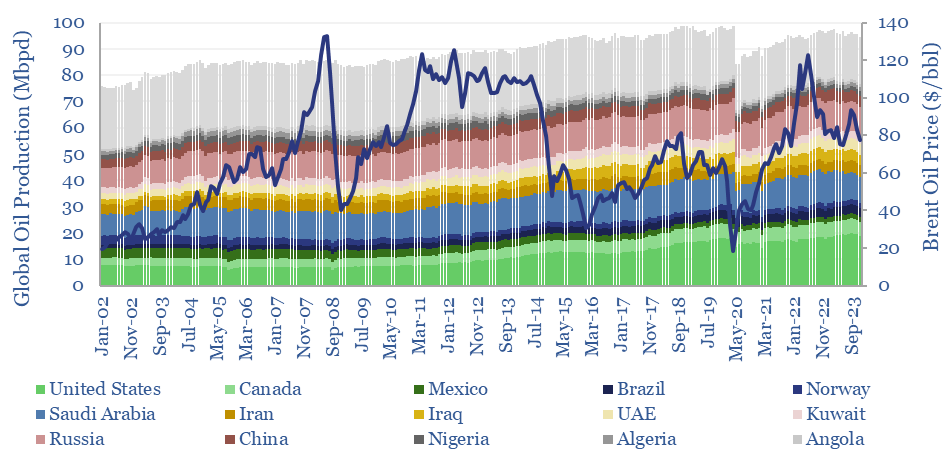
Global oil production by country by month is aggregated across 35 countries that produce >80kbpd of crude, NGLs and condensate, explaining >96% of the global oil market. Production has grown by almost +1Mbpd/year over the past two-decades, led by the US, Iraq, Russia, Canada. Oil market volatility is usually very low, at +/- 1.5% per year, of which two-thirds is down to conscious decisions over production levels.
Monthly global oil production by country is aggregated in this data-file, aggregating data from JODI, the International Energy Agency, the Energy Institute and individual countries’ national hydrocarbon registries, then extensively scrubbing and cleaning the data. This gives us month-by-month visibility on about 97% of the global oil market.
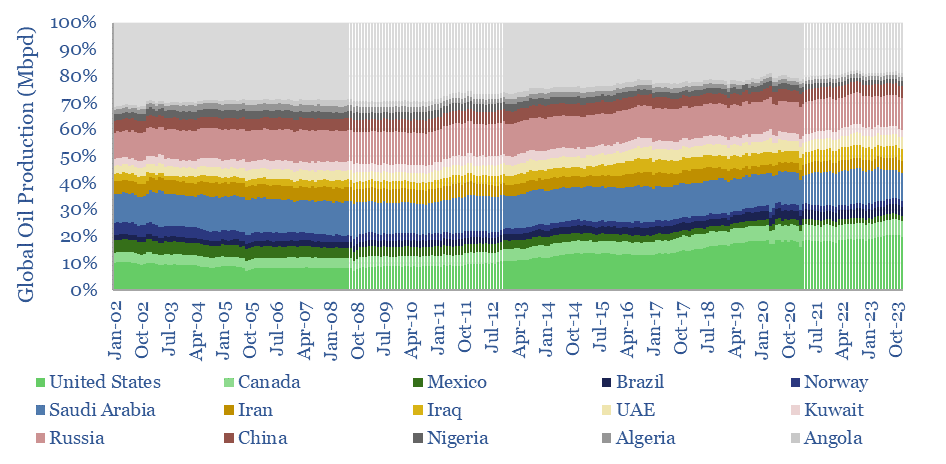
In particular, the data cover 35 countries with over 80kbpd of production (crude, NGL and condensate), which comprise 96% of the global oil market. Of this sample, 25 countries with over 600kbpd of production comprise 93% of the global oil market; 10 countries with over 2.5Mbpd of production comprise 75% of the global oil market; and 4 countries with over 5Mbpd of production comprise 50% of the global oil market (the United States, Saudi Arabia, Russia and Canada).
Global oil production has grown by almost +1Mbpd per annum over the past 20-years, matching the trend in global oil demand by country.
The largest increases in oil production have come from the United States (+0.6Mbpd/year, due to US shale growth), Iraq (>0.1Mbpd/yr), Russia (>0.1Mbpd), Canada (>0.1Mbpd), Brazil (0.1Mbpd), UAE (<0.1Mbpd), Saudi Arabia (<0.1Mbpd), Kazakhstan (<0.1Mbpd).
Conversely, the largest declines in oil production by country have come from Venezuela, Mexico, the UK, Norway (all <0.1Mbpd/year).
The volatility of global oil markets is low compared to new energies. Across the 20-year period from 2003-2023, the standard deviation of YoY monthly oil production is 3Mbpd, for a standard error of 3.4%. However, excluding the volatility during the COVID-19 pandemic from 2020 onwards, the standard deviation of YoY monthly oil production is 1.8Mbpd, for a standard error of 2%. And after smoothing out over a TTM basis, this falls even further to 1.2Mbpd, for a 1.5% standard error.
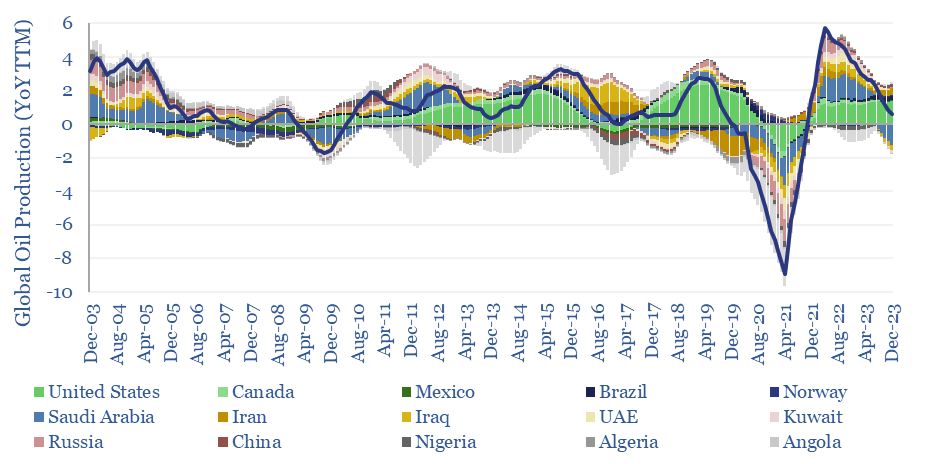
Volatility or voluntary? Countries such as Saudi Arabia, Kuwait, UAE, the US, Canada and Russia very clearly adapt their growth/output to market pricing signals, which actually dampens down supply volatility. Countries with the highest volatility in their production are Libya (standard error of +/- 35% of average output, on a TTM basis), Iran, Iraq, Venezuela and Nigeria (all around +/- 10%). Full details in the data-file.