Search results for: “agricultural food”
-
World food production: energy breakdown by crop by country?
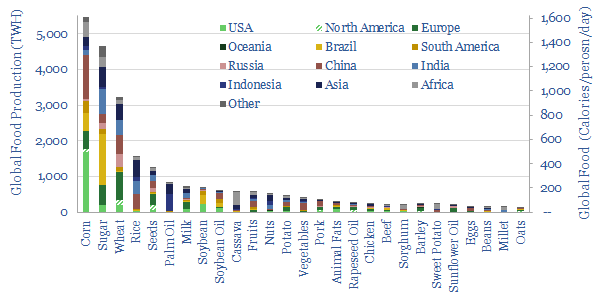
World food production runs at 10 bn tons per year, equivalent to 25,000 TWH of primary energy, or 7,500 calories per person per day. Of this total, 30% is fed to animals, 30% is wasted, 5% is converted to biofuels and 2% is used in consumer products. Humans eat the remaining 2,500 calories per person…
-
Tree crops: financial and agricultural yields?
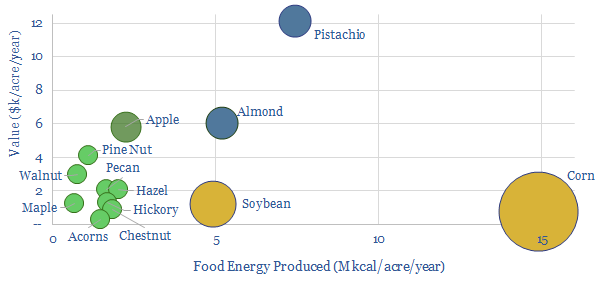
This data-file compiles the estimated calorific and financial yields of tree crops versus conventional crops such as corn and soybean. Tree crops absorb more CO2 and have strong economic potential. Value is 2x higher than conventional agriculture although calorific yields may be 50-90% lower.
-
Oil crops: the economics?
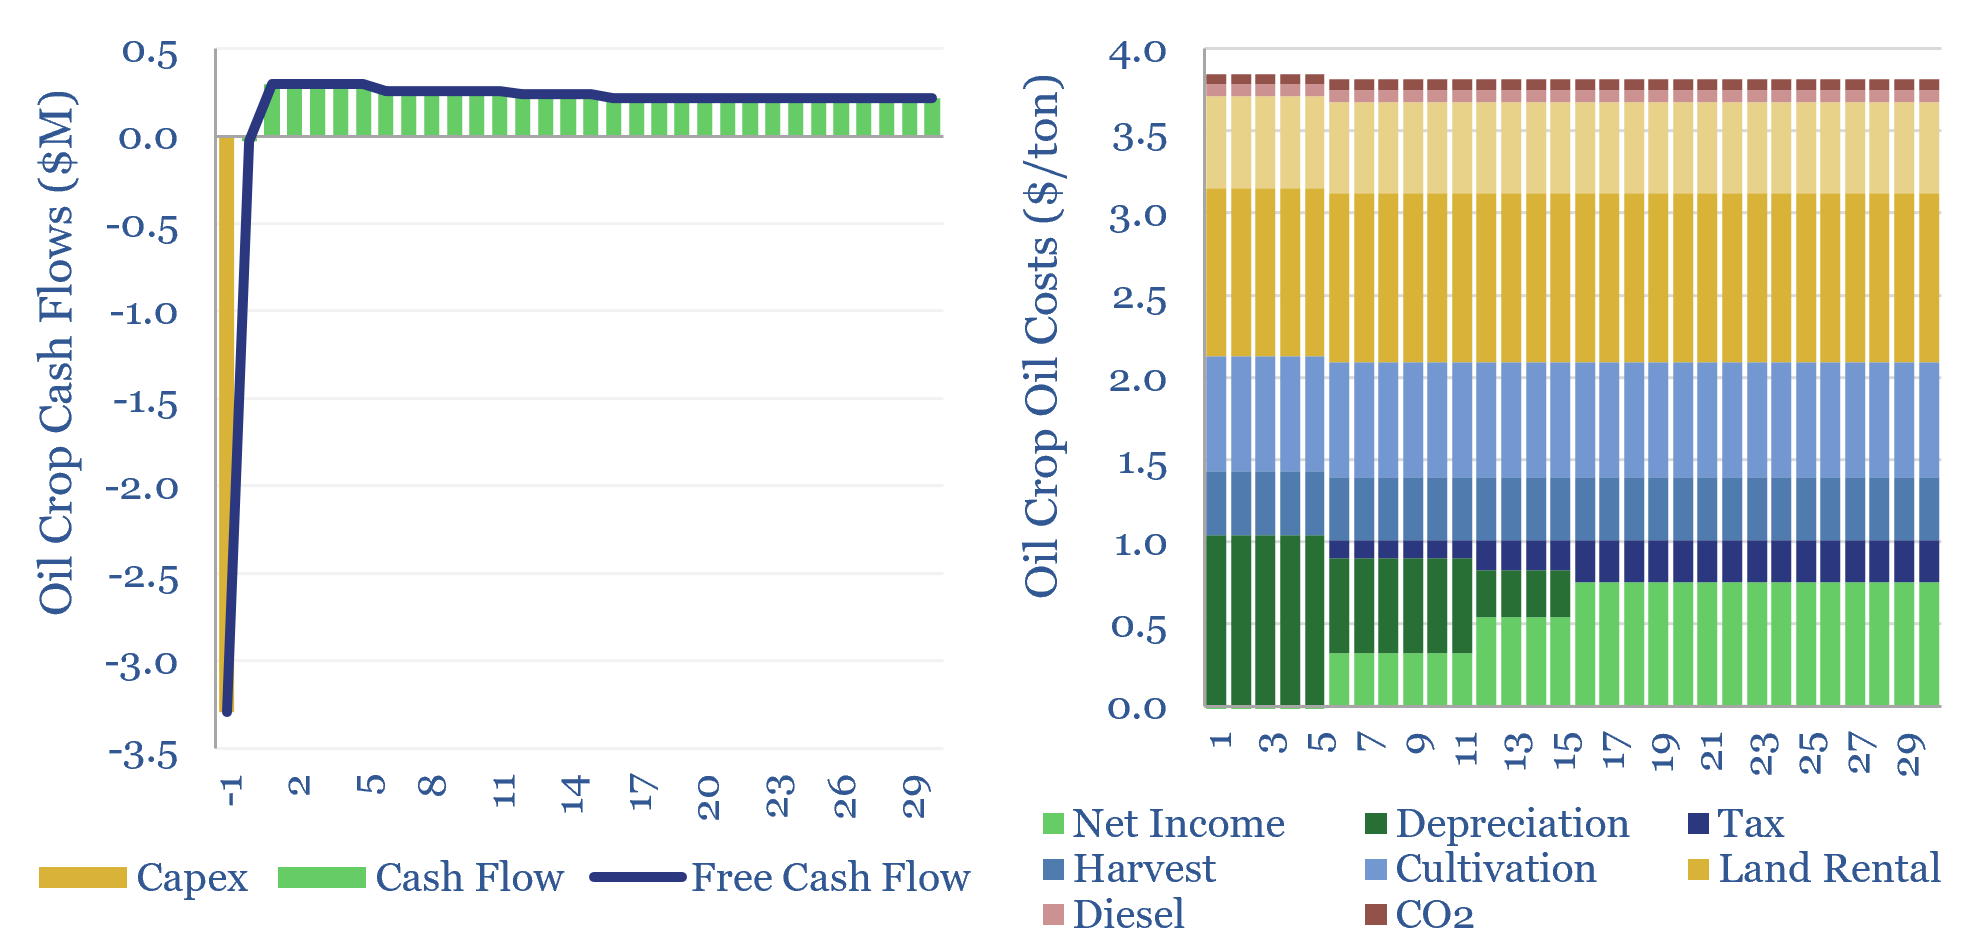
The costs of oil crops, a crucial input for bio-diesel and SAF, will usually range from $900-1,200/ton, in order to generate acceptable 6-15% IRRs for producers. This translates into $3-4/gallon in feedstock costs. These oil crops also likely embed over 2 kg/gallon of CO2 intensity. The economics of oil crops can be stress-tested in this…
-
Biotech companies to enhance agricultural yields or CO2 uptake?
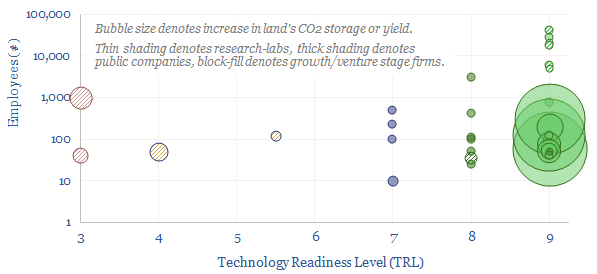
This screen tracks companies that can improve productivity of agricultural land (so more land is available for reforestation) or increase CO2 uptake rates of plants. It includes large-cap seed and crop protection companies, through to biotech firms, through to indoor farms that achieve 350-400x higher yields per acre.
-
Crop production: what CO2 intensity?
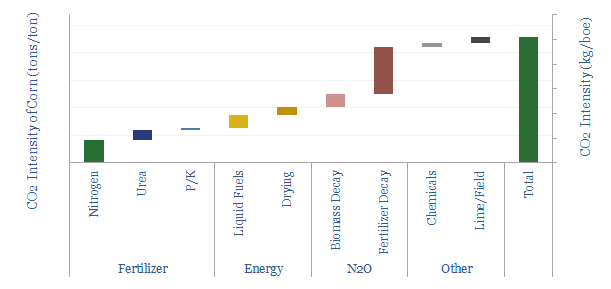
The CO2 intensity of producing corn averages 0.23 tons/ton, or 75kg/boe. 50% is from N2O emissions, a powerful greenhouse gas, from the breakdown of nitrogen fertilizer. Producing 1 kWh of food energy requires 9 kWh of fossil energy.
-
Revolutions and upheavals: are energy shortages a cause?
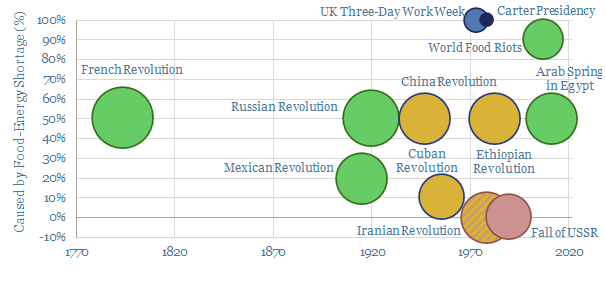
This data-file aims to assess whether spiking food and energy prices lead to political changes. There is a >70% chance of regime change at the next election, after food and energy prices have spiked. Links with outright revolutions are looser.
-
Restoring soil carbon: the economics?
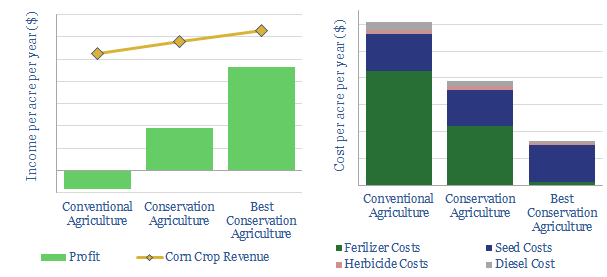
We model the economics for conservation agriculture to restore soil carbon. 5-30T of CO2 can be sequestered per acre per year, while deflating farm costs by 36-73% and raising yields 10-20%. This would transform crop-growing economics from marginal to material.
-
Capital goods market sizes: by category, by country?
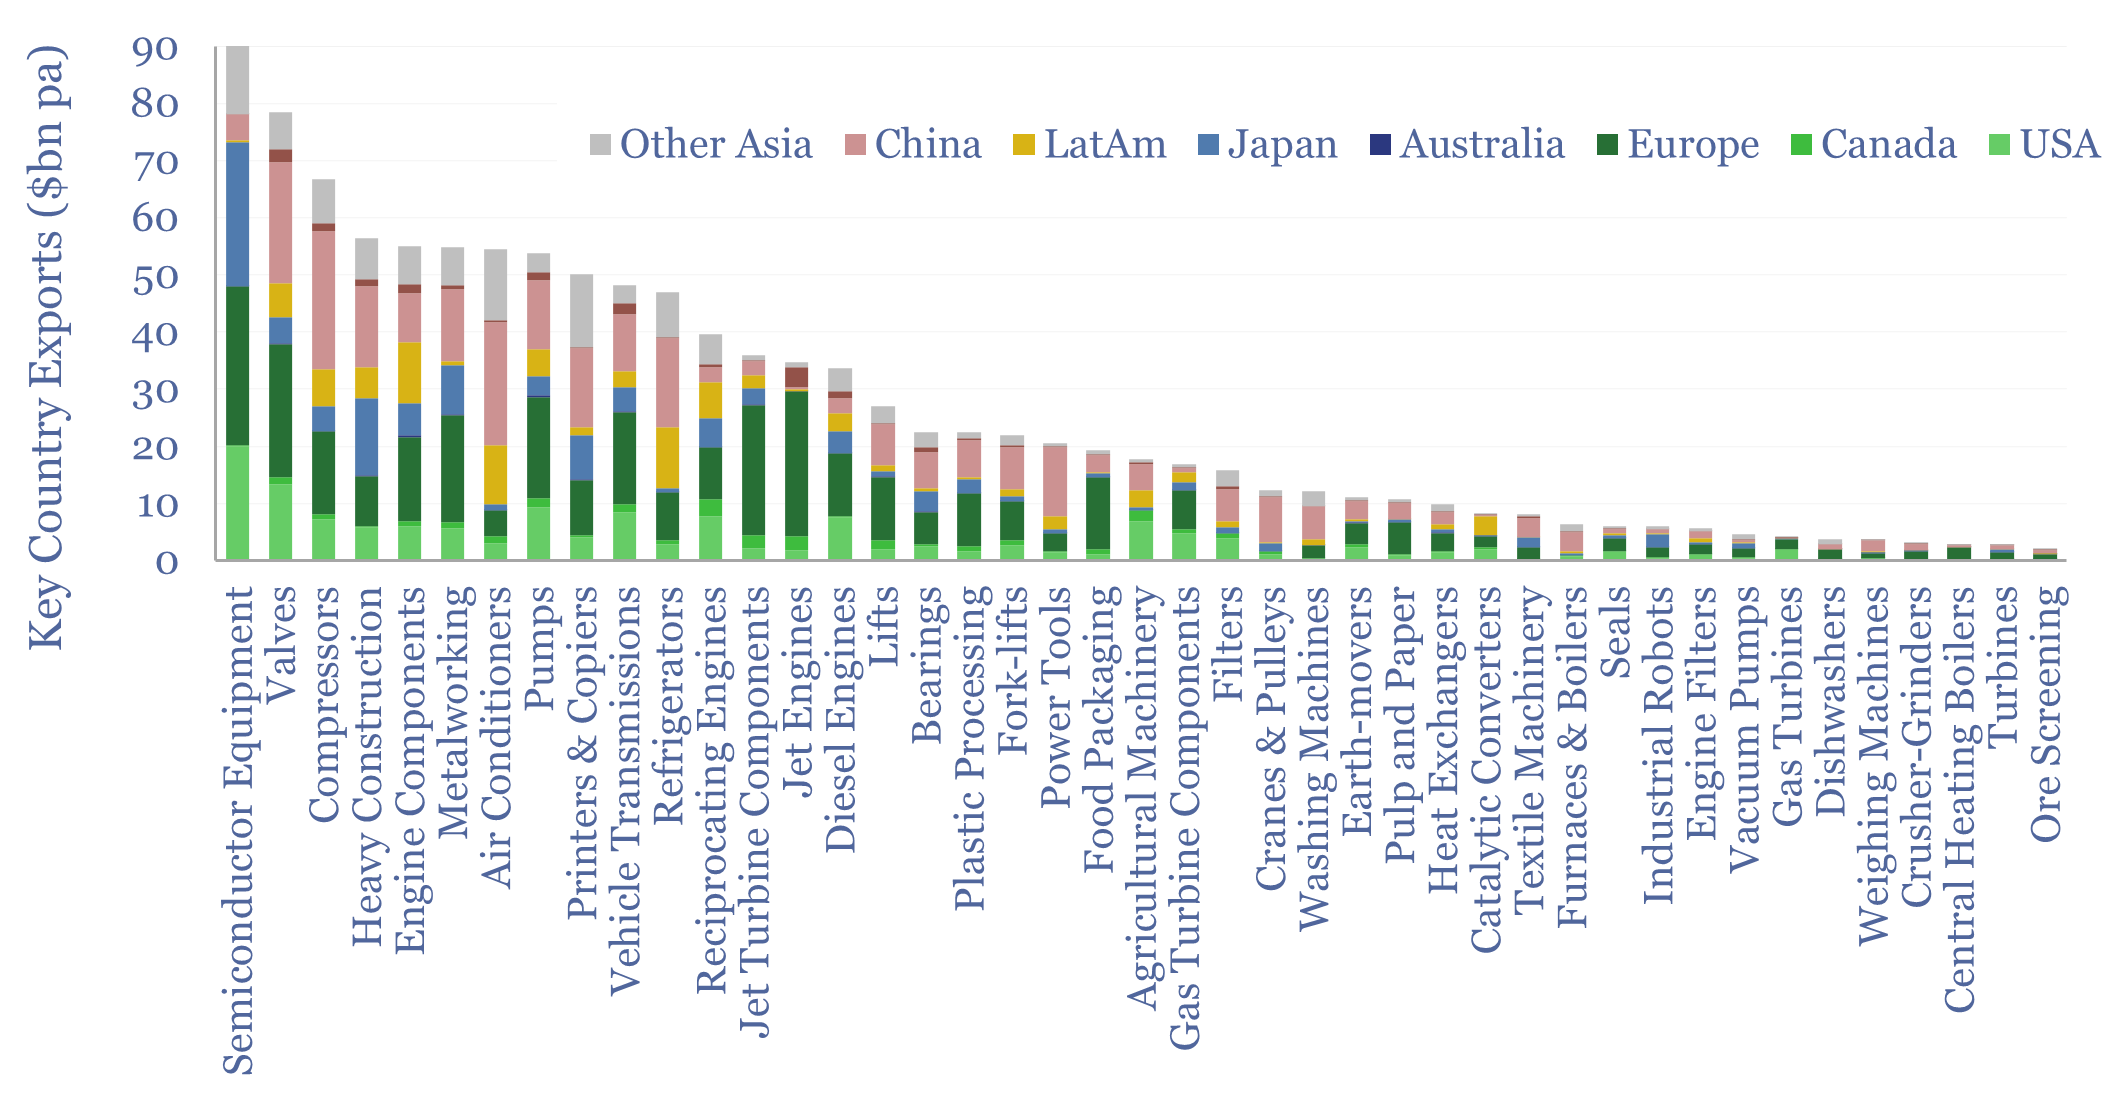
This data-file tabulates globally traded capital goods market sizes, based on the values of products exported from different countries-regions. Specifically, commodity Code 84 represents machinery and mechanical appliances, worth $2.5trn pa in 2023. About half of that represents classic capital goods categories, as decomposed in the chart above. Our top five conclusions follow below.
-
Global commodity trade: by product by region?
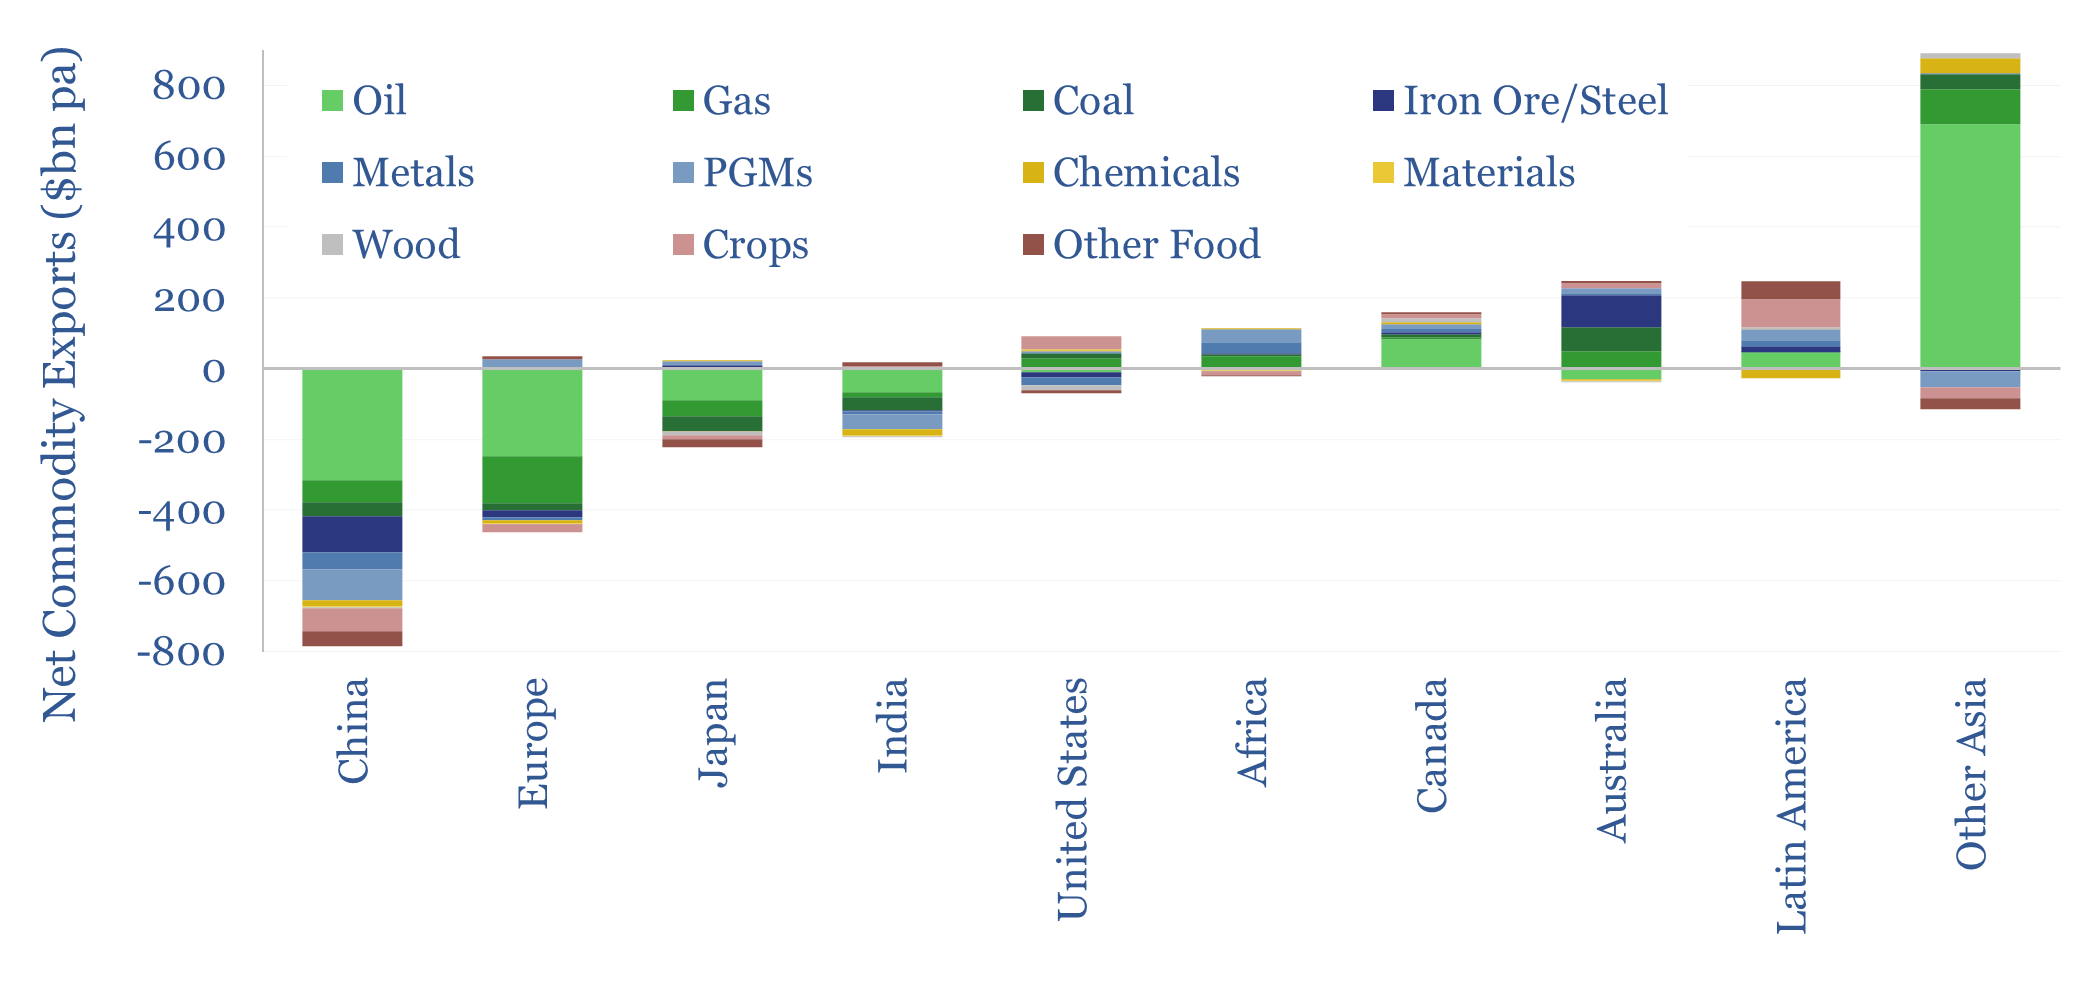
Commodities comprise over $6trn of of the world’s $33trn pa in global trade, or around 20%, alongside $10trn in services, $2trn of electronic goods, $1trn in cars, $1trn in mechanical capital goods. This data-file breaks down global commodity imports and exports, by country and by region.
-
Biomass accumulation: CO2 fixed by trees and energy crops?
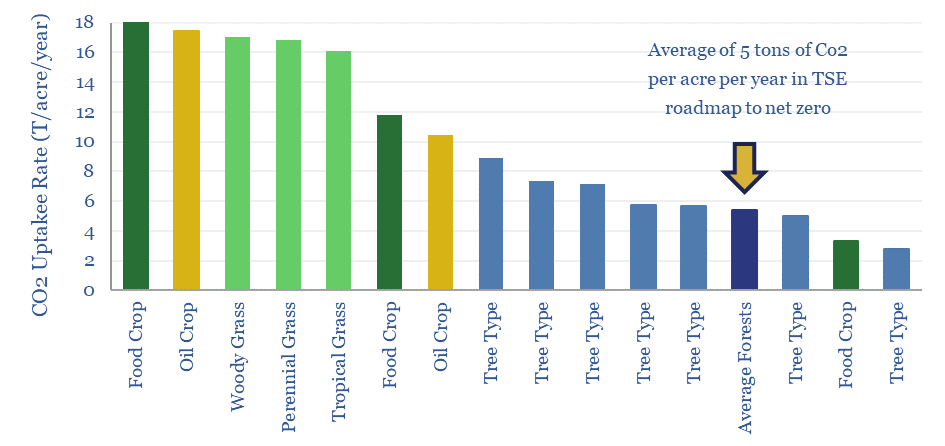
Different plant species fix 3-30 tons of CO2 per acre per year, as they accumulate biomass at 2-40 tons per hectare per year. The numbers matter for biofuels and for nature-based solutions. Hence this data-file compiles technical data into CO2 and biomass accumulation by plant species and by tree species, in different regions globally.
Content by Category
- Batteries (89)
- Biofuels (44)
- Carbon Intensity (49)
- CCS (63)
- CO2 Removals (9)
- Coal (38)
- Company Diligence (95)
- Data Models (840)
- Decarbonization (160)
- Demand (110)
- Digital (60)
- Downstream (44)
- Economic Model (205)
- Energy Efficiency (75)
- Hydrogen (63)
- Industry Data (279)
- LNG (48)
- Materials (82)
- Metals (80)
- Midstream (43)
- Natural Gas (149)
- Nature (76)
- Nuclear (23)
- Oil (164)
- Patents (38)
- Plastics (44)
- Power Grids (130)
- Renewables (149)
- Screen (117)
- Semiconductors (32)
- Shale (51)
- Solar (68)
- Supply-Demand (45)
- Vehicles (90)
- Wind (44)
- Written Research (354)