
This data-file is a screen of Canadian upstream companies and Canadian shale producers, especially focused on the fast-growing Montney-Duvernay shale plays. Key themes are rising shale oil and gas production, low-capex wells, high well-level IRRs, performance improvements and consolidation via M&A.
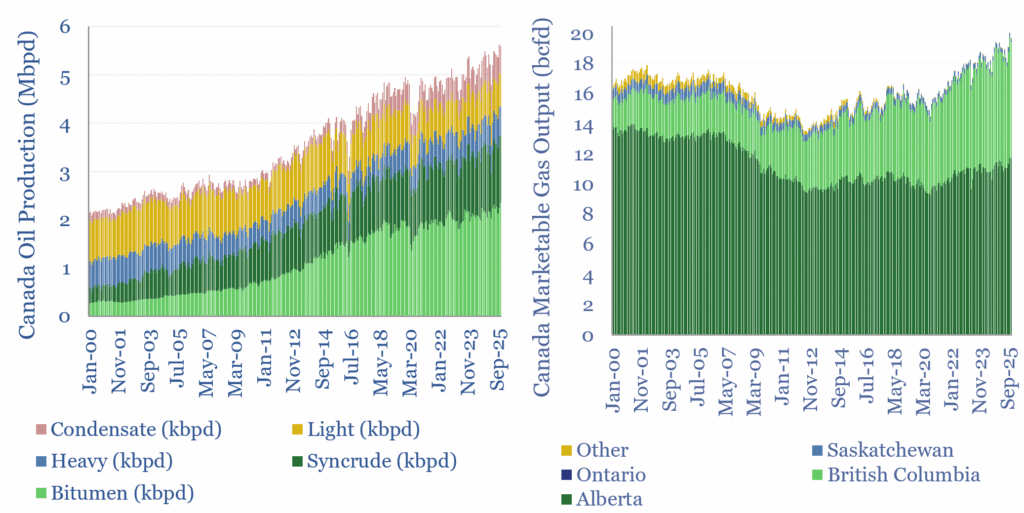
Canadian oil production averaged 5.3Mbpd in 2025 and gas production averaged 19bcfd. Oil sands production is still slowly growing, rising, +140kbpd YoY, while light crude and condensate associated with shale plays rose by +50kbpd YoY. Gas production rose by +400mmcfd in the shale basins of Alberta and +300mmcfd in British Columbia. The data-file contains a breakdown by product and by region (charts below).
Canadian shale production is increasingly interesting to us, due to the ramp-up of Canadian LNG export options, a growing focus on unleashing Canadian resources, and the size and scale of the resource. In our survey of global shale basins, we estimate the US has produced 11% of its total shale resources, while Canada has only produced 3%.
Canadian shale producers are also increasingly interesting to energy acquirers. Shell agreed to acquire ARC Resources in April-2026, for $16.4bn. Whitecap and Veren merged in 2025 in a $15bn transaction. Ovintiv expanded its Montney footprint in 2025, by acquiring NuVista for $2.7bn.
Hence we have screened Canadian shale producers and other upstream companies in this data-file. Growing production for a subset of half-a-dozen relatively pure-play shale E&Ps, focused on the Montney and Duvernay, are shown below-left. Their production is 35% liquids, 65% gas. A cost breakdown of Canadian shale production is also aggregated from company disclosures.
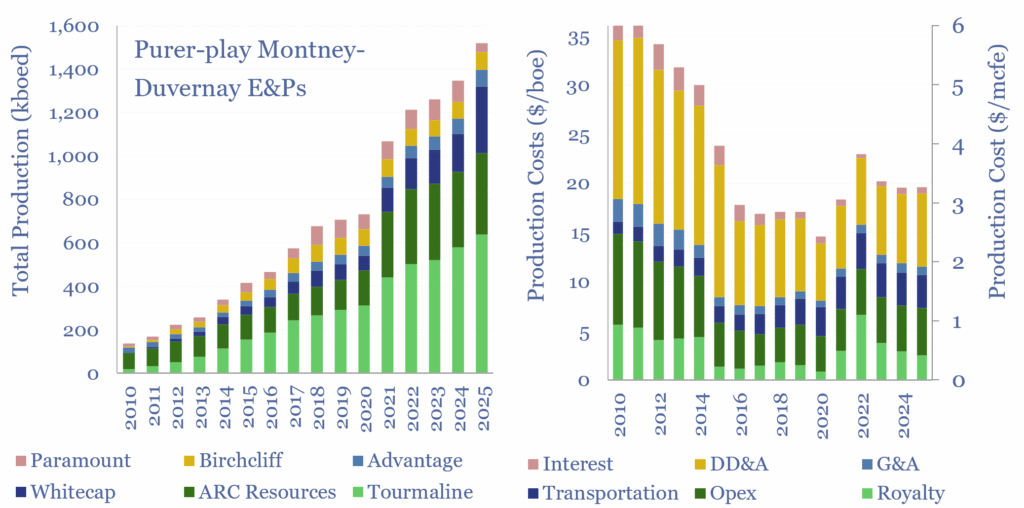
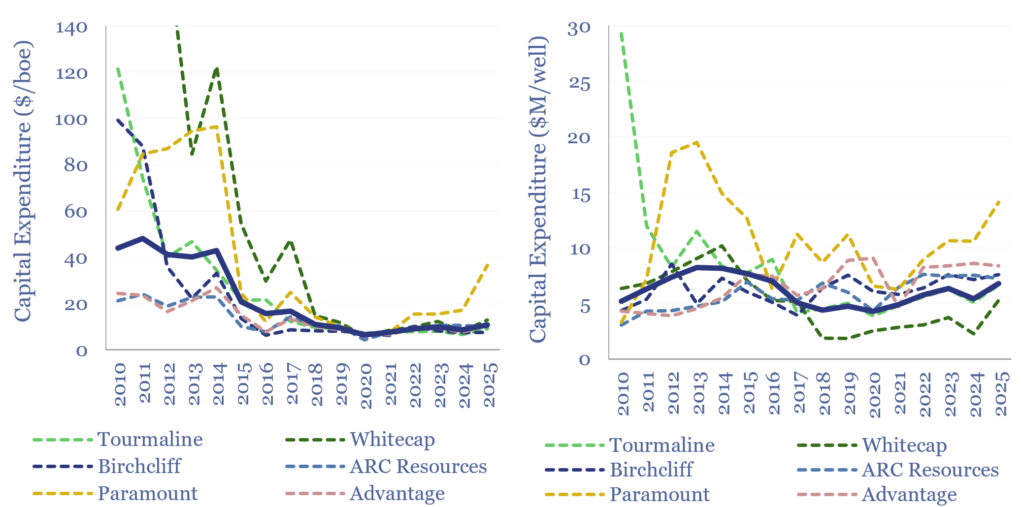
Falling costs and improving performance are cited for Canadian shale producers. The average Canadian shale well costs $7M, which is -60% less than typical wells in the US shale gas basins, although the EURs per well are also 40-60% lower, including due to c30-50% shorter lateral lengths. This approach is more capital efficient, at least for now, and many Canadian shale E&Ps claim to generate 50-100%+ well-level IRRs.
The full data-file contains an overview of each company, its market cap ($M), net debt ($M), enterprise value ($M), NPV10 of 2P reserves ($M), production (kboed), capex costs ($M), cost breakdown ($/boe, $/mcfe), and notes on recent performance improvements and production goals.