Global shale basins are currently producing 12Mbpd of liquids and 110bcfd of gas, across over 20 basins, with over 1 trn bbls of oil resources and 13,000 TCF of gas resources. 3% of all global shale resource has been produced to date. This data-file tabulates resources and production across each basin.
Shale resources in-place can be modeled, simplistically, by multiplying a basin’s size (in square kilometers) by its shale’s average thickness (in meters), average total organic content (in %), and then juggling the units. Shale resources recoverable can then be modeled by multiplying with an estimated recovery factor. We use 6% for liquids and 22.5% for gas.
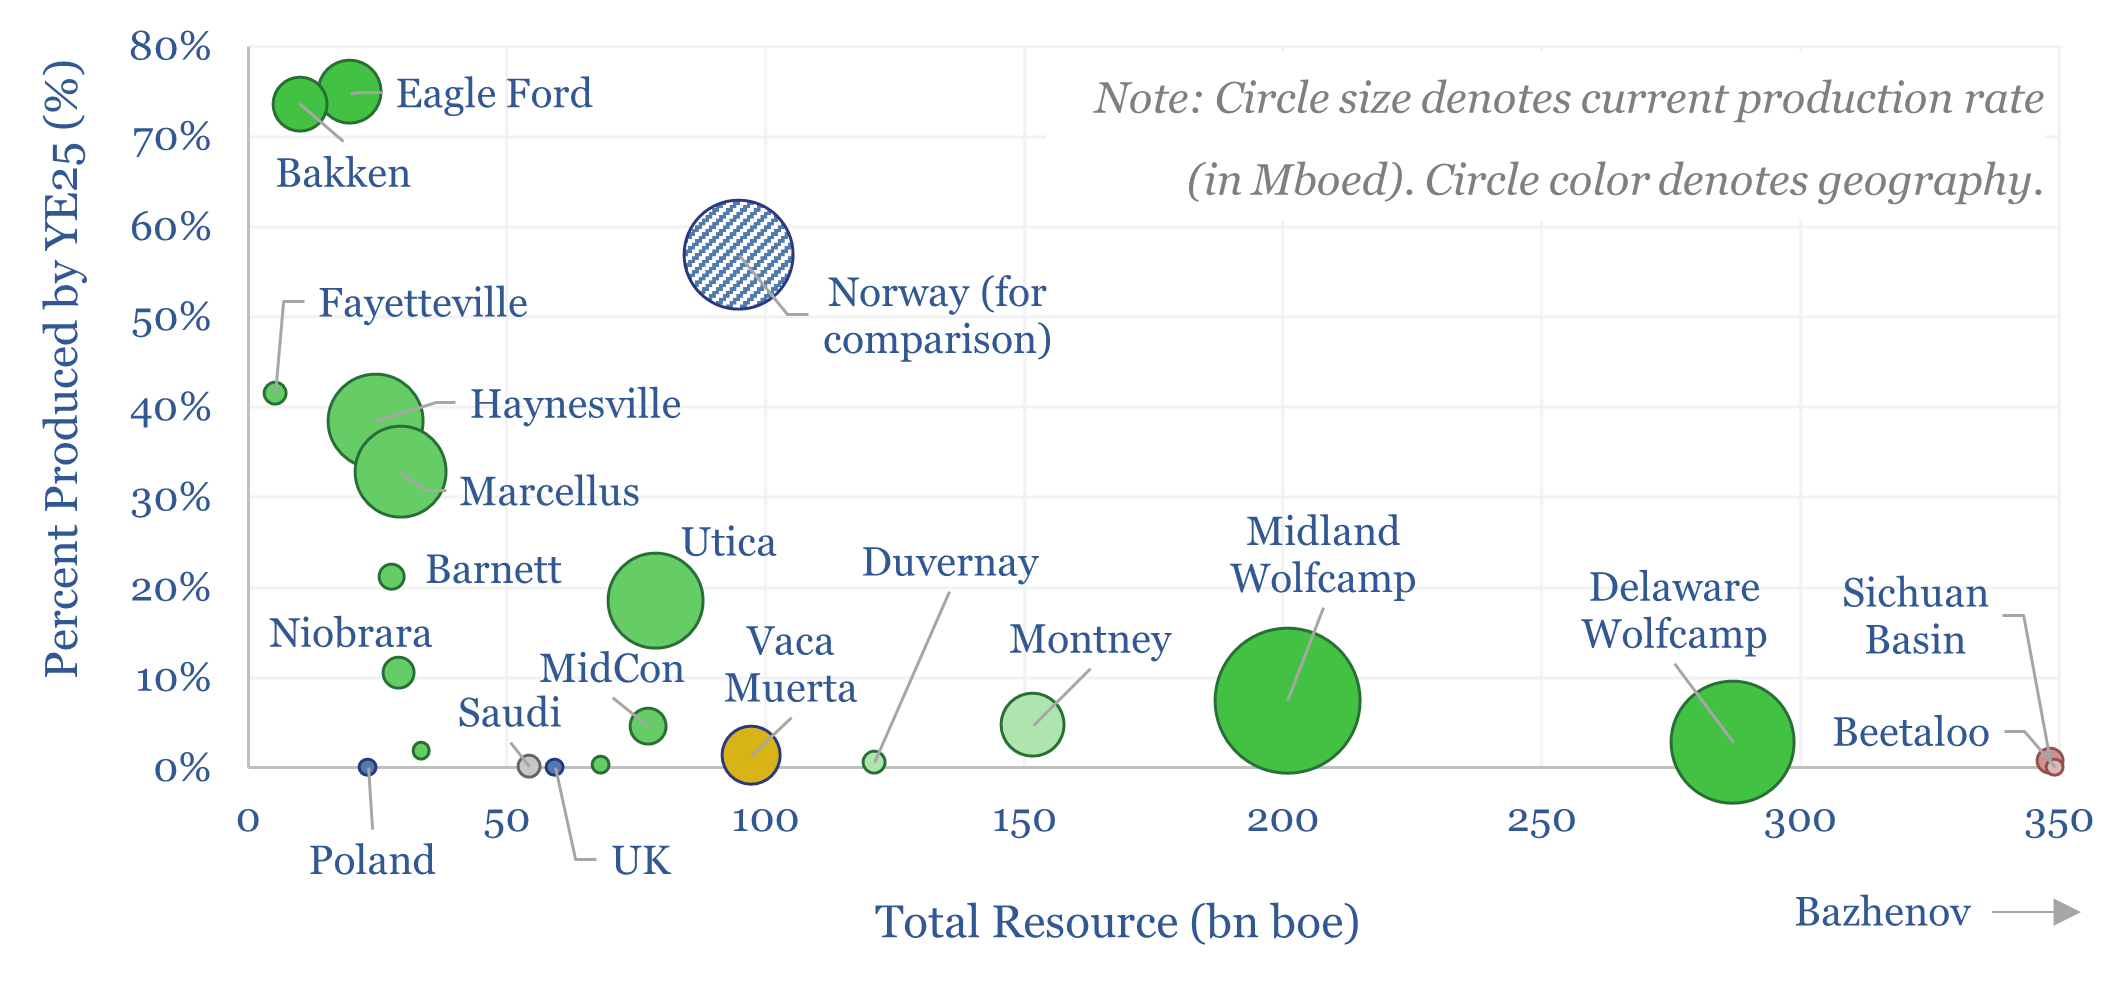
We have estimated these parameters for over 20 different shale basins globally, suggesting over 6 trn m3 of hydrocarbons in place, of which 2 trn m3 are in the United States. The ease of developing this shale also hinges on its depth (in meters), porosity (in %), its clay content (in %, as clay makes rocks softer, less brittle, and thus hinders the efficacy of hydraulic fracturing, see Poland!) and its liquids/gas ratio.
We have also tabulated the recent production, and total historical production across each shale basin, to see how close to maturing each basin is, reaching around 30-40% in the US’s main shale gas plays such as the Haynesville and the Marcellus (which are thus still setting new highs in resource productivity) and over 70% in the Eagle Ford and Bakken (which are thus rolling over in productivity). Ramping US shale has changed the world. And we estimate only c11% of total US shale resources have been produced.
US shale is however going to shift to the Permian over time. Even at 10Mboed of production, we estimate that only 5% of Permian resources have been produced. The current production rate could perhaps be sustained for a century. And this is before developing the Marcellus-equivalent of gas in Paleozoic shales that underpin the Wolfcamp.
International shale is also accelerating. Canada’s Montney formation is a giant, slowly awakening, producing 1.9Mboed today. Some sources estimate total Montney resources at 450TCF, but our simple ‘tank model’ sees at least 2x more resources again. Less than 3% of Canada’s shale resources have been produced. This really makes you wonder about the potential for unleashing Canadian Energy, especially towards Asian markets.
Argentina’s Vaca Muerta and China’s Sichuan basin make up the remainder of today’s global shale production. <2% of Argentina’s shales have been tapped. China’s shales are the deepest in the world. Moreover, in principle, Saudi Arabia is also ramping up its Jafurah shale this year, en route to 2bcfd by 2030.
Australia looks most exciting as a region that could join the ranks of shale producers and transform its weirdly undersupplied domestic gas market. The Velkerri shale, in the Beetaloo basin, is actually the ‘oldest’ shale of any basin in our data-file. But if we use our simple ‘tank model’, it is also enormous, due to a very thick formation (often up to 400m). In April-2026, Tamboran Resources noted a 20-day IP rate of 10.3mmcfd on an 8,635ft horizontal section of a Beetaloo test well. For perspective, a Marcellus well IPs at 22mmcfd from an 11,400 ft lateral in 2025.
Europe is shooting itself in the foot, by being the only major region with large shale resources to have banned producing them, so that it can instead, pay some of the highest gas prices in the world. In 2026, there are quiet discussions ongoing about unbanning hydraulic fracturing and revisiting Bowland basin shale. We track broader European shales separately.
Global shale basins, their parameters, resources, production and our notes, are tabulated in the data-file.