Shale
-
US shale: outlook and forecasts?
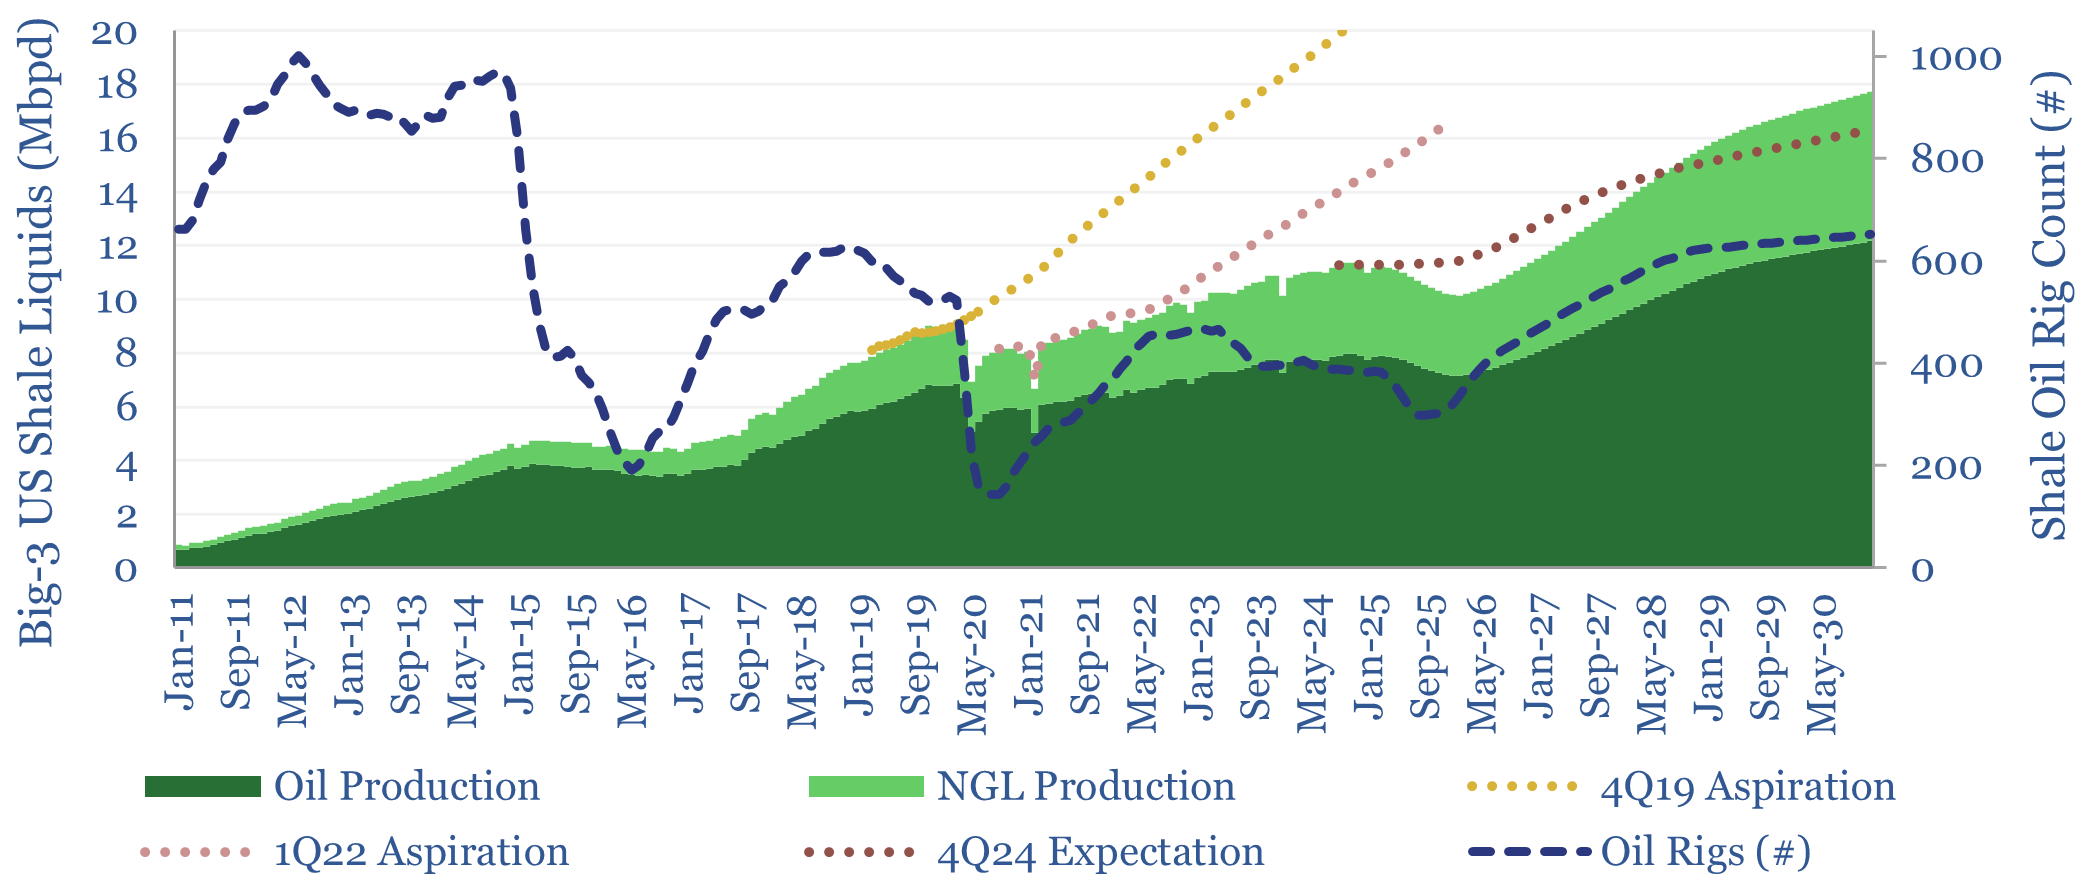
This model sets out our US shale production forecasts by basin. It covers the Permian, Bakken, Eagle Ford, Marcellus/Utica and Haynesville, as a function of the rig count, drilling productivity, completion rates, well productivity and type curves. The data-file was last updated in May-2025, revising liquids growth negative in 2025-26, which in turn tightens US…
-
Shale water costs: transport, treatment and disposal?
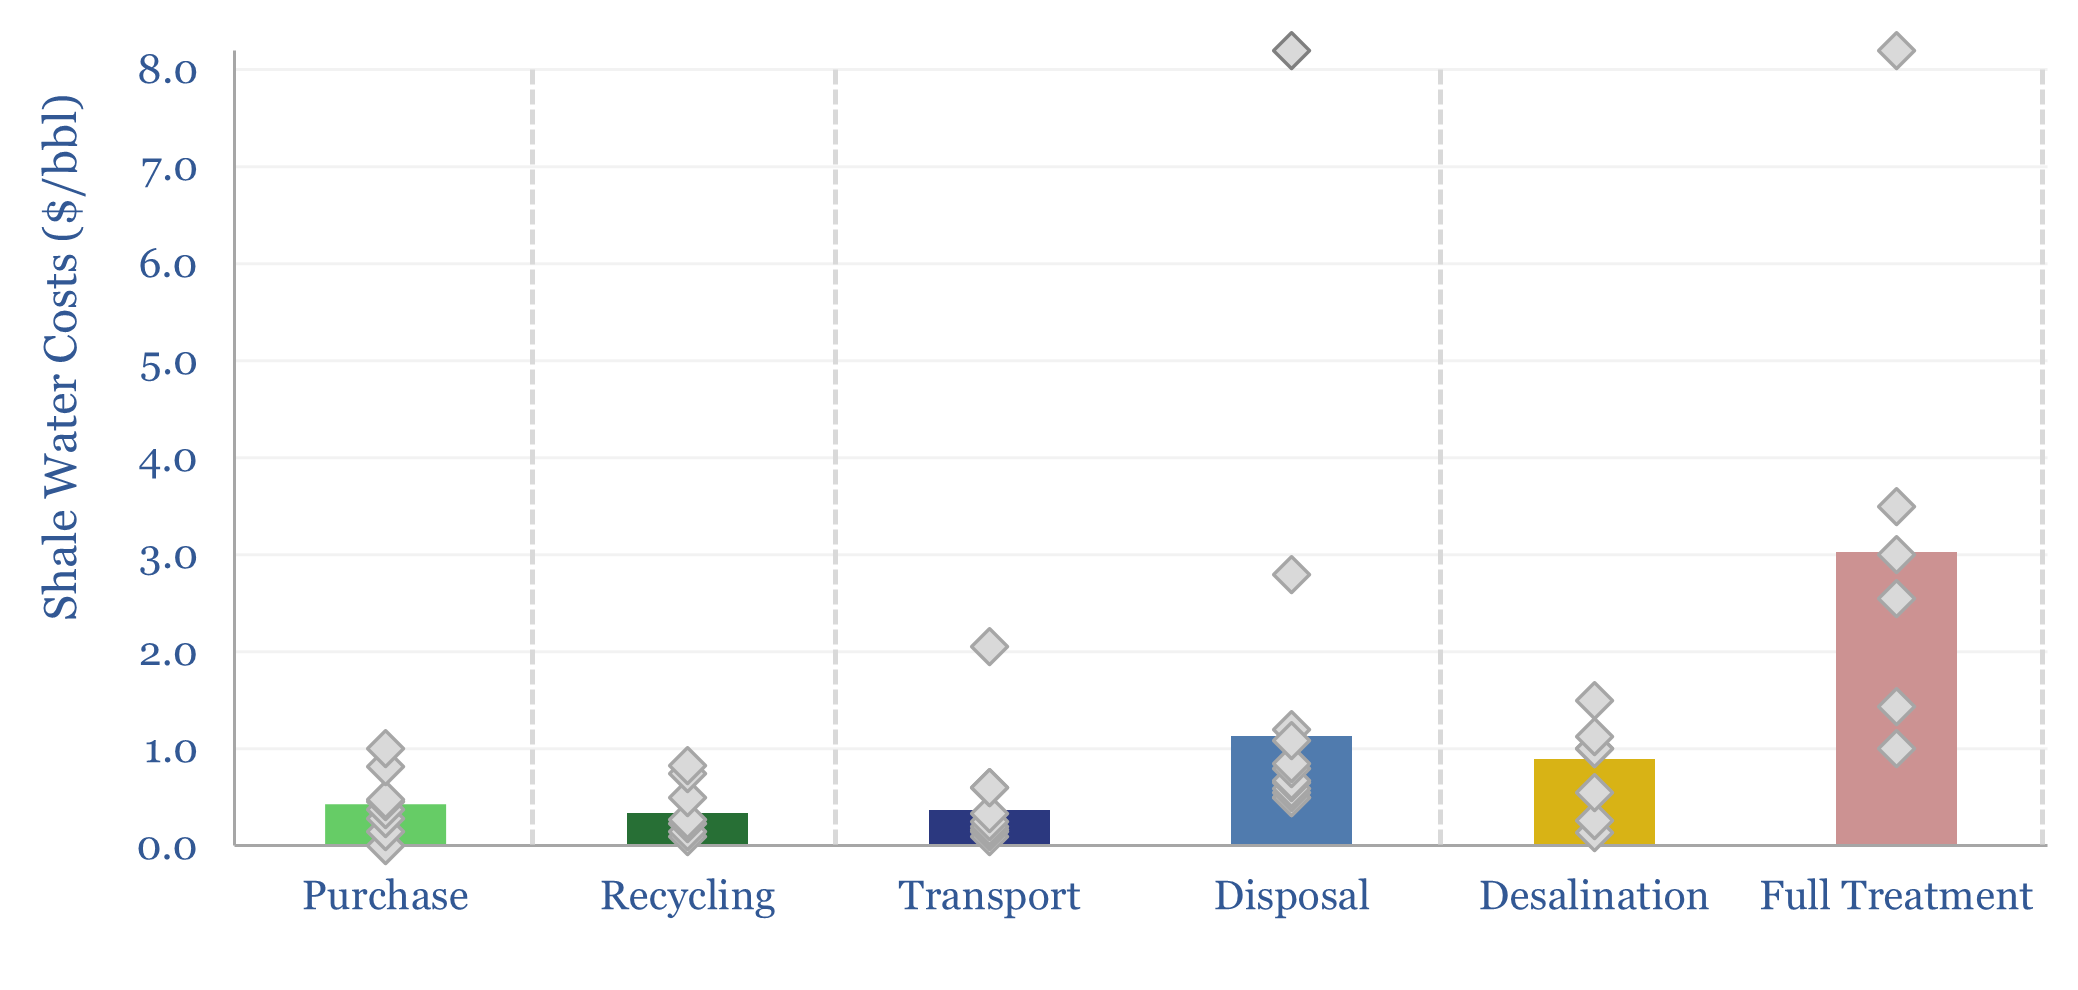
Shale water costs might average $0.3/bbl for filtering and recycling, $0.4/bbl to procure new water, $1/bbl for disposal and $3/bbl for full treatment back to agricultural/cooling-quality water. There is variability in water properties and throughout shale basins. This data-file aggregates disclosures into shale water costs.
-
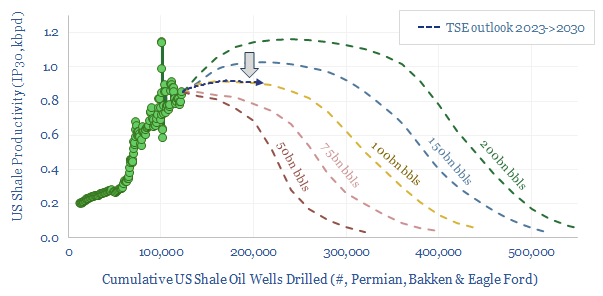
Shale oil: fractured forecasts?

This 17-page note makes the largest changes to our shale forecasts in five years, on both quantitative and qualitative signs that productivity growth is slowing. Productivity peaks after 2025, precisely as energy markets hit steep undersupply. We still see +1Mbpd/year of liquids potential through 2030, but it is back loaded, and requires persistently higher oil…
-
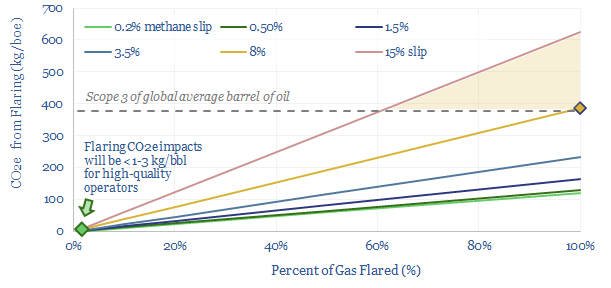
Flaring reduction: fire extinguishers?

Controversies over oil industry flaring are re-accelerating, especially due to the methane slip from flares, now feared as high as 8% globally. The skew entails that more CO2e could be emitted in producing low quality barrels (Scope 1) than in consuming high quality barrels (Scope 3). Environmental impacts are preventable. This 10-page note explores how,…
-
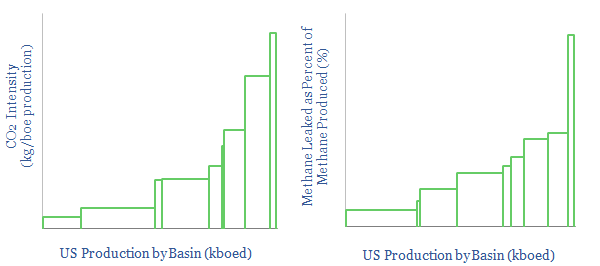
US CO2 and Methane Intensity by Basin

The CO2 intensity of oil and gas production is tabulated for 425 distinct company positions across 12 distinct US onshore basins in this data-file. Using the data, we can aggregate the total upstream CO2 intensity in (kg/boe), methane leakage rates (%) and flaring intensity (in mcf/boe), by company, by basin and across the US Lower 48.
-
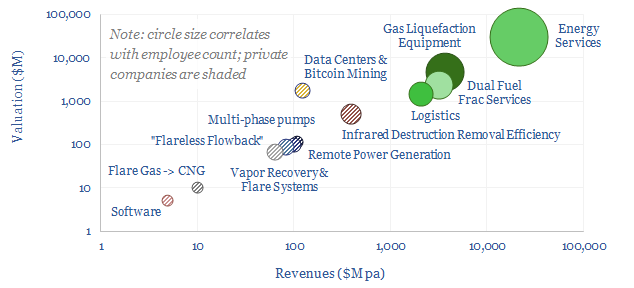
Flaring reduction: screen of service and equipment companies?

This data-file is a screen of companies that can reduce routine flaring and reduce the ESG impacts of unavoidable residual flaring. The landscape is broad, ranging from large, listed and diversified oil service companies with $30bn market cap to small private analytics companies with
-
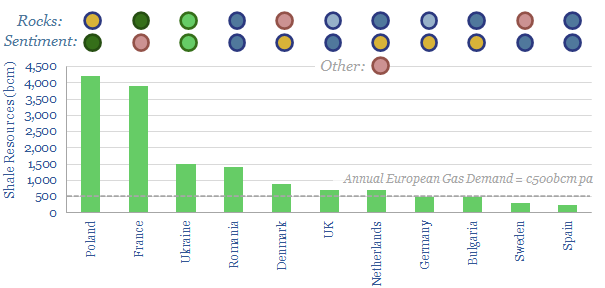
European shale: an overview?

Europe has 15 TCM of technically recoverable shale gas resources. This data-file aims to provide a helpful overview, as we expect exploration to re-accelerate. Ukraine has the best shale in Europe, which may even be a motivation for Russian aggression. Other countries with good potential, held back only by sentiment are Romania, Germany, UK, Bulgaria…
-
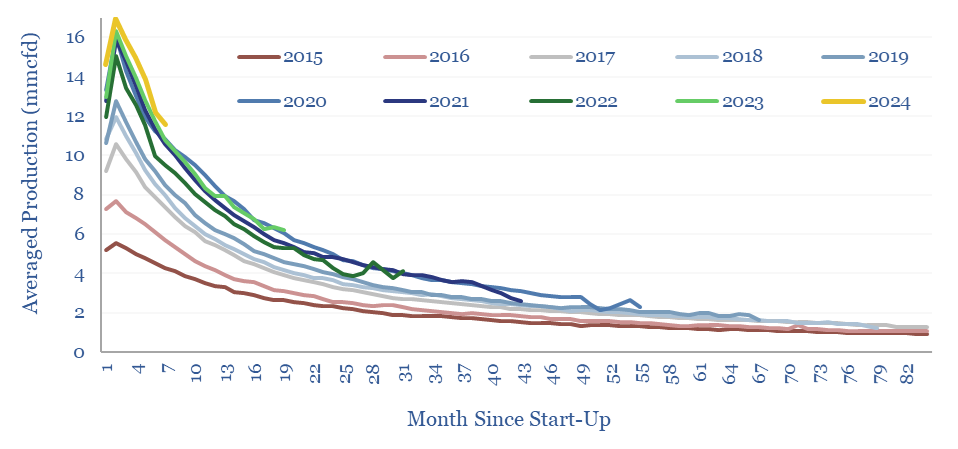
Marcellus shale: well by well production database?

This large data-file tracks activity, well-by-well, across c11,000 wells in the Pennsylvania Marcellus, month-by-month, from 2015-2021. First tier operators stand out, especially as the basin has consolidated. They achieve higher IP rates and have been able to do more with less.
-
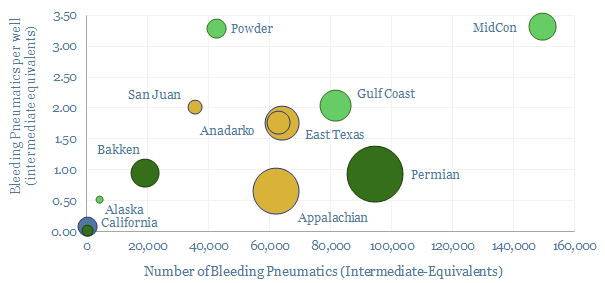
Methane emissions from pneumatic devices: by operator, by basin?

Methane leaks from 1M pneumatic devices across the US onshore oil and gas industry comprise 50% of all US upstream methane leaks and 20% of upstream CO2. This file aggregates the data. Rankings reveal operators with a pressing priority to replace >100,000 medium and high bleed devices, and other best-in-class companies.
-
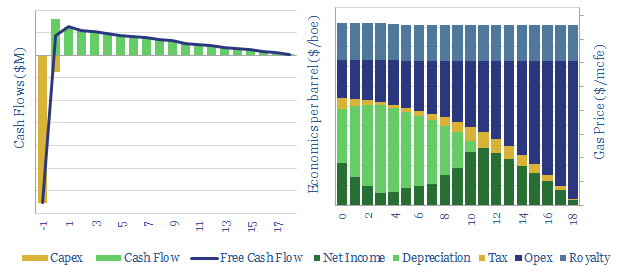
US shale gas: the economics?

This data-file breaks down the economics of US shale gas, in order to calculate the NPVs, IRRs and gas price breakevens. There is a perception that the US has an infinite supply of gas at $2/mcf, but rising hurdle rates and regulatory risk may require higher prices.
Content by Category
- Batteries (88)
- Biofuels (44)
- Carbon Intensity (49)
- CCS (63)
- CO2 Removals (9)
- Coal (38)
- Company Diligence (93)
- Data Models (834)
- Decarbonization (160)
- Demand (110)
- Digital (59)
- Downstream (44)
- Economic Model (203)
- Energy Efficiency (75)
- Hydrogen (63)
- Industry Data (278)
- LNG (48)
- Materials (82)
- Metals (79)
- Midstream (43)
- Natural Gas (148)
- Nature (76)
- Nuclear (23)
- Oil (164)
- Patents (38)
- Plastics (44)
- Power Grids (127)
- Renewables (149)
- Screen (116)
- Semiconductors (30)
- Shale (51)
- Solar (67)
- Supply-Demand (45)
- Vehicles (90)
- Wind (43)
- Written Research (352)